Abstract
Comparative interactomics is a strategy for inferring potential interactions among orthologous proteins or “iginterologs”. Herein we focus, in contrast to standard homology-based inference, on the divergence of protein interaction profiles among closely related organisms, showing that the approach can correlate specific traits to phenotypic differences. As a model, this new comparative interactomic approach was applied at a large scale to human papillomaviruses (HPVs) proteins. The oncogenic potential of HPVs is mainly determined by the E6 and E7 early proteins. We have mapped and overlapped the virus-host protein interaction networks of E6 and E7 proteins from 11 distinct HPV genotypes, selected for their different tropisms and pathologies. We generated robust and comprehensive datasets by combining two orthogonal protein interation assays: yeast two-hybrid (Y2H), and our recently described “High-Throughput Gaussia princeps Protein Complementation Assay” (HT-GPCA). HT-GPCA detects protein interaction by measuring the interaction-mediated reconstitution of activity of a split Gaussia princeps luciferase. Hierarchical clustering of interaction profiles recapitulated HPV phylogeny and was used to correlate specific virus-host interaction profiles with pathological traits, reflecting the distinct carcinogenic potentials of different HPVs. This comparative interactomics constitutes a reliable and powerful strategy to decipher molecular relationships in virtually any combination of microorganism-host interactions.
Keywords: comparative interactomics, HPV, E6, E7, interactome, complementation assay
1. Introduction
Deciphering host-pathogen protein-protein interactions (PPI) is a way to understand how pathogens exploit host cell machinery, to assess the pathophysiology of infectious diseases and to conceptualize it in molecular terms [1]. For high-throughput screening (HTS) projects that aim at exploring systematically the PPI networks of human and model organisms, current technologies like yeast two-hybrid (Y2H) provide efficient tools to interconnect pathogen proteins with host interaction networks, Y2H thus opens a path toward an integrative understanding of infectious disease pathogenesis, provided that accuracy and completeness of PPI networks is properly measured [2, 3]. To solve this recurrent problem in interactomic studies, we have recently developed an orthogonal validation system in human cells called HT-GPCA (high-throughput Gaussia princeps complementation assay), which allows an efficient filtering of raw interaction data obtained by HTS. This new high-throughput HT-GPCA is a cell-based system which can be performed in a 96-well plate format and is compatible with standard recombinatorial cloning systems (Gateway®, Invitrogen)[4].
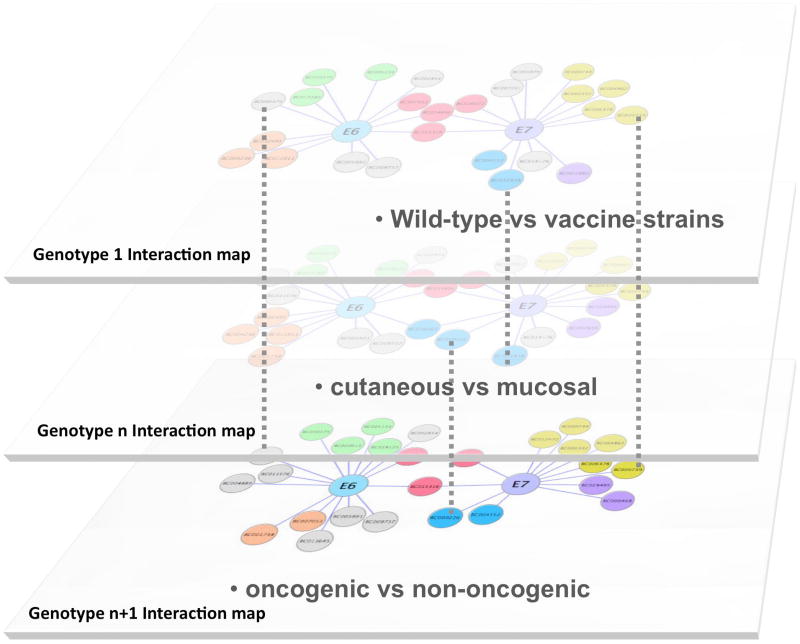
Large compendiums of pathogen-host interaction data would become more useful if pathogenic traits could be correlated to specific interaction properties [5–7]. To address this issue, we propose herein a comparative interactomic strategy that conceptually inverts the classical approach based on the assumption that protein interactions are conserved through evolution [8, 9]. We tackled the problem from a different angle by focusing instead on sequence divergence. Since closely related pathogens often display strong phenotypic differences in tropism or pathogenicity, comparison of their interaction maps should help to discriminate unvarying core pathogen-host PPIs from those PPIs involved in virulence (Fig. 1). Viruses are ideal pathogens to address this type of question, given their tremendous diversity and small genomes that only encode for small numbers of proteins.
Fig. 1.
Schematic description of the comparative interactomics approach. For E6 and E7, virus-host interaction maps from different HPV genotypes were stratified to characterize shared and specific cellular targets, and identify links between specific interactomic properties of E6 and E7 and HPV pathological traits or tropism.
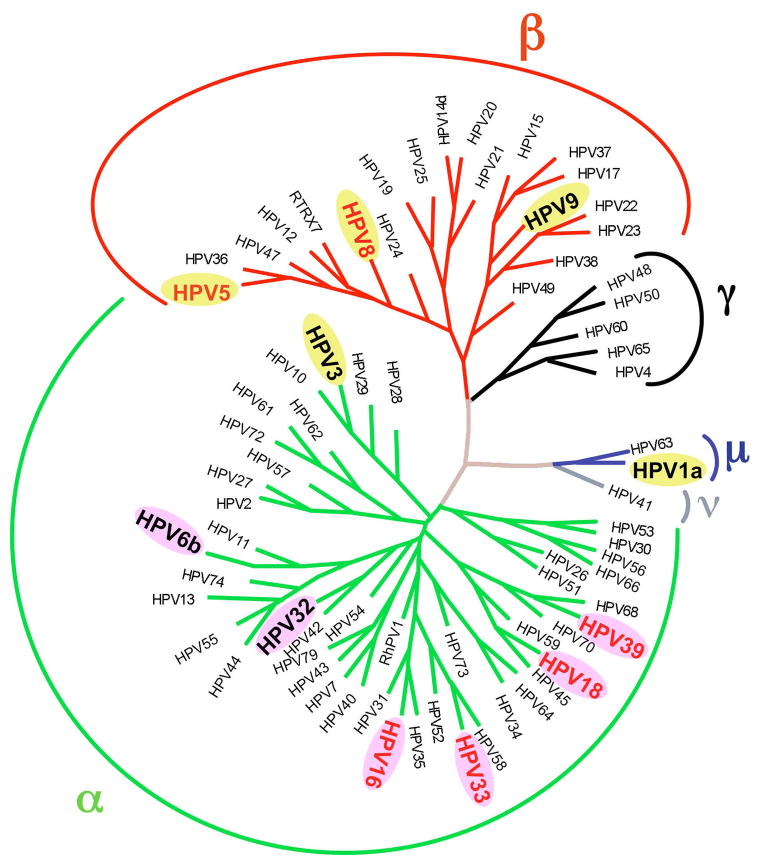
DNA viruses such as papillomaviruses combine genome stability with large genotype diversity, and represent a prototypic model whose interest is reinforced by the existence of several associated diseases with clinical seriousness such as cervical cancer (Fig. 2; [10]). Of the more than 150 HPV genotypes characterized by their nucleotide sequence (Papillomavirus Episteme; http://pave.niaid.nih.gov/#home), at least 20 are associated with cervical cancer, the most prevalent malignancy in women worldwide. Of these, HPV types 16 and 18 are found in 70% of cervical cancer. HPVs have also been associated with many kinds of diverse epithelial lesions, ranging from benign skin or genital warts to cancer. HPVs are thus classified according to their tropism (cutaneous vs. mucosal) or their carcinogenic potential (low vs. high-risk; LR or HR-HPVs). The pathogenesis of HPVs essentially relies on a complex interplay between the early E6 and E7 early viral proteins and the host proteome.
Fig. 2.
Phylogenetic tree of HPV genotypes generated using L1 sequence variability highlighting their belonging to five different genera: α, β, γ, μ and ν. The 11 HPV genotypes selected for this work belong to three different genera, the α genus illustrated with green branches, β in red and μ in blue. Selected genotypes are magnified, high-risk HPV types are written in red while low-risk are in black; cutaneous and mucosal HPVs are tagged in yellow and purple respectively. The phylogeny based on an alignment performed on the L1 gene was performed using the Phylip 3.5 program with a weighted version of the neighbor-joining analysis. The tree was constructed using Treview software.
The two HPV proteins E6 and E7 exhibit multifunctional properties, despite their small size (150 and 100 amino acids, respectively). E6 contains two CxxC repeats in a zinc-binding module (ZnBD) flanked by two short adjacent domains, whereas E7 exhibits an intrinsically unstructured amino-terminal region followed by a single CxxC ZnBD [11–13]. Interactions between E6 and E7 proteins from genital HR-HPVs and host cellular factors have been documented. These include the binding to and inactivation of the p53 tumour suppressor p53 and the retinoblastoma protein pRb [14–17] to subvert cell proliferation, apoptosis, and cellular immunity during infection [18–22]. Although these interactions provide a rational etiological basis for HPV-induced cervical cancer, the virus-host interplay situation is more complex and differs greatly according to the HPV genotype. The specificity of these interactions for genital HR- HPVs is controversial [23, 24] and little is known about the host protein interactions of other HPV genotypes.
2. Materials
2.1. Cell lines and transfection reagent
HEK-293T cells (ATCC) were grown and maintained in Dulbecco’s Modified Eagle’s Medium (DMEM), supplemented with 10% FCS, 2 mmol/l L-glutamine, 100 units/ml penicillin and 100 μg/ml streptomycin at 37°C with 5% CO2 and 95% humidity. Plasmid transfections used the linear polyethylenimine PEI “MAX” protocol (Cat# 24765, Polysciences Inc).
3. Description of method
3. 1. Plasmid constructs
The 22 viral ORFs encoding for E6 and E7 of 11 HPV genotypes were amplified by PCR and cloned by in vitro recombination (Gateway® recombinatorial cloning system, Invitrogen) into the entry vector pDONR207 or pDONR223 as previously described [25]. Corresponding ORFs were subsequently transferred into Gateway-compatible Y2H destination vector (pGBK-T7) to generate GAL4 DNA-binding domain (DB) fusion proteins or into a Gateway®-compatible HT-GPCA destination vector (pSPICA-N2).
HT-GPCA vectors (pSPICA-N1 and pSPICA-N2) express the Gluc1 and Gluc2 fragments of the humanized Gaussia princeps luciferase as previously described [26], but with the following modifications. Gluc1 or Gluc2 fragments were linked to the N-terminal ends of tested proteins by a flexible hinge polypeptide of 20 amino acid residues. To normalize expression levels, a Kozak consensus translation start sequence was included at the N-terminal end of the fusion protein. Gluc1 and Gluc2 tagged-proteins were expressed from a similar mammalian Gateway®-compatible expression vector derived from the pCiNeo plasmid [4].
ORF entry clones corresponding to cellular partners were obtained either by PCR amplification from a human keratinocyte HaCaT library and recombinatorial cloning into pDONR207 or directly from the Human ORFeome resource (hORFeome v3.1). Cellular ORFs were subsequently transferred into the Gateway®-compatible HT-GPCA destination vector (pSPICA-N1). Sequences and orientations of DNA constructs were verified by sequencing.
3. 2. Yeast two-hybrid
E6 and E7 genes from 11 HPVs were fused to the GAL4 DNA binding domain in pGBKT7 (pGBKT7-E6 and pGBKT7-E7 bait plasmids), and used to screen a Matchmaker cDNA library derived from the human keratinocyte HaCaT cell line (Clontech). The complexity of this cDNA library was about 2.5 × 10⁶ independent inserts with an average size of 1.5 kb. This cDNA library was cloned into the pACT2 vector (Clontech), and then transformed into the Y187 yeast strain (MATα ura3–52 his3–200 ade2–101 trp1–901 leu2–3,112 gal4Δ mel gal80Δ URA3::GAL1UAS- GAL1TATA-lacZ) using a standard large scale transformation procedure in order to obtain about 107 individual yeast colonies corresponding to a 4 time coverage of the cDNA library. In parallel, pGBKT7-E6 and pGBKT7-E7 were established in the AH109 yeast strain (MATa trp1–901 leu2–3,112 ura3–52 his3–200 gal4Δ gal80Δ LYS2::GAL1UAS-GAL1TATA-HIS3 GAL2UASGAL2TATA-ADE2 URA3::MEL1UAS- MEL1TATA-lacZ). E6 and E7 viral baits were used to screen the keratinocyte cDNA library by mating. A mix of AH109 and Y187 yeasts were plated for 4h at 30°C on solid medium containing yeast extract, peptone and dextrose at pH 3.5 (YCM). Mated yeast cells were grown for 5 days on synthetic dextrose medium lacking tryptophan, leucine, and histidine and containing a specific concentration for each bait of 3-aminotriazole (3AT) to select for diploids that showed elevated expression of the GAL1::HIS3 Y2H reporter. Screens were repeated several times to eventually collect a minimum of 250 positive yeast colonies for each bait. In total we selected 3,500 and 3,100 HIS3 positive colonies for E6 and E7 respectively. The corresponding prey cDNAs were PCR amplified, sequenced, and the resulting sequences analyzed with BLAST.
3. 3. Databases
To identify the cellular partners obtained by Y2H screening the cDNA sequences from positive yeast colonies were analysed by local BLAST at the Institut Pasteur (I-MAP server). This multiparallel BLAST compares obtained sequences to six different sequence databases (Prodom, Cdd, Ensembl45 proteins, Ensembl45 cDNA, EMBL Homo sapiens DNA, Uniprot). Among the 621 and 316 cellular prey proteins identified as interacting with the respective E6 and E7 proteins, one subset was selected for E6 and a second for E7 based on (i) their frequency of appearance in the Y2H screen, (ii) the presence of specific domains or (iii) their functional relevance as assessed using DAVID software (http://david.abcc.ncifcrf.gov) [27]. These criteria led to the selection of 94 prey proteins for E6 and 88 prey proteins for E7, To these were added select literature-curated interactors of E6 and E7, together comprising our Gold-Standard (GS) set of virus-host interactions.
3. 4. Sensing Protein-protein Interactions by High-Throughput Gaussia princeps luciferase Complementation Assay
HEK-293T cells were seeded in 96-well plates (Greiner Bio-One, cat. n° 655 083) at a concentration of 3.2 × 10⁴ cells per well. After 24 h, cells were transfected with 100 ng of HT-GPCA plasmid constructs expressing HPV E6 or E7 and cellular partners using PEI, generating matrices of 1,100 protein pairs for E6 (i.e. 94 cellular partners identified by HT-Y2H plus 6 known cellular partners that were not recovered by HT-Y2H against 11 HPV genotypes) and 1,067 for E7 (i.e. 88 cellular partners identified by HT-Y2H plus 9 known cellular partners that were not recovered by HT-Y2H against 11 HPV genotypes). At 24 h post-transfection, cells were harvested with 30 μl of Renilla Lysis Buffer (Promega, E2820) for 30 min, and Renilla luciferase enzymatic activity was measured using a Berthold Centro XS LB960 luminometer by injecting 100 μl of Renilla luciferase assay reagent (Promega, E2820) into cell lysates and counting luminescence for 10 sec.
HT-GPCA experiments were performed in duplicate for both the E6 and E7 datasets. HT-GPCA results were expressed as a fold change normalized over the sum of controls, specified herein as Normalized Luminescence Ratio (NLR). For a given protein pair A–B, luminescence activity of cells transfected with “Gluc1-A + Gluc2-B” was divided by the sum of luminescence activity for control wells transfected with “Gluc1-A + empty Gluc2 vector” and “empty Gluc1 vector + Gluc2-B”. Thus, . For each interaction, the final result is calculated as the mean of the NLR values displayed in duplicate experiments. Homogeneity between the two datasets was high, with Pearson correlation coefficients of 0.9932 and 0.9908 for E6 and E7 respectively.
3. 5. Agglomerative Hierarchical Clustering
All analyses used components of the R statistics package [28]. For E6 and E7 proteins, raw NLR data were separated into 10 different categories to minimize the dispersion of NLR intensity values inherent to the experimental procedure. Cut-off thresholds of each category were determined with the aim of maintaining the same frequency distribution across all categories. A Euclidean distance matrix was calculated between each pair of E6 or E7 from the intensity data categories using the “dist” function in R. The distance matrix was used to group the virus proteins by hierarchical clustering using the “hclust” function in R. The strains for each viral protein were clustered using the “dist” and “hclust” functions in R.
For both E6 and E7, viral protein sequences were clustered using the ‘phylip’ package [29]. The protein distances were calculated with the protdist program using the default parameters. The dendrogram was calculated with the ‘neighbor’ program using the UPGMA method.
The cophenetic distance was calculated for both sequence-based and HT-GPCA-based dendrograms. The cophenetic distance is used to determine the “closeness” of two dendrograms. In our calculation, only the branching pattern was considered, regardless the length of branches. The Pearson correlation coefficient was calculated with the ‘cor’ function in R using the two cophenetic distances. A p-value was also calculated by generating a random reordering of the strain intensity data and then calculating the dendrogram with the same method as described above. The cophenetic distance for the dendrogram was compared to the genomic cophenetic distance with the ‘cor’ function. 100,000 random dendrograms were calculated. P-values were calculated based on the number of standard deviations distant the HT-GPCA dendrogram was from the random dendrogram set.
3. 6. Correspondence Analysis
To determine which human proteins were either positively or negatively associated with one or more viral strains, a correspondence analysis was performed using the ‘dudi.coa’ function from the ‘ade4’ package in R [30]. The graphic was produced using the ‘scatter.coa’ function from the ‘ade4’ package.
4. High-throughput yeast two-hybrid mapping of E6 and E7 interactors
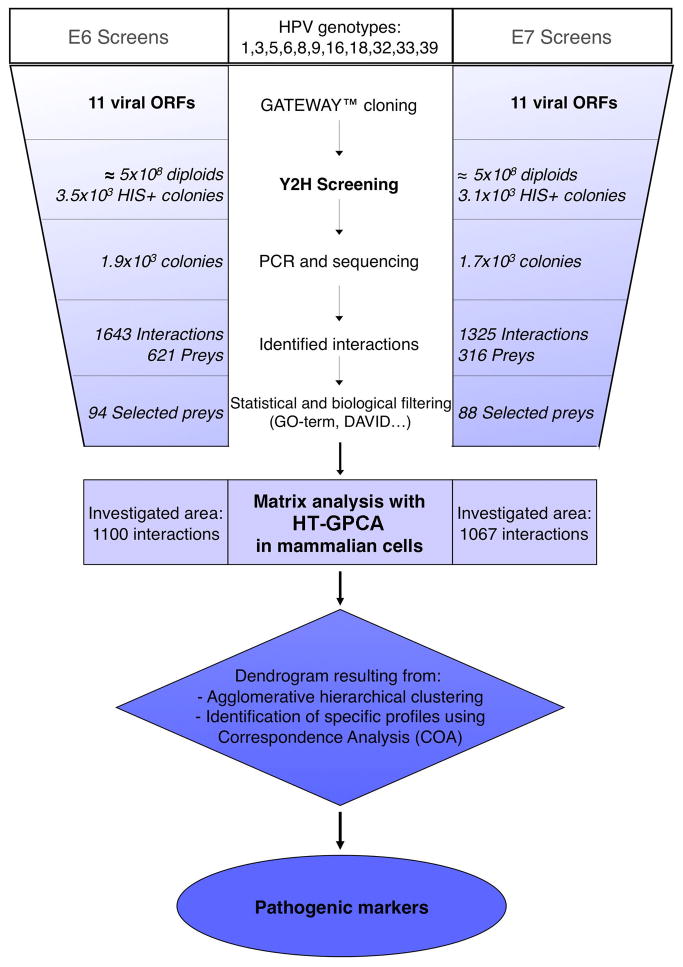
To correlate specific interaction profiles with pathogenic traits of HPV genotypes, we performed successive Y2H screens to identify cellular partners of E6 and E7 oncoproteins for a selected set of 11 HPV genotypes. We selected six mucosal HPVs and five cutaneous HPVs, including genotypes associated with either low or high risk of developing cancer (Fig. 2). The 22 ORFs encoding for E6 and E7 proteins from these 11 HPV genotypes were cloned by in vitro recombination into a Y2H vector to be expressed in fusion with a N-terminal GAL4 DNA-binding domain (DB). These clones were used as baits in a high-throughput Y2H (HT-Y2H) screen against a human keratinocyte (HaCaT) cDNA library (Fig. 3). The initial E6 and E7 screens identified 1643 and 1325 virus-host interactions respectively, corresponding to 621 and 316 distinct cellular interactors for E6 and E7, respectively. A significant number of interactions shared between the different genotypes could be seen (Supplementary Table S1 and S2). Raw data obtained from Y2H screens cannot be directly used to compare E6 and E7 interaction profiles among the 11 HPV genotypes. Although these raw data can contain false-positive interactions, such artefacts are readily removed with statistical filters that extract genuine interactions from noise. The more pressing problem is that Y2H datasets are incomplete and contain missing information [2]. As a consequence, cellular proteins identified in an initial Y2H screen have to be retested individually, against E6 or E7 from the 11 HPV genotypes. Here we show how to use HT-GPCA for retest evaluation.
Fig. 3.
Flowchart depicting the different steps used in the comparative interactomic strategy. The 22 viral open reading frames (ORFs) corresponding to E6 and E7 proteins from 11 HPV genotypes were inserted into the pGBKT7 vector in frame with the Gal4 DNA-binding domain using a recombinatorial cloning system (Gateway®). These clones were used as bait in a high-throughput mating-based Y2H screening against a human keratinocyte cDNA library (2.5 × 10⁶ individual clones). The cDNAs of HIS3 positive colonies were PCR amplified, sequenced and identified by BLAST. A statistical and biological filtering technique was used to select a high-confidence set of 94 preys for E6 and 88 for E7. A high-throughput mammalian interaction validation assay based on Gaussia princeps luciferase complementation (HT-GPCA) was next performed. Agglomerative Hierarchical Clustering was used to perform intergenotypic comparisons of the E6 and E7 interaction profiles and identify genotype-specific cellular targets by correspondence analysis.
5. Building a matrix of prey proteins targeted by E6 and E7 oncoproteins
To obtain higher confidence sets of interactors for E6 and E7 on which to apply HT-GPCA retest, we selected only cellular preys that were isolated at least three times in the initial Y2H screens (hits ≥3). This filter was previously used to discard false-positive interactions generated by stochastic activation of reporter genes, a difficulty inherent to Y2H [31]. We also removed prey proteins whose predominant subcellular localization was incompatible with the interactions. On the other hand, we retained some preys with a low score (hits <3) because of their structural and functional coherence with previously selected preys, as determined by clustering using protein domains, functional categories, and gene ontology attributes (GO terms) [27]. Our objective in this filtering was not to be exhaustive, but to provide sets of markers for HT-GPCA retest for both E6 and E7 tractable in a 96-well format.
We eventually selected two filtered sets of cellular preys, 94 interactors for E6 and 88 for E7 (Supplementary Tables S3 and S4). Most of these PPIs are novel, not in the set of about 50 interactions previously reported in literature for E6 or E7 (see literature-curated interaction set; LCI, Supplementary Tables S8 and S9). The 8% overlap between our filtered Y2H set and LCI consists of four E6 interactors (TADA3L, SIPA1L1, IRF3 and SMAD3) and four E7 interactors (FHL2, IGFBP3, CAPNS1 and IRF1), an overlap value in the range of previous reported overlaps of LCI to HT-Y2H datasets [32].
6. High-throughput validation of PPI in human cells
Coverage and robustness of PPI datasets is effectively increased by combining the results of complementary PPI assays [2, 33]. To achieve this goal, we applied our recently reported HT-GPCA assay [4]. In this protein complementation assay (PCA), bait and prey proteins are fused to two inactive fragments of the Gaussia princeps luciferase. When these two fragments are brought into close proximity by interaction between the fused bait and prey proteins luciferase enzymatic activity in mammalian cells is restored. Results are expressed as normalized luminescence ratios (NLR). This assay was benchmarked against both a positive reference set (PRS) of 143 human-human protein pairs reported to interact and a random reference set (RRS) of 100 presumably non-interacting human-human protein pairs. We observed a clear segregation of NLR values obtained for these two reference sets. When selecting at an NLR threshold of 3.5, more than 70% of PRS interactions scored positive, whereas only 2.5% of protein pairs from the RRS showed NLR values above this threshold. These discriminative results confirm high sensitivity and low background of the HT-GPCA protein-binding assay [4].
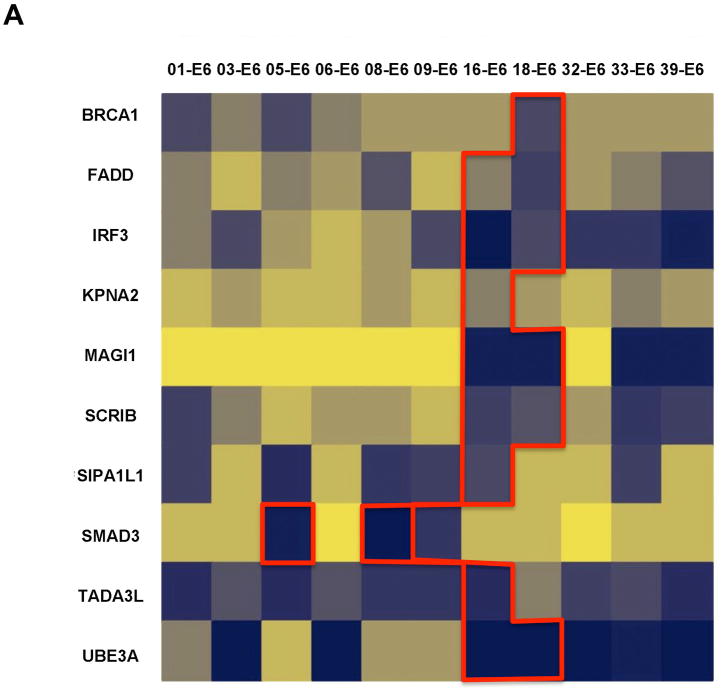
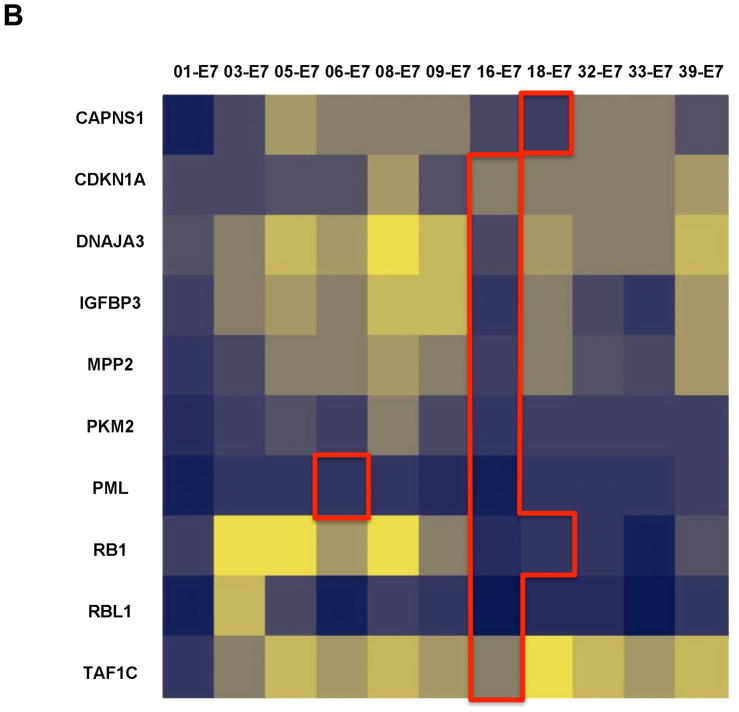
Although we previously established the sensitivity of our HT-GPCA, we next wanted to evaluate its performance with using E6 and E7 oncoproteins. In a pilot experiment, we selected a subset of 20 interactors involved in 28 interactions from the LCI dataset described above (Supplementary Table S5), and tested them with HT-GPCA. Twenty-four displayed a signal above background (NLR > 3.5), representing an 85% recovery rate (Fig. 4A and B). These control sets confirmed the high sensitivity of HT-GPCA and showed that the E6 and E7 oncoproteins behave normally in this assay. These results argue that HT-GPCA is more effective than other assays for the direct detection of binary protein interactions in mammalian cells [33, 34], with the additional advantage of allowing comparisons based on being effective across a wide range of bioluminescence intensity.
Fig. 4.
Heat maps representing interaction profiles obtained with HT-GPCA for E6 and E7 using the Gold-Standard (GS) dataset. Interaction matrix of E6 (A) or E7 (B) from 11 genotypes were tested with HT-GPCA against two reference sets of cellular proteins. Normalized Luminescence Ratio (NLR) as determined by HT-GPCA and ranging from strong to null interactions is displayed on a blue to light yellow scale. Each column displays the interaction profile for a single HPV genotype (top), with cellular targets corresponding to literature-curated interactions (LCI) designated by their HUGO Gene Symbol (left). The current knowledge area corresponding to LCI is delimited by red lines.
7. Inter-genotypic comparison of E6 and E7 interaction profiles
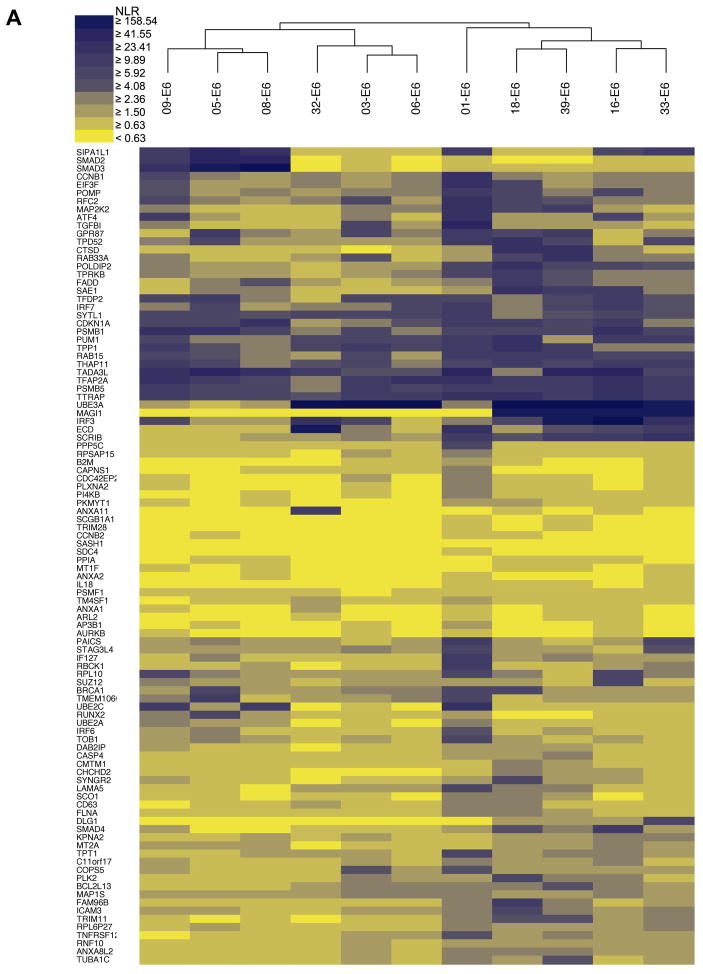
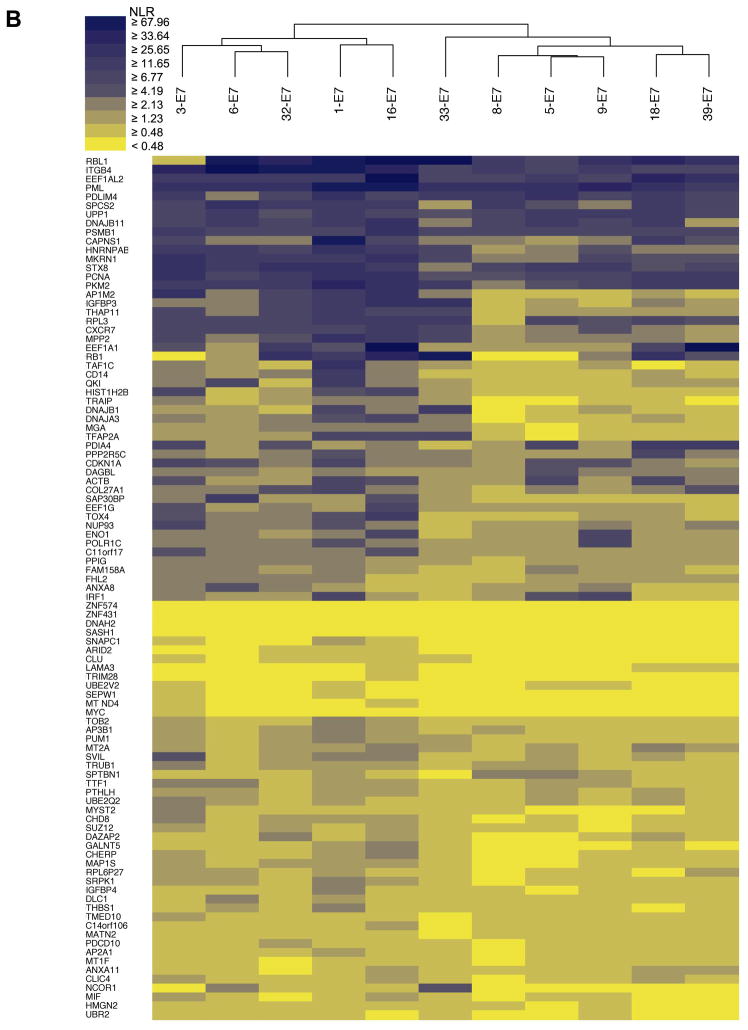
We next scaled up the HT-GPCA screens to determine the interaction profiles of E6 and E7 proteins from 11 HPV genotypes against the sets of cellular interactors identified by HT-Y2H and literature curation. We generated matrices of 1,100 and 1,067 protein pairs between E6 and E7 proteins from eleven HPV genotypes against 100 and 97 cellular targets respectively (Y2H identified and LCI identified) (Fig. 5A, B). We explored whether genotype-specific interaction patterns could be detected. Pairs of interaction profiles were iteratively merged based on similarity criteria, using Agglomerative Hierarchical Clustering (AHC) to generate matrix tree plots that were used to build E6 and E7 interaction dendrograms (Fig. 5A, B).
Fig. 5.
Heat maps representing interaction profiles for E6 and E7 aggregated by hierarchical clustering. Each column figures the interaction profile for a single HPV genotype (top) with cellular targets designated by their HUGO Gene Symbol (left). Means of HT-GPCAs performed in duplicate for both E6 (A) and E7 (B) datasets (Pearson correlation coefficient of 0.9932 and 0.9908 respectively) were used to represent the intensity of the interaction based on a ratio of luminescence versus control (NLR), with the highest intensity shown in blue and the absence of interaction in yellow. E6 and E7 color spectra are slightly different to take in account the dynamics of the NLR intensity distribution. Similarity of interaction profiles between genotypes was analyzed by agglomerative hierarchical clustering.
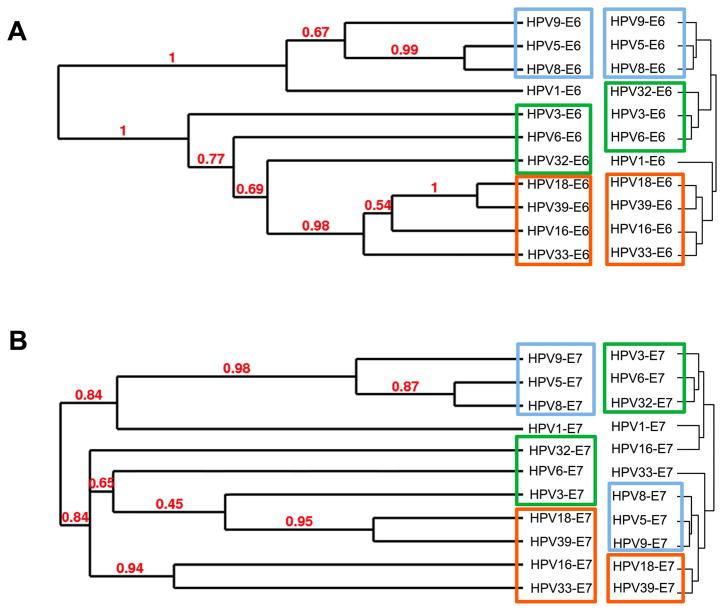
Different computational methods have been proposed for inferring protein interactions from sequence alignments of orthologous proteins, assuming linkage between protein structure and function [9, 35, 36]. We thus speculated that the AHC dendrograms could correlate to E6 and E7 phylogenetic trees. A highly significant congruence was observed between both matrix types for E6, with cophenetic correlation coefficients (ccc) of 0.677 (Fig. 6A). This value strongly differs from the results obtained with a randomized dendrogram set (4.8 standard deviation difference gives P-value < 3×10⁻⁵). Cophenetic correlation was significantly weaker for E7 (ccc = 0.302; 2.2 standard deviation difference give P-value = 0.013; Fig. 6B) suggesting that within E7 sequences several highly divergent regions are critical for interactions with host proteins. To our knowledge this is the first observation of a direct correlation between phylogenetic distance and a PPI network. This observation also provides additional evidence concerning the robustness of our datasets, and pleads a compelling argument in favor of the existence of protein motifs associated with distinctive interactors which could be potential pathogenic markers.
Fig. 6.
E6 (A) and E7 (B) dendrograms based on interaction profiles recapitulate phylogenetic trees. HT-GPCA datasets obtained with E6 and E7 were analysed by hierarchical clustering and results displayed as dendrograms. These interaction-based dendrograms were compared to phylogenetic trees built from E6 and E7 protein sequences using the maximum likelihood method; branch support values are displayed in red. Related phylogroups are framed with similar colors on both the phylogenetic trees and the HT-GPCA-based interaction dendrograms.
8. Identification of tropism and oncogenicity biomarkers
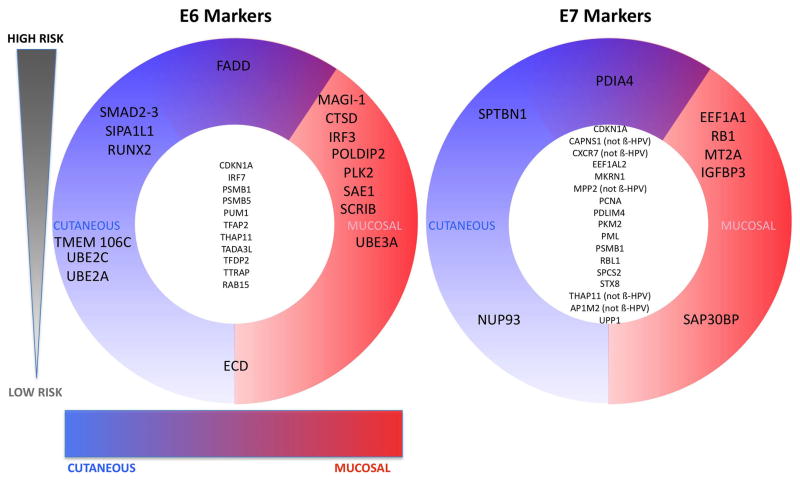
To identify potential tropism and oncogenicity biomarkers we turned to correspondence analysis, a statistical geometric method related to principal component analysis which graphically relates the preferential association between components of a matrix dataset. Correspondence analysis was applied to our E6 and E7 HT-GPCA datasets, with the results displayed as 3-D representations (Supplementary Movies M1 and M2). The segregation patterns so obtained showed associations between specific genotypes and specific groups of cellular interactors (Fig. 7A). For instance, the MAGUK PDZ-containing tumor suppressor MAGI-1 exclusively interacted with E6 proteins from HR-mucosal HPVs, whereas SMAD2/3 cosegregated with HR-cutaneous HPVs. E6 from HR-mucosal HPVs preferentially interacted with the IRF3 transcription factor that is involved in antiviral innate immunity. The Smad and IRF proteins share structural similarities, so the results suggest a functional divergence of E6 proteins from HR-HPVs around a core binding interface. E6 from HR-HPVs were also found to preferentially target host-cell defense through their interaction with FADD, an apoptotic and immunity signalling protein. E6 proteins from HR-mucosal HPVs could also target SUMO modification and the transcriptional machinery via their interaction with Sumo-1 activating enzyme subunit 1 (SAE1). In contrast, E6AP (UBE3A), a protein implicated in E6-dependent degradation of p53, interacts indiscriminately with HR and LR mucosal HPVs but not with cutaneous β-HPVs. Conversely, the interaction with the elongation factor EEF1A1, implicated in cell translation, proliferation and tumorigenesis, and pRb targeting, is specific to E7 from HR-mucosal HPVs. The cyclin-dependent kinase inhibitor 1 (p21; CDKN1A), the proteasome subunit PSMB1 and THAP domain-containing protein 11 (THAP11), a transcriptional repressor, are co-targeted by E6 and E7 from several HPV genotypes. These interactions are shared among several HPV genotypes and are thus potentially essential to the HPV life cycle. A combination of these markers allowed us to classify the 11 HPVs used in this study according to their tropism and pathogenicity (HR-genital, LR-mucosal and HR-cutaneous).
Fig. 7.
Scheme showing segregation of E6 and E7 main cellular targets according to pathogenesis. Synthetic representation scoring the association between a genotype and the intensity of the interaction with a cellular target, sorted by high oncogenic risk (top) to no risk (bottom) and tropism from cutaneous (left) to mucosal (right). The cellular partners shared by all HPV genotypes are central. The names used to designate interactors are those of the HUGO Gene Symbol (HUGO Gene Nomenclature Committee).
9. Concluding remarks
We provided biochemical evidence obtained with HT-Y2H and HT-GPCA to map novel interactions between HPV and cellular proteins. It is conceivable that some of these novel interactions have a functional role in HPV life-cycle, whereas others represent biophysically true but biologically irrelevant interactions, that is, interactions which may occur within HPV-infected cells but do not play any role in the virus life-cycle. Regardless, we show for the first time that a virus-host interaction profile based on biochemical evidences correlates with the classification of HPV strains according to their phylogenetic relationships, tropism or pathogenicity. Our comprehensive comparative interactomics strategy is of wide application. It can be particularly suitable for infectious agents for which many phenotypic variants, pathogenic versus non-pathogenic strains in particular, are available. We anticipate that our comparative interactomics approach will soon be able to place a predictive value of the oncogenic or more generally pathogenic potential for newly discovered viral genotypes.
Supplementary Material
Full list of cellular interactors of E6 identified by Y2H. The corresponding Gene Ensembl ID, protein description and number of Y2H hit observed are indicated for the different genotypes. The different HPV genotypes are grouped according to their tropism, with cutaneous and mucosal HPVs in blue and purple respectively.
These representations result from principal component analyses. The two movies show the projections on three axes of the results from the correspondance studies of the principle pathogenic markers identified for the E6 and E7 proteins.
Full list of cellular interactors of E7 identified by Y2H.. The corresponding Gene Ensembl ID, protein description and number of Y2H hit observed are indicated for the different genotypes. The different HPV genotypes are grouped according to their tropism, with cutaneous and mucosal HPVs in blue and purple respectively.
Filtered list of cellular interactors of E6 identified by Y2H. Their corresponding Gene Ensembl ID, protein description and HGNC symbol are indicated.
Filtered list of cellular interactors of E7 identified by Y2H. Their corresponding Gene Ensembl ID, protein description and HGNC symbol are indicated
List of literature-curated cellular interactors of E6 and E7 included in the gold-standard reference set (GS). Pubmed ID, methodologies and HPV genotypes used for detecting these interactions are indicated.
E6 HT-GPCA dataset. E6 Cellular interactors (HGNC symbol) and HPV genotypes are displayed respectively as row labels and colunm labels of the matrix providing Normalized Luminescence Ratio (NLR) calculated from the mean of NLR displayed in duplicate experiments (see methods).
E7 HT-GPCA dataset. E7 Cellular interactors (HGNC symbol) and HPV genotypes are displayed respectively as row labels and colunm labels of the matrix providing Normalized Luminescence Ratio (NLR) calculated from the mean of NLR displayed in duplicate experiments (see methods).
List of literature-curated cellular interactors of E6 and E7 with Pubmed ID.
Acknowledgments
We thank Richard Paul, Katherine Kean and Michael Cusick for critical reading of the manuscript. This work was supported in part by funding from the Institut Pasteur, and by grants from the Ligue nationale contre le Cancer (grants R05/75–129 and RS07/75–75), the Association pour la Recherche sur le Cancer (grants 3731XA0531F and 4867), and the Agence Nationale de la Recherche (EPI-HPV-3D program) and by Center of Excellence in Genomic Science (CEGS) grant P50-HG004233 from the National Human Genome Research Institute (NHGRI). G.N. was a recipient of the Conseil Général de la Vienne and Pasteur Weizmann foundation. C.R. was a recipient of a MENRTMinistère de l’éducation nationale, de la recherche et de la technologie (MENRT) fellowship.
Footnotes
Publisher's Disclaimer: This is a PDF file of an unedited manuscript that has been accepted for publication. As a service to our customers we are providing this early version of the manuscript. The manuscript will undergo copyediting, typesetting, and review of the resulting proof before it is published in its final citable form. Please note that during the production process errors may be discovered which could affect the content, and all legal disclaimers that apply to the journal pertain.
References
- 1.Uetz P, Rajagopala SV, Dong YA, Haas J. Genome Res. 2004;14:2029–2033. doi: 10.1101/gr.2583304. [DOI] [PubMed] [Google Scholar]
- 2.Venkatesan K, Rual JF, Vazquez A, Stelzl U, Lemmens I, Hirozane-Kishikawa T, Hao T, Zenkner M, Xin X, Goh KI, Yildirim MA, Simonis N, Heinzmann K, Gebreab F, Sahalie JM, Cevik S, Simon C, de Smet AS, Dann E, Smolyar A, Vinayagam A, Yu H, Szeto D, Borick H, Dricot A, Klitgord N, Murray RR, Lin C, Lalowski M, Timm J, Rau K, Boone C, Braun P, Cusick ME, Roth FP, Hill DE, Tavernier J, Wanker EE, Barabasi AL, Vidal M. Nat Methods. 2009;6:83–90. doi: 10.1038/nmeth.1280. [DOI] [PMC free article] [PubMed] [Google Scholar]
- 3.Vidalain PO, Tangy F. Microbes Infect. 2010;12:1134–1143. doi: 10.1016/j.micinf.2010.09.001. [DOI] [PubMed] [Google Scholar]
- 4.Cassonnet P, Rolloy C, Neveu G, Vidalain PO, Chantier T, Pellet J, Jones L, Muller M, Demeret C, Gaud G, Vuillier F, Lotteau V, Tangy F, Favre M, Jacob Y. Nat Methods. 2011;8:990–992. doi: 10.1038/nmeth.1773. [DOI] [PubMed] [Google Scholar]
- 5.Navratil V, de Chassey B, Meyniel L, Delmotte S, Gautier C, Andre P, Lotteau V, Rabourdin-Combe C. Nucleic Acids Res. 2009;37:D661–668. doi: 10.1093/nar/gkn794. [DOI] [PMC free article] [PubMed] [Google Scholar]
- 6.Chatr-aryamontri A, Ceol A, Peluso D, Nardozza A, Panni S, Sacco F, Tinti M, Smolyar A, Castagnoli L, Vidal M, Cusick ME, Cesareni G. Nucleic Acids Res. 2009;37:D669–673. doi: 10.1093/nar/gkn739. [DOI] [PMC free article] [PubMed] [Google Scholar]
- 7.Driscoll T, Dyer MD, Murali TM, Sobral BW. Nucleic Acids Res. 2009;37:D647–650. doi: 10.1093/nar/gkn799. [DOI] [PMC free article] [PubMed] [Google Scholar]
- 8.Kiemer L, Cesareni G. Trends Biotechnol. 2007;25:448–454. doi: 10.1016/j.tibtech.2007.08.002. [DOI] [PubMed] [Google Scholar]
- 9.Yu H, Luscombe NM, Lu HX, Zhu X, Xia Y, Han JD, Bertin N, Chung S, Vidal M, Gerstein M. Genome Res. 2004;14:1107–1118. doi: 10.1101/gr.1774904. [DOI] [PMC free article] [PubMed] [Google Scholar]
- 10.Bernard HU, Burk RD, Chen Z, van Doorslaer K, Hausen H, de Villiers EM. Virology. 2010;401:70–79. doi: 10.1016/j.virol.2010.02.002. [DOI] [PMC free article] [PubMed] [Google Scholar]
- 11.Liu X, Clements A, Zhao K, Marmorstein R. J Biol Chem. 2006;281:578–586. doi: 10.1074/jbc.M508455200. [DOI] [PubMed] [Google Scholar]
- 12.Nomine Y, Masson M, Charbonnier S, Zanier K, Ristriani T, Deryckere F, Sibler AP, Desplancq D, Atkinson RA, Weiss E, Orfanoudakis G, Kieffer B, Trave G. Mol Cell. 2006;21:665–678. doi: 10.1016/j.molcel.2006.01.024. [DOI] [PubMed] [Google Scholar]
- 13.Ohlenschlager O, Seiboth T, Zengerling H, Briese L, Marchanka A, Ramachandran R, Baum M, Korbas M, Meyer-Klaucke W, Durst M, Gorlach M. Oncogene. 2006;25:5953–5959. doi: 10.1038/sj.onc.1209584. [DOI] [PubMed] [Google Scholar]
- 14.Huibregtse JM, Scheffner M, Howley PM. Mol Cell Biol. 1993;13:4918–4927. doi: 10.1128/mcb.13.8.4918. [DOI] [PMC free article] [PubMed] [Google Scholar]
- 15.Huibregtse JM, Scheffner M, Howley PM. Mol Cell Biol. 1993;13:775–784. doi: 10.1128/mcb.13.2.775. [DOI] [PMC free article] [PubMed] [Google Scholar]
- 16.Scheffner M, Huibregtse JM, Vierstra RD, Howley PM. Cell. 1993;75:495–505. doi: 10.1016/0092-8674(93)90384-3. [DOI] [PubMed] [Google Scholar]
- 17.Munger K, Werness BA, Dyson N, Phelps WC, Harlow E, Howley PM. EMBO J. 1989;8:4099–4105. doi: 10.1002/j.1460-2075.1989.tb08594.x. [DOI] [PMC free article] [PubMed] [Google Scholar]
- 18.Ganguly N, Parihar SP. J Biosci. 2009;34:113–123. doi: 10.1007/s12038-009-0013-7. [DOI] [PubMed] [Google Scholar]
- 19.Howie HL, Katzenellenbogen RA, Galloway DA. Virology. 2009;384:324–334. doi: 10.1016/j.virol.2008.11.017. [DOI] [PMC free article] [PubMed] [Google Scholar]
- 20.Mantovani F, Banks L. Oncogene. 2001;20:7874–7887. doi: 10.1038/sj.onc.1204869. [DOI] [PubMed] [Google Scholar]
- 21.McLaughlin-Drubin ME, Munger K. Virology. 2009;384:335–344. doi: 10.1016/j.virol.2008.10.006. [DOI] [PMC free article] [PubMed] [Google Scholar]
- 22.Munger K, Basile JR, Duensing S, Eichten A, Gonzalez SL, Grace M, Zacny VL. Oncogene. 2001;20:7888–7898. doi: 10.1038/sj.onc.1204860. [DOI] [PubMed] [Google Scholar]
- 23.Bedard KM, Underbrink MP, Howie HL, Galloway DA. J Virol. 2008;82:3894–3902. doi: 10.1128/JVI.01818-07. [DOI] [PMC free article] [PubMed] [Google Scholar]
- 24.Chen JJ, Hong Y, Rustamzadeh E, Baleja JD, Androphy EJ. J Biol Chem. 1998;273:13537–13544. doi: 10.1074/jbc.273.22.13537. [DOI] [PubMed] [Google Scholar]
- 25.Pellet J, Tafforeau L, Lucas-Hourani M, Navratil V, Meyniel L, Achaz G, Guironnet-Paquet A, Aublin-Gex A, Caignard G, Cassonnet P, Chaboud A, Chantier T, Deloire A, Demeret C, Le Breton M, Neveu G, Jacotot L, Vaglio P, Delmotte S, Gautier C, Combet C, Deleage G, Favre M, Tangy F, Jacob Y, Andre P, Lotteau V, Rabourdin-Combe C, Vidalain PO. Nucleic Acids Res. 2010;38:D371–378. doi: 10.1093/nar/gkp1000. [DOI] [PMC free article] [PubMed] [Google Scholar]
- 26.Remy I, Michnick SW. Nat Methods. 2006;3:977–979. doi: 10.1038/nmeth979. [DOI] [PubMed] [Google Scholar]
- 27.Huang da W, Sherman BT, Tan Q, Kir J, Liu D, Bryant D, Guo Y, Stephens R, Baseler MW, Lane HC, Lempicki RA. Nucleic Acids Res. 2007;35:W169–175. doi: 10.1093/nar/gkm415. [DOI] [PMC free article] [PubMed] [Google Scholar]
- 28.R.D.C. Team. RFfS Computing (Ed) Vienna, Austria: 2008. [Google Scholar]
- 29.Felsenstein J. Cladistics. 1989;5:164–166. [Google Scholar]
- 30.Dray S, Dufour AB. Journal of Statistical Software. 2007;22:1–20. [Google Scholar]
- 31.Ito T, Chiba T, Ozawa R, Yoshida M, Hattori M, Sakaki Y. Proc Natl Acad Sci U S A. 2001;98:4569–4574. doi: 10.1073/pnas.061034498. [DOI] [PMC free article] [PubMed] [Google Scholar]
- 32.Rual JF, Venkatesan K, Hao T, Hirozane-Kishikawa T, Dricot A, Li N, Berriz GF, Gibbons FD, Dreze M, Ayivi-Guedehoussou N, Klitgord N, Simon C, Boxem M, Milstein S, Rosenberg J, Goldberg DS, Zhang LV, Wong SL, Franklin G, Li S, Albala JS, Lim J, Fraughton C, Llamosas E, Cevik S, Bex C, Lamesch P, Sikorski RS, Vandenhaute J, Zoghbi HY, Smolyar A, Bosak S, Sequerra R, Doucette-Stamm L, Cusick ME, Hill DE, Roth FP, Vidal M. Nature. 2005;437:1173–1178. doi: 10.1038/nature04209. [DOI] [PubMed] [Google Scholar]
- 33.Braun P, Tasan M, Dreze M, Barrios-Rodiles M, Lemmens I, Yu H, Sahalie JM, Murray RR, Roncari L, de Smet AS, Venkatesan K, Rual JF, Vandenhaute J, Cusick ME, Pawson T, Hill DE, Tavernier J, Wrana JL, Roth FP, Vidal M. Nat Methods. 2009;6:91–97. doi: 10.1038/nmeth.1281. [DOI] [PMC free article] [PubMed] [Google Scholar]
- 34.Barrios-Rodiles M, Brown KR, Ozdamar B, Bose R, Liu Z, Donovan RS, Shinjo F, Liu Y, Dembowy J, Taylor IW, Luga V, Przulj N, Robinson M, Suzuki H, Hayashizaki Y, Jurisica I, Wrana JL. Science. 2005;307:1621–1625. doi: 10.1126/science.1105776. [DOI] [PubMed] [Google Scholar]
- 35.Kemmer D, Huang Y, Shah SP, Lim J, Brumm J, Yuen MM, Ling J, Xu T, Wasserman WW, Ouellette BF. Genome Biol. 2005;6:R106. doi: 10.1186/gb-2005-6-12-r106. [DOI] [PMC free article] [PubMed] [Google Scholar]
- 36.Kittichotirat W, Guerquin M, Bumgarner RE, Samudrala R. Nucleic Acids Res. 2009;37:W519–525. doi: 10.1093/nar/gkp306. [DOI] [PMC free article] [PubMed] [Google Scholar]
Associated Data
This section collects any data citations, data availability statements, or supplementary materials included in this article.
Supplementary Materials
Full list of cellular interactors of E6 identified by Y2H. The corresponding Gene Ensembl ID, protein description and number of Y2H hit observed are indicated for the different genotypes. The different HPV genotypes are grouped according to their tropism, with cutaneous and mucosal HPVs in blue and purple respectively.
These representations result from principal component analyses. The two movies show the projections on three axes of the results from the correspondance studies of the principle pathogenic markers identified for the E6 and E7 proteins.
Full list of cellular interactors of E7 identified by Y2H.. The corresponding Gene Ensembl ID, protein description and number of Y2H hit observed are indicated for the different genotypes. The different HPV genotypes are grouped according to their tropism, with cutaneous and mucosal HPVs in blue and purple respectively.
Filtered list of cellular interactors of E6 identified by Y2H. Their corresponding Gene Ensembl ID, protein description and HGNC symbol are indicated.
Filtered list of cellular interactors of E7 identified by Y2H. Their corresponding Gene Ensembl ID, protein description and HGNC symbol are indicated
List of literature-curated cellular interactors of E6 and E7 included in the gold-standard reference set (GS). Pubmed ID, methodologies and HPV genotypes used for detecting these interactions are indicated.
E6 HT-GPCA dataset. E6 Cellular interactors (HGNC symbol) and HPV genotypes are displayed respectively as row labels and colunm labels of the matrix providing Normalized Luminescence Ratio (NLR) calculated from the mean of NLR displayed in duplicate experiments (see methods).
E7 HT-GPCA dataset. E7 Cellular interactors (HGNC symbol) and HPV genotypes are displayed respectively as row labels and colunm labels of the matrix providing Normalized Luminescence Ratio (NLR) calculated from the mean of NLR displayed in duplicate experiments (see methods).
List of literature-curated cellular interactors of E6 and E7 with Pubmed ID.


