

Abstract
Public data repositories have enabled researchers to compare results across multiple genomic studies in order to replicate findings. A common approach is to first rank genes according to an hypothesis of interest within each study. Then, lists of the top-ranked genes within each study are compared across studies. Genes recaptured as highly ranked (usually above some threshold) in multiple studies are considered to be significant. However, this comparison strategy often remains informal, in that Type I error and false discovery rate are usually uncontrolled. In this paper, we formalize an inferential strategy for this kind of list-intersection discovery test. We show how to compute a p-value associated with a `recaptured' set of genes, using a closed-form Poisson approximation to the distribution of the size of the recaptured set. The distribution of the test statistic depends on the rank threshold and the number of studies within which a gene must be recaptured. We use a Poisson approximation to investigate operating characteristics of the test. We give practical guidance on how to design a bioinformatic list-intersection study with prespecified control of Type I error (at the set level) and false discovery rate (at the gene level). We show how choice of test parameters will affect the expected proportion of significant genes identified. We present a strategy for identifying optimal choice of parameters, depending on the particular alternative hypothesis which might hold. We illustrate our methods using prostate cancer gene-expression datasets from the curated Oncomine database.
Keywords: Concordance, Validation, Gene-ranking, Meta-analysis, Rank based methods, Gene expression analysis, Microarray, sequencing, Cancer
1 Intorduction
Given several independent genomic data sets which address a similar question, it is common to compare the lists of the top-ranked genes from each study. Genes selected as highly ranked in multiple studies may be considered validated or replicated. Curated databases of gene lists are available which include tools for comparing lists and intersecting lists of top-ranked genes across multiple similar studies [Glez-Pena, 2009, Culhane, 2010]. The `correspondence at the top' concordance statistic is an example of this approach [Irizarry, 2005]. Perhaps the most well known example is the study by Tomlins et al of gene expression in solid tumors, [Tomlins, 2005] which compared the top 10 genes from each of a large number of cancer studies in a publicly available microarray data repository. Within each study, the genes were ranked according to a statistic scoring potential `fusion gene' properties, as such fusion genes are known to be important drivers of malignancy in several hematologic cancers. Tomlins et al targeted a candidate gene list of 300 known cancer genes; any candidate gene which ranked among the top 10 in two or more of the studies was considered to be a potential hit. Two significant genes were found, one which ranked among the top 10 in two different studies and another in five studies. For these two genes, a fusion product was subsequently experimentally confirmed in prostate cancer and these remain the only common fusion transcripts discovered in an epithelial tumor.
In this paper, we show how to conduct such an intersection-of-lists approach to assessing significance while controlling Type I error (at the set level) and false discovery rate (at the gene level). Given N independent studies, there are two parameters which define a `hit': the rank threshold, r, above which a gene must lie in each study (r = 10 in the Tomlins example) and the number of lists, n, among which a gene must be ranked (n = 2 in the Tomlins example) in order to be declared significant. Our first goal is to define an exact p-value which is easy to compute, when assessing the intersection of n lists of top-ranked genes, at rank r or above. This entails defining an appropriate test statistic and corresponding hypothesis test, which we call a List-Intersection discovery test, as this is an `unsupervised' or discovery approach. We apply these ideas to the related `supervised' case of an a priori candidate gene list which is compared against N other independent studies, as in [Tomlins, 2005]. Here the aim is to validate the genes appearing in the researcher's a priori list with a formal test of hypothesis. Following [Irizarry, 2005] we call this a List-Intersection concordance test. We then develop practical guidelines for choices of r and n which maximize the expected sensitivity, that is, the expected proportion of significant genes that are discovered, at a given false discovery rate, and give example applications of both the discovery and concordance test to data used in the Tomlins study.
To state the discovery problem more precisely, consider data from N independent (gene-expression) studies. Within each study, suppose T genes are ranked according to a statistic, and consider the list of the r top-ranked genes in each study. The set of genes which lie in the intersection of n or more of these lists, Sn(r), are those genes `recaptured' as significant at least n times across N independent studies. However, the degree of confidence in this validation remains to be assessed. For example, considering N = 6 independent studies each with 10, 000 possible genes, it may be very likely that by chance alone at least 50 genes would be recaptured among the top r = 200 genes in n = 2 or more studies (as we shall demonstrate, probability 0.84), somewhat likely that 5 or more genes would be so recaptured across n = 3 studies (probability 0.02), and very unlikely that any one gene would be recaptured in n = 5 out of 6 studies just by chance (probability 0.0002). In this paper, we show how to compute these probabilities (these examples are computed in Section 2.2), how to assess the statistical significance of the recaptured set for given r and n, and how to estimate the false discovery rate within the recaptured set. The test statistic we use is |Sn(r)|, the size of the intersection set; in the above three examples |Sn(r)| ≥ 50, 5 and 1 respectively.
The paper is organized as follows: In Section 2 we derive the distribution of the List-Intersection test statistic under the null hypothesis and show how to compute a p-value for a gene-set and how to estimate the within-set false discovery rate (FDR). In Section 3 we derive the distribution of the List-Intersection concordance test statistic. In Section 3.2 we apply the test to data in Tomlins et al [Tomlins, 2005]. In Section 4, we discuss how to control the Type I error of the discovered set, and how to control the false discovery rate of the genes within the discovered set. We give a strategy for finding good choices of r and n.(Section 4.2). Finally, in Section 5 we give an example of how to mine a data repository for a “statistically significant” discovered gene set while controlling the Type I error at the set level and the within-set FDR. Section 6 gives conclusions and future directions; simulation studies, code, and additional proofs are in an appendix.
2 The List-Intersection discovery test
The List-Intersection test compares the top-ranked gene lists from multiple studies in order to discover a common significant set of genes. Suppose we consider N studies, each of which investigate T genes, and that the genes within a study are ranked according to a pre-specified scoring procedure which might be fold change, a between group t-test, or might differ from study to study. Consider the list of `top r' genes within each study, and consider the set of genes, Sn(r), which lie in n or more of these top-ranked lists. (We will often omit the dependence on r for convenience.) In this section we find the expected count EH0|Sn| under the null hypothesis of random ranking of the genes. We show that |Sn| has an approximately Poisson distribution under the assumptions that T >> r and E|Sn| << r, where both T and r are large, and use this to compute a p-value.
2.1 Null distribution of |Sn(r)|, estimated FDR, and p-values
Let the Bernoulli trial Bg = 1 if the gth gene ranks among the top r genes in n or more studies, with Bg = 0 otherwise. Then . Let denote the associated probability under the null hypothesis, . (Note that we have suppressed the dependence of on r for convenience.) While the Bernoulli trials Bg are not independent (given that one gene lies among the top r genes, the next gene is less likely to do so), they are identically distributed, and so it is immediate that
| (2.1) |
To evaluate under the null hypothesis of random ranking among T genes in each study, index the studies from i = 1 to N and consider an arbitrary gene g. Let Ai be the Bernoulli trial that counts a success if g ranks among the top r genes in study i, with P(Ai = 1) = pi. Under the null hypothesis, pi = r/T ≡ p0, and the Ai are independent. Let X count the number of sucessess for gene g. Then X ~ Bin(N, p0), and the probability that gene g is listed among the top r genes in n or more studies is given by
| (2.2) |
an easily computed binomial probability. Using, (2.2) one may then estimate the within-set FDR by comparing the expected number of discoveries under the null hypothesis to the total number of discoveries made:
| (2.3) |
To find the distribution of |Sn| under the null hypothesis of independent random ranking of the genes, note that for large T with T >> r, selection of the r top-ranked genes within a study has nearly the same distribution as random sampling with replacement. If in addition E|Sn| << r, then Bg and Bh are approximately independent for any pair of genes g and h. In this case |Sn| will have an approximate Binomial distribution with parameters T and . If in addition T is large and small, it follows that the distribution of |Sn| is approximately Poisson with mean .
2.2 Example computations using the List-Intersection statistic
Here we show how to use (2.1) and (2.2) to compute the expected number of genes recaptured just by chance, as well as the p-value of the size of the recaptured set and estimated FDR for genes within the set, as a function of the total number of studies considered, N, the depth of the top-ranked list, r, and the number of lists intersected, n. Throughout we let T = 10, 000. We also investigate the quality of the Binomial and Poisson approximations for these examples, and discuss what happens if genes are correlated.
2.2.1 Example computations
-
(i)
As in the introduction, consider that we have ranked T = 10, 000 genes, and that the top r = 200 genes are the top-ranked set. Then, under random ranking, p0 = r/T = 0.02. Given N= 6 studies to compare, the probability of seeing a given gene in the top 200 from n = 2 or more studies is , from (2.2), under the null hypothesis of random ranking. It follows from (2.1) that the number of genes captured in the intersection of 2 or more studies is then approximately Poisson with mean .
For the purposes of computing p-values using the Poisson approximation, the key assumptions of T ≫ r, and small are met; however, E|S2|/r ≈ 0.30, so that E|S2| is not particularly small compared to r. Simulation (see section 7.1 for details) shows that the Poisson approximation is still acceptable: the simulated 95th percentile of the null distribution is 68, while the Poisson approximation gives 70, a relative error of 2.9%. At 1% significance level, the relative error is approximately 2.7% (simulated value 73; Posisson approximation 75). Further, revisiting the example from the introduction, the simulated probablility that |S2(200)| = 50, i.e., that 50 genes are recaptured in the top 200 in 2 or more of 6 studies, is 0.86 compared to the corresponding Poisson variate p-value of 0.84, yielding a relative error of 2.3%.
-
(ii)
Now supposing only N = 4 rather than 6 total studies are considered, and leaving other parameters unchanged, then the expected number of genes captured by chance falls by half, to a mean of 23 genes. Again the relative error of the 95th and 99th percentiles comparing the simulated null distribution of Sn(r) to the Poisson approximation is 3% (the simulated 95th percentile of the null distribution is 31, while the Poisson approximation gives 32; the simulated 99th percentile of the null distribution is 34, while the Poisson approximation gives 35.)
-
(iii)
When N = 6 but the depth of the list is halved so that only the top r = 100 genes are considered, the mean number of genes captured by chance falls by 3/4, from 57 to 15. The relative approximation error is 0% for the 95th percentile, and 4% for the 99th percentile. .
-
(iv)
If N = 6 and the top r = 200 genes are considered, but we require the genes to be recaptured in three or more studies (so that n = 3 rather than 2), the mean number of genes captured under the null is 1.53. Continuing this example from the introduction, in this case, the probability under the null hypothesis of random ranking that we would see 5 or more genes in the intersection list is the probability that a Poisson variate with mean 1.53 takes the value 5 or greater, which is 0.02. Thus we would have seen a statistically significant event with a p-value of 0.02. The estimated within-set FDR would be 1.53 /5, or 31%. Note that the p-value for this scenario based on the simulated null distribution of Sn(r) (n = 3, r = 200) is 0.018, demonstrating again the adequacy of the Poisson approximation.
These examples show how to use the Poisson approximation to the distribution of Sn(r) to calculate p-values and FDRs. Over the range of parameters considered here, the Poisson approximation appears to be very good. Additional numerical computations assessing the adequacy of this approximation are investigated in Sections 5 and 7.1
2.2.2 How does correlation between genes affect the null distribution?
Because genes may be either positively or negatively correlated with each other, our idealized null distribution of independent random ranking of genes within each study doubtless does not hold. Importantly, our strategy for study design (i.e. for choice of r and n, given in Section 4) depends on computing the mean value of the test statistic, and this is not changed under arbitrary dependence. To see this, note that if genes g and h are correlated, (2.1) and (2.2) still hold.
When computing p-values, the distribution of the test statistic |S − n| is needed, and this is affected by correlation between genes. For example, positive correlation in gene expression levels will induce (smaller) positive correlation between pairs Bg and Bh, and then the variance of the sum Sn will be increased by a covariance term. Under negative correlation between genes, the variance of Sn will be decreased, and the magnitude of these perturbations depends on both number of correlated genes and the strength of the correlations. If there is strong correlation between genes observed in the data, then we recommend that a column-wise permutation test should be considered as an alternative means of computing a p-value.
To gain some insight into the distribution of Sn under correlation, note that negative correlation between pairs Bg and Bh is induced when E|Sn is too large compared to r, and the effect of this correlation is shown in example xx in section x. Notice that, as expected, the true distribution is more concentrated than the Binomial or Poisson approximations, rendering the approximate p-values too large and making the test conservative. However the shape of the distribution is still clearly approximately normal, as is shown in figure xx. With an equal mixture of both positive and negatively correlated genes, the true variance of the null distribution would be about the same as the variance computed under the independence assumption, and thus we speculate that there are many cases in which the Binomial and thus the Poisson approximation will be reasonalby accurate to compute p-values, and especially to use in study design. Further investigation of these issues is the subject of future work.
3 The List-Intersection Concordance test
The concordance test evaluates whether an a priori candidate list of m genes, say from the researcher's new study, is significantly reproduced among the top r genes in N independent ranked lists of genes, say from other experiments or from the literature. Suppose each study investigates T genes and consider the set of genes, , from the a priori candidate list which also lie in n or more of these top-ranked lists. As before, we show that has an approximately Poisson distribution under the null hypothesis of independent random ranking of the genes, however with a different mean, under the assumptions that T >> r and and both T and r are large.
3.1 Null distribution of
Again, index the studies from i = 1 to N. Consider an arbitrary gene g drawn from the a priori list of m genes of interest, and as before, for study i let Ai be the event that gene g is listed among the top r genes. Under the null hypothesis of random ranking among T genes in each study, pi = r/T ≡ p0, as before. As in Section 2.1, equation (2.2) gives , the probability under the null hypothesis that n or more of the events A1, …, AN occur simultaneously. Now consider the m genes on the a priori list, and let Bg = 1 if the gth gene ranks among the top r genes in n or more studies, with Bg = 0 otherwise. Under the null hypothesis , and as Bg, it is immediate that
| (3.4) |
under the null. Further, for large T with T >> r, selection of the r top-ranked genes within a study has nearly the same distribution as random sampling with replacement. If in addition , then Bg and Bh are approximately independent for any pair of genes g and h. In this case will have an approximate Binomial distribution with parameters m and , which in turn is approximately Poisson with mean for m large and small.
3.2 Example test using data from Tomlins et al
We apply these computations to the data from Tomlins [Tomlins, 2005]. They considered the Cancer Gene Census [Futreal, 2004] published list of 300 genes known to be involved in cancer, and compared this candidate gene list across 132 studies from the Oncomine [Rhodes, 2007] repository of microarray data. Within each study, they ranked all genes according to a score characteristic of a fusion gene. They then looked for the occurrence of any candidate cancer genes among the 10 top-ranked genes in each study, and for each cancer gene, reported how many times it was `captured' in a top-10 list. To define parameters, each microarray platform interrogated about 10,000 expressed genes. Thus we have T = 10, 000 genes across N = 132 studies, with the top r = 10 genes considered from each study. The length of the a priori list is m = 300.
We applied (2.2) and (3.4) to find the expected number of cancer genes which appear in the intersection of n multiple lists under the null hypothesis of random ranking, for n ranging from 2 (the case considered by Tomlins et al) to 5. These results are given in Table 1, in the row labeled E|Cn|. We give the set of actual genes found by Tomlins et al in the intersection of n or more lists (the observed set Cn), taken from their supplementary table S1. We also record the count of cancer genes recaptured n or more times (the observed count |Cn|). We then compute the p-value for each value of n, computed as the probability that a Poisson variate with the given mean would lie above the observed value of |Cn|, and the estimated FDR within each recaptured set. Notably, the observed set of cancer genes which is in the intersection of 2 or more lists, the set considered by Tomlins et al, has a p-value of 0.25, indicating it is plausible that this many genes would reappear just by chance. Four genes were 'discovered' in this recaptured set, while the expected number recaptured under the null is 2.5 for an estimated FDR of 2.5/4 or 63%. However, the p-values attached to the single gene ERG, which reappears in 5 studies, is highly significant. Both ERG and the related ETV1 were subsequently validated as fusion genes.
Table 1.
Example: expected and observed number of recaptured candidate genes, p-values and estimated FDR within the recaptured set.
| n = 2 | n = 3 | n = 4 | n = 5 | |
|---|---|---|---|---|
| E|Cn| under null | 2.5 | 0.11 | < 0.01 | < 0.01 |
| Observed Cn | {ERBB2, ERG, ETV1, IRTA1} | ERG | ERG | ERG |
| Observed |Cn| | 4 | 1 | 1 | 1 |
| p-value | 0.25 | 0.006 | 7x10⁻⁶ | 5x10⁻⁹ |
| Estimated FDR | 0.63 | 0.11 | < 0.01 | < 0.01 |
Data from Tomlins (2005); T = 10, 000 genes across N = 132 studies, with the top r = 10 genes considered from each study. The length of the a priori candidate gene list is m = 300. The recapture rate n varies from 2 to 5; n = 2 was the choice used in Tomlins (2005)
This example illustrates how to compute the p-value for the size of an observed set of concordant genes. However, notice that multiple p-values are presented in Table 1, corresponding to multiple choices of r and n. Unless we specify r and n in advance, we are open to charges of data snooping, that is, of tailoring the choice of r and n to the results they yield in a given data set, rendering the nominal p-values invalid. Thus, this example also highlights the need for a strategy for choosing r and n, and importantly, the need to specify the choice of r and n before the analysis is carried out. We discuss these issues in the remainder of the paper.
4 Control of Type I error and within-set FDR
For a given pre-specified choice of r and n, the List Intersection test will declare a gene set to be significant only if |Sn(r)| has a p-value below the stated significance level α. This procedure will strictly control the Type I error rate; that is, under the null model, the probability will be at least 1 − α that no gene set will be declared to be significant. Given a statistically significant gene set, it remains to investigate the FDR within set, and the expected proportion of true positive genes that are captured (the expected sensitivity).
Importantly, as noted above, control of Type I error requires both n and r to be specified in advance. For example, there may be several sets Sn(r) with p-values falling below any given significance level, and post hoc selection of one or more of these sets without correction for multiple testing would of course leave both the Type I error and the set-level FDR uncontrolled. In addition, failure to pre-specify r and n is likely to lead to data snooping, in which the chosen r and n are consciously or unconsciously tailored to yield the most “interesting” set of selected genes. Thus it remains to consider how to make good a priori choices of r and n. In this section, we give an example which illustrates how good choices of r and n may depend on which particular alternative hypothesis holds, and then propose a general design strategy. We leave as future work discussion of the more computationally and mathematically involved data-driven strategies to control the FDR.
4.1 Example choices of r and n: false discovery rate and true-positive capture rate
Different choices of the threshold r and the recapture rate n will trade-off between an increased false discovery rate within the set Sn(r) and increased power to capture any truly significant genes. For example, for fixed n, as r increases and more genes are included in the set of `top-r' genes, any truly significant genes (“true positives”) will be more likely to be selected within each study and thus more likely to land in the intersection set Sn(r). However, at the same time more null genes will be captured, thereby potentially increasing the FDR within Sn(r), and possibly reducing power to call Sn(r) a statistically significant set. Good choices for r and n will evidently depend on how many truly significant genes exist, as well as the effect size for each, as the latter determines the probability that a given significant gene rises to the top of the list.
To illustrate these trade-offs, in Table 2 we compute the expected number of true discoveries and false discoveries for several choices of r and n, under two simple alternative hypothesis scenarios. We considered N = 4 independent studies, each investigating T = 10, 000 genes. We assume that the statistic used to rank the genes has a standard normal null distribution, such as a two sample t-statistic. We assume a total of tp genes are true positives, and for each such gene, the statistic is assumed to be normally distributed with mean μ and standard deviation 1. We constructed two scenarios: Alternative I had 25 true positive genes, each upregulated by 3 standard deviations as compared to the null genes, with the remaining T − tp constituting the null genes. In Alternative II, we considered tp = 2 true positive genes, each with expression levels upregulated by 4 standard deviations as compared to the null genes. Thus Alternative I has multiple significant genes, each with moderate effect-sizes, and Alternative II has a few true hits with large effect-sizes. Under each of these “toy” alternative hypotheses, we computed the expected number of null and significant genes recaptured by the list intersection statistic. The mathematical arguments for these expectations follows as in Section 2.1 and is given in the Appendix (Section 7.2). For our two chosen scenarios, and for given r and n, Table 2 displays the FDR within the intersection gene set as well as the expected sensitivity (the expected proportion of true-positive genes that are captured). We considered recapture rates n from 2 to 4, and within-study thresholds r from 500 to 10.
Table 2.
Expected sensitivity (ESns) and FDR under different alternative hypotheses and choices of r (within-study significance threshold), and n (recapture rate).
| Alternative Hypothesis I: # of true positive genes = 25 each with 3σ upregulation as compared to null genes | ||||||
|---|---|---|---|---|---|---|
|
| ||||||
| Recapture-rate (n) | r = 500 | r = 100 | r = 50 | r = 25 | r = 10 | |
|
| ||||||
| 2 | EFP | 128.43 | 3.99 | 0.71 | 0.10 | 0.003 |
| ETP | 24.93 | 23.36 | 21.02 | 16.91 | 9.05 | |
| ESns | 0.99 | 0.93 | 0.84 | 0.68 | 0.36 | |
| FDR | 0.84 | 0.15 | 0.03 | 0.006 | < 0.001 | |
| 3 | EFP | 4.21 | 0.02 | 0.002 | < 0.001 | < 0.001 |
| ETP | 23.90 | 17.42 | 12.65 | 7.54 | 2.24 | |
| ESns | 0.96 | 0.70 | 0.51 | 0.30 | 0.09 | |
| FDR | 0.15 | 0.001 | < 0.001 | < 0.001 | < 0.001 | |
| 4 | EFP | 0.05 | < 0.001 | < 0.001 | < 0.001 | < 0.001 |
| ETP | 17.06 | 6.94 | 3.64 | 1.47 | 0.22 | |
| ESns | 0.68 | 0.28 | 0.15 | 0.059 | 0.009 | |
| FDR | 0.003 | < 0.001 | < 0.001 | < 0.001 | < 0.001 | |
| Alternative Hypothesis II: # of true positive genes = 2 each with 4-σ upregulation as compared to null genes | ||||||
|---|---|---|---|---|---|---|
|
| ||||||
| Recapture-rate (n) | r = 500 | r = 100 | r = 50 | r = 25 | r = 10 | |
|
| ||||||
| 2 | EFP | 139.14 | 5.70 | 1.38 | 0.32 | 0.04 |
| ETP | 2.00 | 2.00 | 2.00 | 1.99 | 1.95 | |
| ESns | 1.00 | 1.00 | 1.00 | 1.00 | 0.98 | |
| FDR | 0.99 | 0.74 | 0.41 | 0.14 | 0.02 | |
| 3 | EFP | 4.76 | 0.04 | 0.005 | < 0.001 | < 0.001 |
| ETP | 2.00 | 1.97 | 1.93 | 1.85 | 1.65 | |
| ESns | 1.00 | 0.99 | 0.97 | 0.93 | 0.83 | |
| FDR | 0.70 | 0.02 | 0.002 | < 0.001 | < 0.001 | |
| 4 | EFP | 0.06 | < 0.001 | < 0.001 | < 0.001 | < 0.001 |
| ETP | 1.93 | 1.64 | 1.44 | 1.19 | 0.84 | |
| ESns | 0.97 | 0.82 | 0.72 | 0.60 | 0.42 | |
| FDR | 0.03 | < 0.001 | < 0.001 | < 0.001 | < 0.001 | |
Note: N = 4 independent studies; T = 10, 000 genes measured in each study; EFP = expected # of false positives; ETP = expected # of true positives; ESns= ETP/# true positives; FDR = EFP/(EFP+ETP).
For Alternative Hypothesis I, (25 true-positive genes, each with 3σ upregulation), when n = 2, a high expected sensitivity can be achieved by choosing r to be large. For example, r= 500 has an expected capture rate of 24.93 true positives out of 25 total, for an expected sensitivity of 99.7%. However this is at the cost of an FDR of over 80%, as the expected number of false positives is over 128 with a total expected set size of 153.36. Hence the pair r = 500, n = 2 does not appear to be a good choice here. Lowering r from 500 to 100 reduces the expected number of false positives to 4 while maintaining the expected number of true positives captured at about 23 out of 25 (92% expected sensitivity); thus (r = 100, n = 2) appears to be a reasonable choice. Lowering r further achieves a lower FDR, but at the cost of lower expected sensitivity: with n = 2 as r decreases from 50 to 10, the expected sensitivity decreases from 84 % to 36 %. A better trade off would be to require a larger recapture rate with n = 3 while maintaining r = 500, as this combination maintains a sensitivity of 95.6 % (ETP= 23.9 out of 25) while reducing false discoveries (EFP = 4.2 and FDR = 15%) Requiring a recapture rate of 4 out of 4 studies is too stringent for the scenario considered here. Thus either (r = 100, n = 2) or (r = 500, n = 3) appear to be good choices for Alternative Hypothesis I.
For Alternative Hypothesis II (2 true positive genes, each upregulated by 4σ), for a recapture rate of n = 2, thresholds of r = 500, 100 or 50 all have expected sensitivity of 100%, but also have FDR over 40%. (However, note that the number of false discoveries may not be prohibitive.) A cut-off of r = 25 or r = 10 gives better control of the FDR, while maintaining a high expected sensitivity. When n = 3, stringent thresholds such as r = 25 or 10 result in capture of fewer true positives, whereas setting r = 100 appears to be a good trade-off. Again, requiring a recapture rate of n = 4 reduces the expected sensitivity, so the reasonable pairs among those considered appear to be either (r = 100, n = 3) or (r = 10, n = 2).
We have illustrated how equations (2.2) and (7.5) can be used to calculate the expected number of true and false positives, and FDR and expected sensitvity for various postulated hypotheses. In the next section we examine how these methods might be applied when designing a bioinformatic search to test a priori hypotheses of interest.
4.2 Choosing r and n to maximize sensitivity, with FDR ≤ q
The example in Section 4.1 illustrates that the best choice of threshold r and recapture rate n will depend on the number of true positive genes, as well as the effect size for these genes. These considerations suggest how to design a list-intersection test: given an acceptable FDR q, find r and n that maximize the expected sensitivity while maintaining the gene-wise FDR ≤ q. This can be computed for a prespecified alternative hypothesis which postulates tp true positive genes and corresponding effect-sizes as outlined below:
Set an acceptable FDR = q.
- For each possible recapture rate n = 1, 2, … N, find the maximum threshold r(n) which still maintains FDR< q:
-
(a)For each r = 1, …, T:
- compute the expected number of recaptured false positive genes (see equation (2.2)).
- Given tp true positive genes and their effect-sizes, calculate ETP(n, r), the expected number of recaptured true positive genes. This can be obtained using equation (7.5) as .
- Calculate FDR(n,r) as .
-
(b)Let .
-
(a)
For each pair (n, r(n)), calculate its expected sensitiviy, ETP(n,r(n))/tp.
Choose the optimal pair, (n,r(n)), as the pair for which this expected sensitivity is maximized.
To illustrate this strategy, we again examined the two alternative scenarios discussed in Section 4.1. We set T = 10,000, as before and let N vary from 4 to 10 studies. We bounded the FDR by q = 0.01. Table 3 lists the maximum threshold r(n) which satisfies the FDR bound, as obtained from step 2 of the above algorithm, for each possible recapture rate n. Note that r(n) increases strongly with increasing n. For example, under Alternative Hypothesis I, with N = 4 studies and n = 2, the maximum threshold which maintains the FDR cutoff is r(2) = 30, whereas if we consider intersections across all 4 studies (i.e., n = 4), the maximum threshold is as expected larger at 683, since null genes will be less likely to be recaptured across all studies. Note that r(n) decreases as the number of studies N increases since the chance of a false positive increases with the total number of studies and hence the size of the recaptured list would need to be smaller to satisfy the pre-specified FDR.
Table 3.
Examples: finding the maximum threshold r(n) that satisfies FDR ≤ 0.01, as a function of the number of studies N and recapture rate n, for two alternative scenarios. T= 10,000 genes. Sensitivity of the test at the maximum threshold is plotted in Figure 1, as a function of n.
| Alternative Hypothesis I: 25 significant genes, each upregulated by 3-σ | ||||
|---|---|---|---|---|
|
| ||||
| Total # of Studies (N) | ||||
|
| ||||
| Recapture rate (n) | 4 | 6 | 8 | 10 |
|
| ||||
| 2 | 30 | 24 | 20 | 18 |
| 3 | 195 | 126 | 95 | 77 |
| 4 | 683 | 384 | 270 | 210 |
| 5 | - | 869 | 575 | 434 |
| Alternative Hypothesis II: 2 significant genes, each upregulated by 4-σ | ||||
|---|---|---|---|---|
|
| ||||
| Total # of Studies (N) | ||||
|
| ||||
| Recapture rate (n) | 4 | 6 | 8 | 10 |
|
| ||||
| 2 | 7 | 5 | 4 | 3 |
| 3 | 81 | 48 | 34 | 27 |
| 4 | 373 | 194 | 133 | 102 |
| 5 | - | 513 | 332 | 247 |
| 6 | - | 1123 | 659 | 475 |
For each given number of total studies N, Figure 1 plots the expected sensitivity, ETP/tp, against n for the optimal r(n) from Table 3. Given N studies in total, the pair (n, r(n)) that maximizes sensitivity would be the optimal a priori design choice for the study. For instance, under Alternative Hypothesis I and an FDR cutoff of 0.01, with N = 4 total studies, the maximal expected sensitivity of ~ 84% is achieved at recapture rate n = 3, which from Table 3 is achieved at threshold r(3) = 195. The other two scenarios corresponding to (n, r(n)) = (2, 30) or (4, 683) achieve an expected true positive proportion less than 80%. Hence for Alternative I and 4 total studies, (n = 3, r(3) = 195) is the optimal design choice. Note that under a given alternative, as the total number of studies N increases, the best choice of recapture rate n increases, as does the expected proportion of true positive genes recaptured (the expected sensitivity at the optimal choice of (n, r(n)).
Figure 1. Expected sensitivity at r(n) versus recapture rate n, given N studies in total and FDR ≤ 0.01, under two alternative scenarios.
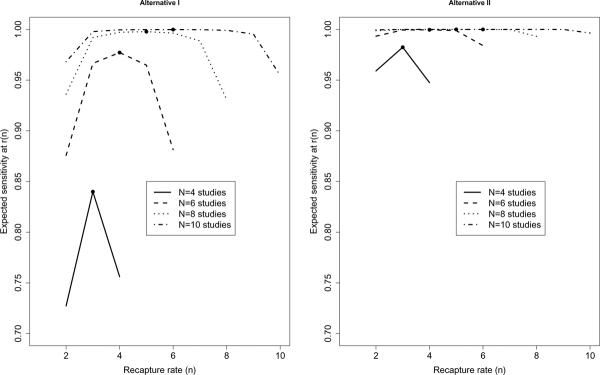
For each recapture rate n, the expected sensitivity at the optimal threshold r(n) is plotted. The filled circle represents the maximum expected sensitivity achievable for a given N. As expected, sensitivity increases as the total number of studies N increases. The recapture rate (n) and threshold (r(n)) which maximize sensitivity represent the optimal design choices which control FDR at the prescribed rate. Here # of features/genes = T = 10,000, and FDR ≤ 0.01; the value of r(n) is from Table 3. Left: Alternative I: 25 true-positive genes each with effect-size = 3σ. Optimal design for (i) N = 4 at n = 3, r = 195; (ii) N = 6 at n = 4, r = 384; (iii) N = 8 at n = 5, r = 575; (iv) N = 10 at n = 6, r = 755. Right: Alternative II: 2 true-positive genes each with effect-size 4σ. Optimal design for (i) N = 4 at n = 3, r = 81; (ii) N = 6 at n = 4, r = 194; (iii) N = 8 at n = 5, r = 332; (iv) N = 10 at n = 6, r = 475.
The calculations in Table 3 and Figure 1 illustrate how a good choice of r and n involves maintaining control of the FDR while maximizing the chance of capturing true positive genes. The best choice of the pair (n, r(n)) of course depends on whether one expects many significant genes with small-moderate effect sizes similar to Alternative I, or few differentially expressed genes at large effect sizes, similar to Alternative II. For a given alternative hypothesis, our design strategy chooses the optimal combination of r and n which maximizes the expected sensitivity, while controlling the FDR at the desired level.
If multiple alternatives are proposed with no clear “winner”, the above procedure can be used to choose the optimal design for several proposed alternatives. Then a Bonferroni correction could be applied, and the gene-sets that pass a Bonferroni corrected significance level would be candidates for further research. Specifically, for a given alternative and optimal design choice (n, r(n)), a p-value can be calculated for each |Sn(r(n))| the test statistic of the observed data. This p-value might be computed using the approximate Binomial or Poisson distributions (Section 2) or via simulation. Then for m possible alternatives, and a significance level α, the gene-sets for which the corresponding p-values are less than α/m are considered “significant”. This procedure strictly controls the Type I error rate on the selected significant sets. Thus under the null model, the probability is α or less of declaring a set of genes to be significant.
5 Example: Mining the Oncomine database for candidate fusion genes in prostate cancer
To illustrate our methods we carried out an example List-Intersection discovery study using the publicly available Oncomine database [Rhodes, 2007], as in the original Tomlins study [Tomlins, 2005]. We identified 4 suitable microarray gene expression prostate cancer studies [Dhanasekaran, 2004, Lapointe, 2004, Tiwari, 2003, Tomlins, 2006]; our selection criterion was that all use a similar cDNA microarray platform, and as is common in such studies [Tomlins, 2005] we assumed that ~ 10, 000 genes would be expressed. Thus we have N = 4 and T = 10, 000. Note that here, unlike in [Tomlins, 2005] we are conducting a genome-wide discovery test, rather than a concordance test based on a list of candidate cancer genes. A second major difference is that Tomlins et al considered N=132 studies across all cancer types and all platforms. Of course, Tomlins et al used an ad hoc strategy to select interesting sets of genes for validation, rather than the statistically motivated use of p-values we are illustrating here. In this setting we know there to be least two true positive genes (the fusion genes identified in Tomlins, et al), and we are interested to see whether our a priori search strategy will find them.
We set the significance level to α = 0.05. We next will pre-specify the pair (n, r(n)), in order to avoid data snooping. Thus under the null hypothesis there would be only 5% probability that the study will declare any gene set to be significant(see example 3.2 and Section 4). As discussed in Section 4.2, good choice of r and n depends on the particular alternative hypothesis postulated. Because in this somewhat artificial setting we know that fusion genes are rare and that at least two exist, Alternative Hypotheses II (see Table 2) with 2 significant genes, each with an effect-size of 4 is a reasonable choice for our study design. As in Table 2, we chose a stringent FDR cutoff of 0.01, with the rationale that then all discoveries within a significant set are likely to be true. Under these conditions, the optimal design choice is (n = 3, r = 81), so that the set of genes S3(81) will be tested for statistical significance (Table 3 and Figure 1).
Next, within each of the 4 identified prostate cancer studies, we ranked the genes according to the “cancer outlier profile analysis” (COPA) procedure implemented in the Oncomine website [Rhodes, 2007]. This statistic measures “fusion-like” properties, and was used by Tomlins et al. [Tomlins, 2005]. We computed the observed test statistic |S3| = |S3(81)| with N = 4 (Section 2) by counting the number of genes that were among the top 81 genes in at least 3 studies (Table 4). As seen in Table 4, the set S3(81) contained 1 “hit” . To compute the associated p-value, we obtained the expected value of |S3(81)| under the null hypothesis as using equation (2.2). Then the probability that a Poisson variate with mean 0.021 will exceed 4 is 0.02, giving the p-value reported in Table 4. Thus we declare the set S3(81) to be a statistically significant set. The single gene in the set S3(81) is ERG, a gene also found by Tomlins et al. in their study, and this would be the single gene recommended for further investigation from our study. At the stringent within-set FDR, we would have confidence at about the 95% level that this was not a false positive result.
Table 4.
List-intersection discovery of fusion-gene candidates across N =4 independent prostate cancer studies.
| # of studies (n) | r = 100 | r = 81 | r = 50 | r = 25 | r = 10 | |
|---|---|---|---|---|---|---|
|
| ||||||
| 2 | |S2(r)| | 10 | 6 | 4 | 4 | 2 |
| p-value | 0.08 | 0.20 | 0.06 | 0.0006 | 0.002 | |
| est.FDR* | 0.59 | 0.65 | 0.37 | 0.09 | 0.03 | |
|
| ||||||
| 3 | |S3(r)| | 1 | 1 | 1 | 1 | 1 |
| p-value | 0.04 | 0.02 | 0.005 | 0.0006 | < 0.0001 | |
| est.FDR* | 0.04 | 0.02 | 0.005 | 0.0006 | < 0.0001 | |
|
| ||||||
| 4 | |S4(r)| | 0 | 0 | 0 | 0 | 0 |
| p-value | 1 | 1 | 1 | 1 | 1 | |
The test statistic |Sn(r)| is the observed number of genes that are ranked among the top r genes in at least n studies; p-value represents the probability of observing |Sn(r)| or more genes under the null hypothesis of random ranking. The entry in bold corresponds to our a priori choice of n = 3, r = 81; as the p-value for this entry is less than 0.05 the corresponding gene set is declared significant.
est.FDR = estimated FDR = E|Sn(r)|/|Sn(r)|
To gain additional insight, Table 4 presents p-values and FDR's for recaptured sets over a range of thresholds r and recapture rates n. Note that only S3(81) (Table 4) is considered a discovery according to our pre-specified analysis strategy; other sets could be presented as exploratory descriptive results. For completeness we also examined the four genes corresponding to |S2(25)|, as this had a highly significant p-value and a reasonable 9% FDR : these are ERG, ETV1, EST and VGLL3, of which the first two were validated as participants in a fusion gene by Tomlins et al. [Tomlins, 2005]. Thus by setting our FDR to the stringent level of 0.01, we accomplished the goal of identifying a significant set which contained no false discoveries, however we missed one of the truly positive genes. Since validation of such bioinformatic searches using rtPCR or other experimental techniques is expected, applying a less stringent a priori FDR may be a reasonable approach.
To investigate the adequacy of the Poisson approximation, the p-values in Table 4 were also verified by direct simulation as in Section 7.1. The p-value for the observed |S3(81)| = 1 (Table 4) via direct simulation was 0.0188 compared to the Poisson approximation p-value of 0.0209. Considering the observed counts |S2(r)| in Table 4, the p-values derived from the simulated null distribution of S2(r) were 0.0775, 0.2001, 0.0602, 0.0004, and 0.0018 respectively, for the corresponding thresholds r of 100, 81, 50, 25, and 10. Thus the Poisson approximation p-values and simulated p-values show good concordance.
6 Conclusions and Future Directions
Public repositories of genomic data continue to grow, and list- intersection approaches similar to those considered here are likely to become even more common in the future, as several repositories of curated gene lists have recently been published which include tools for comparing lists and intersecting lists of top-ranked genes across multiple similar studies [Glez-Pena, 2009, Culhane, 2010]. The primary statistical challenges for analyzing data from such repositories are controlling the number of false positive results and maintaining a valid basis for inference when combining multiple studies [Benjamini, 2008b].
A well-established method for pooling results across multiple studies is meta-analysis. This approach is usually conducted gene-by-gene, and produces a combined p-value (or effect-size) for each gene [Zaykin, 2002, Benjamini, 2008, Garrett-Mayer, 2008, Pyne, 2006]. However, under this approach it is possible that a significant gene can be declared based on a few studies which display large effects, with null effects observed in most studies, and this can lead to high false positive rates [Pyne, 2006]. Garrett-Mayer [Garrett-Mayer, 2008]et al discuss the importance of first identifying genes that are consistently measured across different microarray platforms, which is clearly a useful preliminary analysis for reducing false positives. There is evidence that rank-based approaches may be more robust and better guard against false discoveries, while maintaining adequate power, compared to more traditional methods of meta-analysis [Hong, 2008]. Formal or informal rank-based meta analyses for combining effect sizes across multiple studies have been proposed in the applied and methodological literature [Chan, 2008, Jeffries, 2006, Deng, 2008, Miller, 2010].
Our approach compares within-study ranks to a common threshold, and is an effort to explore the inferential basis of the list-intersection approach. We provide exact formulas which allow examination of power and false discovery rates. Our rank-threshold method does not combine individual per-gene effect sizes, such as ranks, across multiple studies. Instead, we evaluate the entire set of genes recaptured as above a rank threshold across multiple studies. Thus we obtain a p-value per recaptured set, with tight control of the set-wise Type I error rate. In this sense our method is more stringent than an approach which combines gene-by gene effect sizes across studies. Our set-based method may also provide tighter control of gene-level Type I error and false discovery rates, although this is the subject of future research.
In related work [Pyne, 2006], a pooled p-value is calculated together with a consensus parameter defined as the number of studies in which a feature has to be declared significant before it is considered significantly validated across studies. Thus the consensus parameter plays a similar role as our recapture rate n. Pyne et al. [Pyne, 2006] describe results for different values of such consensus parameters but do not give guidelines on how to choose this parameter. Our work provides the applied practitioner with p-values and expected number of false positives under various choices for within-study significance thresholds r and recapture rates n, which could be used to guide decisions on significant “gene-sets”.
Another method, the partial conjunction hypothesis test of Benjamini et al [Benjamini, 2008, Benjamini, 2008b], uses a p-value threshold to consider among how many studies out of N, a given gene is found to be significant at a given level, where each study addresses a different research hypothesis. For each gene g, the set of hypotheses that the gene is null in n or fewer studies is simultaneously tested, for 1 ≤ n ≤ N. A general data-driven method for controlling the FDR across all genes is presented, where the number of false discoveries is defined as the number of genes which have been called significant in at least one study in which the gene was truly null. In this setting the studies may address differing alternative hypotheses, and the focus is on the situation where a gene can be truly null in some but not other studies, and where this may differ from gene to gene. Thus it is of interest to ascertain for each gene in which studies among all N considered it is truly significant. This differs from the scenario consdered in the present paper, in which the studies are assumed to each test the same hypothesis. In the setting of Benjamini et al power necessarily declines as the total number of studies N increases [Benjamini, 2008b]. This is in contrast to our Figure 1, in which the expected sensitivity increases with the total number of studies N. Benjamini el at have the advantage, however, of controlling the false discovery rate in a data-driven manner. By contrast, we allow the user to set the number of studies n that a gene is required to be captured by, and we study how the expected true positive proportion and false discovery rates are affected by which alternative is considered to hold. Our interest is in scenarios where the alternative hypothesis is the same across studies, as is often the case in genomic studies.
In another approach to the problem, Lu et al. [Lu, 2008] develop a bootstrap methodology for assessing the average frequency with which significant genes will be rediscovered under independent validation. This approach is useful at the end of a study when significant gene-lists have been identified. In particular, it can be used to estimate the stability of discovered genes, and also to compare different ranking procedures applied within the same study.
Our goal here is to provide a formal statistical method for evaluating genes that replicate across multiple studies. We discuss how one might a priori choose within-study significance thresholds (i.e., r) and cross-study recapture rates (i.e., n) to ensure (i) adequate probability of capturing true positives, and (ii) low false discovery rate within the recaptured set, when designing a bioinformatic search across multiple genomic datasets. After this search is complete, our methods can also be applied to obtain p-values for observed recaptured sets, although the bootstrap can also be used to obtain p-vaues. Our approach has some important limitations. The methodology we describe assumes that the threshold r for determining high-ranking genes is the same for all studies, as are the corresponding probabilities p0 of selecting a null gene (for use in computing p-values) and pa of selecting a di erentially expressed gene (for use in computing the expected proportion of true positives). These assumptions could be relaxed computationally, although the distributional calculations would then lose their simple closed form solutions. Often when comparing results across studies the technology used to generate the data will be similar, in which case requiring similar parameters across studies should not pose a serious problem. In fact, this assumption is analogous to the homogeneity test in meta-analysis where only studies with similar design, populations, and measurement methods are pooled. Further, as with many methods in common use in the analysis of gene-expression data, our calculations assume that genes are independent which is unlikely to be the case in practice, as was discussed in Section 2.2.2. As with any analysis of gene-expression data using microarrays, RNA-seq or other technologies, it is expected that results will be independently verified using different experimental methods.
In summary, in this article we describe a simple and rigorous inferential method for evaluating the consistency of results across multiple independent studies, using a combined Type I error for discovery of a significant gene set, and an estimated FDR within the gene set. We show how to choose study parameters to maximise the expected number of significant genes that will be captured. Future work will consider related approaches which are based on FDR control. The framework we describe for selecting a significant set of genes is used widely by biologists and bioinformaticians [Tomlins, 2005, Pyne, 2006, Glez-Pena, 2009, Culhane, 2010, Benjamini, 2008b]. We hope that providing a simple computational and statistical underpinning for such studies will lead to more formal use of these methods with corresponding improved control of Type I error rates.
Acknowledgments
Funding This work was supported by the Breast Cancer Research Foundation [Barbara Parker, PI], and the National Cancer Institute (5 P30 CA23100-23).
7 Appendix
7.1 Simulation study
We conducted a small simulation study to judge the quality of the Binomial and Poisson approximations to the null distribution of the recapture statistic |Sn|. The simulated null distribution of |SIn| is displayed graphically in Figure 2. These graphs were derived via 10,000 simulations with parameter values T =10,000, r = 1000, and N = 5. At each iteration, to simulate |Sn|, a random selection of r genes from T was drawn for each of the N studies. For each n, with 2 ≤ n ≤ N, the set Sn was obtained as the genes ranked in the top r in at least n studies. Then |Sn| was noted and this completed one simulation. This process was repeated 10,000 times and a histogram of the resulting values of |Sn| was plotted. The graphs also show the Binomial and Poisson distributions with parameters T and , where is as in (2.2). All computations were done in R version 2.2.
Figure 2.

Simulated null distribution of the test statistic |Sn(r)| = # of genes that are ranked r or higher in at least n of N studies (T = 10,000, r = 1000, N = 5, # of simulations = 10,000): Dashed black curve = simulated distribution; solid blue curve = Binomial distribution with parameters T and (equation 2.2); solid red curve = Poisson distribution with parameters T and (equation 2.2). Note: (i) top left: for (r = 1,000, n = 2) the approximation of |Sn(r)| via the Binomial/Poisson distributions is poor; (ii) bottom: for n = 4 and n = 5, the simulated and Binomial and Poisson distributions are indistinguishable in the graphs.
As seen in Figure 2, for n > 2, differences between the simulated distribution of |Sn| and the approximating Binomial or Poisson distributions appear to be within the simulation error for these parameter values, indicating that the approximations are very good in this range. As expected, for n = 2 the approximations do not appear as good, since in this case E|Sn| = 814.6 is not small relative to r = 1000. Hence in this scenario, the Bernoulli trials Bg and Bh (i.e., the probability that genes g and h are recaptured at least n times) have relatively strong dependence, because the selection of gene g in Sn reduces the chance that gene h will also be selected. Thus, as previously noted, the null distribution of the List-Intersection statistic is approximately Binomial (and Poisson) provided T is large relative to r, r is large relative to E|Sn| and is small, conditions that are met for n > 2 in this simulation experiment.
7.2 Alternative distribution of |Sn|
Under standard models of the alternative hypothesis, the distribution of the number of truly expressed genes which are recaptured can similarly be derived. Denote by pa the probability that true positive gene ga ranks among the top r genes in a given study, and assume as before that this probability is the same across studies. Then, as in equation (2.2), the probability that gene ga is recaptured in n or more studies is given by
| (7.5) |
where X ~ Bin(N, pa). Now assuming that there are tp truly significant genes among the T total genes, let if the ath truly significant gene ranks among the top r genes in n or more studies, and otherwise. Then, with given by (7.5). Hence under the alternative hypothesis, the number of true positive genes in Sn is , with expectation , with the second equality holding if all the truly significant genes have a common probability pa of ranking in the top r in a given study. In this case |Sn| is the appropriate mixture distribution with expectation ; if the can be treated as approximately independent then the distribution is an approximate Poisson mixture.
The parameter pa plays a role in study design and values for this probability may be posited from prior knowledge about distributions of true positive genes, via simulations or by using combinatorial arguments. For example, let ga be a gene which is truly significant. Let be the event that gene ga ranks higher than a randomly chosen gene gi, with corresponding probability , and suppose is known or can be modeled appropriately. The probability pa that gene ga will rank among the top r genes in a particular study, may be computed using the inclusion exclusion principle [Feller, 1957], since this event occurs if T − r or more of the events occur. In this case:
where is the sum of the intersection probabilities with the sum taken over all possible enumerations of k indices. If the null and alternative genes were iid independent, the sum would simplify to a binomial tail probability as in (2.2).
Under a parametric normal model of scores for both null and significant genes, a more tractable expression for pa can be obtained. For example, assume after suitable normalization that the score for any given null gene follows a standard normal distribution, while the score for a truly significant gene is Gaussian with mean μ and variance 1. Thus the score for a randomly selected gene among πT null genes and n = (1 − π)T significant genes follows a mixture of standard and shifted normal distributions. In this setting, given threshold r, the probability pa that a significant gene g ranks among the top r genes can be calculated directly as follows: let p0 = r/T as before, and let q be the corresponding percentile of the mixture distribution, so that p0 = π(1 − Φ(q)) + (1 − π)(1 − (q − μ)). Then, given p0 and μ, one can solve for q using numerical approximation routines, and obtain pa as follows:
| (7.6) |
which is easily computed using standard software. Although in practice different positive genes would likely have different effect-sizes μ, this approach is useful as a guide in the design of a validation study based on the capture-recapture statistic. An example is given in Section 4.1.
Footnotes
Conflict of Interest: None declared.
References
- Benjamini Y, Heller R. Screening for partial conjunction hypotheses. Biometrics. 2008;64:1215–1222. doi: 10.1111/j.1541-0420.2007.00984.x. [DOI] [PubMed] [Google Scholar]
- Benjamini Y, Heller R, Yekutieli D. Selective inference in complex research. Phil Transactions Royal Society A. 2008;367:4255–4271. doi: 10.1098/rsta.2009.0127. [DOI] [PMC free article] [PubMed] [Google Scholar]
- Brazma A, Parkinson H, Sarkans U, et al. S ArrayExpress–a public repository for microarray gene expression data at the EBI. Nucleic Acids Res. 2003;31:68–71. doi: 10.1093/nar/gkg091. [DOI] [PMC free article] [PubMed] [Google Scholar]
- Chan SK, Griffith OL, et al. Meta-analysis of colorectal cancer gene expression profiling studies identifies consistently reported candidate biomarkers. Cancer Epidemiology Biomarkers & Prevention. 2008;17(3):543–552. doi: 10.1158/1055-9965.EPI-07-2615. [DOI] [PubMed] [Google Scholar]
- Culhane AC, Schwarzl T, et al. GeneSigDB-a curated database of gene expression signatures. Nucleic Acids Research. 2010;38:D716–D725. doi: 10.1093/nar/gkp1015. [DOI] [PMC free article] [PubMed] [Google Scholar]
- Deng XT, Xu J, et al. Improving the power for detecting overlapping genes from multiple DNA microarray-derived gene lists. BMC Bioinformatics. 2008;9:8. doi: 10.1186/1471-2105-9-S6-S14. [DOI] [PMC free article] [PubMed] [Google Scholar]
- Dhanasekaran SM, Dash A, Yu N, Maine IP, Laxman B, Tomlins SA, Creighton CN, Menon A, Rubin MA, Chinnaiyan AM. Molecular profiling of human prostate tissues: insights into gene expression patterns of prostate development during puberty. FASEB N. 2004;9:243–245. doi: 10.1096/fj.04-2415fje. [DOI] [PubMed] [Google Scholar]
- Edgar R, Domrachev M, Lash AE. Gene Expression Omnibus: NCBI gene expression and hybridization array data repository. [accessed 12/14/2009];Nucleic Acids Research. 30:207–210. doi: 10.1093/nar/30.1.207. https://www.oncomine.org/resource/login.html. [DOI] [PMC free article] [PubMed] [Google Scholar]
- Feller W. (Wiley Series in Probability and Mathematical Statistics).An Introduction to Probability Theory and Its Applications. 1957;Vol. 1 [Google Scholar]
- Futreal PA, Coin L, Marshall M, Down T, Hubbard T, Wooster R, Rahman N, Stratton MR. A census of human cancer genes. Nat Rev Cancer. 2004;4(3):177–83. doi: 10.1038/nrc1299. [DOI] [PMC free article] [PubMed] [Google Scholar]
- Garrett-Mayer E, Parmigiani G, Zhong XG, Cope L, Gabrielson E. Cross-study validation and combined analysis of gene expression microarray data. Biostatistics. 9:333–54. doi: 10.1093/biostatistics/kxm033. [DOI] [PubMed] [Google Scholar]
- Glez-Pena D, Gomez-Lopez G, Pisano DG, Fdez-Riverola F. WhichGenes: a web-based tool for gathering, building, storing and exporting gene sets. Biostatistics. 2008;9:333–54. doi: 10.1093/nar/gkp263. [DOI] [PMC free article] [PubMed] [Google Scholar]
- Hong FX, Breitling R. A comparison of meta-analysis methods for detecting differentially expressed genes in microarray experiments. Bioinformatics. 2008;24(3):374–382. doi: 10.1093/bioinformatics/btm620. [DOI] [PubMed] [Google Scholar]
- Irizarry RA, Warren D, et al. Multiple-laboratory comparison of microarray platforms. Nature Methods. 5:345–349. doi: 10.1038/nmeth756. [DOI] [PubMed] [Google Scholar]
- Jeffries CD, Ward WO, et al. Discovering collectively informative descriptors from high-throughput experiments. BMC Bioinformatics. 2009;10:9. doi: 10.1186/1471-2105-10-431. [DOI] [PMC free article] [PubMed] [Google Scholar]
- Lapointe N, Li C, Higgins NP, Van De Rijn M, Bair E, Montgomery K, Ferrari M, Egevad L, Rayford W, Bergerheim U, Ekman P, DeMarzo AM, Tibshirani R, Botstein D, Brown PO, Brooks ND, Pollack NR. Gene expression profiling identifies clinically relevant subtypes of prostate cancer. Proceedings of the National Academy of Sciences. 2004;101:811–816. doi: 10.1073/pnas.0304146101. [DOI] [PMC free article] [PubMed] [Google Scholar]
- Lu X, Gamst A, Xu R. RDCurve: a nonparametric method to evaluate the stability of ranking procedures. Trans. Comput. Biolo. & Bioinf. 2008:138. doi: 10.1109/TCBB.2008.138. [DOI] [PubMed] [Google Scholar]
- Miller BG, Stamatoyannopoulos JA. Integrative Meta-Analysis of Differential Gene Expression in Acute Myeloid Leukemia. Plos One. 2010;5(3):13. doi: 10.1371/journal.pone.0009466. [DOI] [PMC free article] [PubMed] [Google Scholar]
- Pyne S, Futcher B, Skiena S. Meta-analysis based on control of false discovery rate: combining yeast ChIP-chip datasets. Bioinformatics. 2006;22:2516–2522. doi: 10.1093/bioinformatics/btl439. [DOI] [PubMed] [Google Scholar]
- Rowley JD. Letter: A new consistent chromosomal abnormality in chronic myelogenous leukaemia identified by quinacrine fluorescence and Giemsa staining. Nature. 1973;243(5405):2903. doi: 10.1038/243290a0. [DOI] [PubMed] [Google Scholar]
- Rhodes DR, Kalyana-Sundaram S, Mahavisno V, et al. Oncomine 3.0: genes, pathways, and networks in a collection of 18,000 cancer gene expression profiles. Neoplasia. 2007;9:166–180. doi: 10.1593/neo.07112. [DOI] [PMC free article] [PubMed] [Google Scholar]
- Tibshirani R, Hastie T. Outlier sums for differential gene expression analysis. Biostatistics. 2007;8:2–8. doi: 10.1093/biostatistics/kxl005. [DOI] [PubMed] [Google Scholar]
- Tiwari G, Sakaue H, Pollack NR, Roth RA. Gene expression profiling in prostate cancer cells with Akt activation reveals Fra-1 as an Akt-inducible gene. Molecular Cancer Research. 2003;1:475–484. [PubMed] [Google Scholar]
- Tomlins SA, Rhodes DA, Perner S, Dhanasekaran SM, Mehra R, Sun X, Varambally S, Cao X, Tchinda N, Kuefer R, et al. Recurrent Fusion of TMPRSS2 and ETS Transcription Factor Gens in Prostate Cancer. Science. 2005;310:644–648. doi: 10.1126/science.1117679. [DOI] [PubMed] [Google Scholar]
- Tomlins SA, Mehra R, Rhodes DR, Cao X, Wang L, Dhanasekaran SM, Kalyana-Sundaram S, Wei NT, Rubin MA, Pienta KN, Shah RB, Chin-Naiyan AM. Integrative molecular concept modeling of prostate cancer progression. Nature Genetics. 2006;39:41–51. doi: 10.1038/ng1935. [DOI] [PubMed] [Google Scholar]
- Zaykin DV, Zhivotovsky LA, Westfall PH, Weir BS. Truncated product method for combining P-values. Genetic Epidemiology. 2002;22:170–185. doi: 10.1002/gepi.0042. [DOI] [PubMed] [Google Scholar]