Abstract
Ferredoxins are iron–sulfur proteins that have been studied for decades because of their role in facilitating the monooxygenase reactions catalyzed by p450 enzymes. More recently, studies in bacteria and yeast have demonstrated important roles for ferredoxin and ferredoxin reductase in iron–sulfur cluster assembly. The human genome contains two homologous ferredoxins, ferredoxin 1 (FDX1) and ferredoxin 2 (FDX2 — formerly known as ferredoxin 1L). More recently, the roles of these two human ferredoxins in iron–sulfur cluster assembly were assessed, and it was concluded that FDX1 was important solely for its interaction with p450 enzymes to synthesize mitochondrial steroid precursors, whereas FDX2 was used for synthesis of iron–sulfur clusters, but not steroidogenesis. To further assess the role of the FDX–FDXR system in mammalian iron–sulfur cluster biogenesis, we performed siRNA studies on FDX1 and FDX2, on several human cell lines, using oligonucleotides identical to those previously used, along with new oligonucleotides that specifically targeted each gene. We concluded that both FDX1 and FDX2 were important in iron–sulfur cluster biogenesis. Loss of FDX1 activity disrupted activity of iron–sulfur cluster enzymes and cellular iron homeostasis, causing mitochondrial iron overload and cytosolic iron depletion. Moreover, knockdown of the sole human ferredoxin reductase, FDXR, diminished iron–sulfur cluster assembly and caused mitochondrial iron overload in conjunction with cytosolic depletion. Our studies suggest that interference with any of the three related genes, FDX1, FDX2 or FDXR, disrupts iron–sulfur cluster assembly and maintenance of normal cytosolic and mitochondrial iron homeostasis.
Keywords: Iron, sulfur cluster biogenesis, RNAi, Mitochondrial iron accumulation, Heme biosynthesis, Cellular iron homeostasis
1. Introduction
Ferredoxins are iron–sulfur proteins that generally act as electron transfer proteins. Ferredoxins, which are found in numerous plants, bacteria and animals, were among the first proteins to crystallize, and they have been extensively structurally characterized because of their known role in providing electrons to cytochrome p450 enzymes, which need a source of electrons to complete mono-oxygenation reactions involved in normal steroid metabolism and numerous detoxification reactions (reviewed in [1,2]). Over the last decade, it has become apparent that both a ferredoxin and ferredoxin reductase are required for synthesis of iron–sulfur clusters in several model organisms. A ferredoxin gene found in an iron–sulfur cluster biogenesis operon in Azotobacter vinelandii[3] was characterized as a [2Fe–2S] cluster protein [4] and deletional analysis revealed that a ferredoxin in E. coli was necessary for viability [5]. Since S. cerevisiae lack p450 enzymes, it was not initially clear why deletions of the ferredoxin, Yah1, [6] and the ferredoxin reductase, Arh1[7] were lethal. Based on the emerging possibility that ferredoxin played an important role in iron–sulfur cluster biogenesis, depletion studies of ferredoxin (Yah1) were performed in S. cerevisiae, and iron–sulfur cluster protein activities were concomitantly diminished. Attempts to rescue the Yah-depleted cells with human FDX1 engineered to contain a yeast mitochondrial targeting signal were unsuccessful [8]. Similarly, depletion of the S. cerevisiae ferredoxin reductase, Arh1, resulted in both a compromise of iron–sulfur cluster assembly, and also an unexplained decrease of the heme protein, cytochrome C, and cytochrome oxidase subunit 3 [9]. In S. cerevisiae, depletion of either Yah1 or Arh1 resulted in marked mitochondrial iron overload [8,9], a phenotype that is often observed when iron–sulfur cluster assembly proteins are deleted in yeast or deficient in some human diseases [10].
The human genome contains two homologous ferredoxins, FDX1, located on chromosome 11q22, and a paralogue previously identified as FDX1L, but renamed as FDX2 in a recent study [11]. Interestingly, both genes are expressed ubiquitously, (http://www.ebi.ac.uk/gxa), but FDX1 is very highly expressed in adrenal cortex and medulla, whereas FDX2, on chromosome 19p13.2, is ubiquitously expressed, with its highest levels of expression found in regions of the central nervous system, including the cortex, cerebellum and the trigeminal and dorsal root ganglia. When rescue of the Yah1-depleted S. cerevisiae was attempted with FDX2, the rescue was successful, leading Sheftel et al. to hypothesize that FDX2 was dedicated to iron–sulfur cluster biogenesis, whereas FDX1 was dedicated to steroid biogenesis. Both ferredoxins contain a FeS cluster. Upon knockdown of FDX1, aconitase and SDH activities were normal, whereas iron–sulfur enzyme activities were abnormal in cells in which FDX2 was silenced [11], supporting the proposal by Sheftel et al. that the two ferredoxins have distinct and non overlapping biochemical roles.
The exact molecular role of ferredoxins in iron–sulfur cluster assembly remains unknown, although experiments in cluster reconstitution have shown that bacterial ferredoxin may function as the physiological reductant when iron–sulfur clusters form on the scaffold protein, IscU [12]. Here, we confirm that knockdown of FDX2 interferes with iron– sulfur cluster assembly, as previously asserted [11]. However, in contrast to the previous study, we demonstrate that FDX1 silencing also significantly compromises iron–sulfur proteins, and causes mitochondrial iron overload and cytosolic iron depletion. In addition, we demonstrate that knockdown of the sole identified ferredoxin reductase in the human genome, FDXR, compromises iron–sulfur cluster formation and leads to misregulation of cellular iron homeostasis. Our results suggest that both FDX1 and FDX2 and their likely reductase partner, FDXR, contribute to iron–sulfur cluster biogenesis.
2. Materials and methods
2.1. Antibodies
Human FDX1 antibody was raised against purified human FDX1 protein which was cleaved from a GST fusion protein generated from pGEX 4T-3/hFDX1 with thrombin. Antiserum was generated in New Zealand white rabbits by Covance Laboratories Inc. (Vienna, VA) and affinity purified using pure protein coupled on the medium of CNBr-activated sepharose 4B (Amersham Pharmacia). Antibodies to IRP1, IRP2, FECH and ALAS2 were generated as described previously [13]. Other antibodies were α-tubulin (Sigma-Aldrich), SOD2 (Abcam), NTH (R&D system, Cat No. MAB2675), Ferredoxin reductase (Abcam), MiroProfile Total OXPHOS rodent antibody cocktail (MitoScience), Cytochrome C (MitoScience), heme oxygenase 1 (HMOX-1) (Epitomics), mitoferrin (MFRN) (generous gift from Prof. Barry Paw), L-ferritin antibody (L-FTN) (1:5000) was a generous gift from Dr. Esther G. Meyron-Holtz.
2.2. Cell cultures, lysates and subcellular fractionation
Human erythroid leukemia (K562) cells (ATCC) were maintained in RPMI 1640 medium containing 10% FBS, 2 mM l-glutamine, and 100 U/ml PenStrep. HeLa cells were grown in Dulbecco's modified Eagle's medium (DMEM)-complete medium (DMEM medium supplemented with 10% fetal calf serum (FCS), 10%U/ml Penicillin-Streptomycin (Gibco), and 2 mM l-glutamine(Gibco) in a humidified incubator at 5% CO2). Human colon cancer cell lines HCT116 (American Type Culture Collection, Manassas, Virginia) were maintained in McCoy's 5A modified medium (Life Technologies, Grand Island, New York) supplemented with 10% FBS and 10%U/ml Penicillin-Streptomycin (Gibco). Treatments with the iron chelator, deferoxamine mesylate (Dfo, Sigma) or ferric ammonium citrate (FAC, Fisher Scientific) were performed by incubating cells for 16 h in DMEM-complete medium with 50 μM Dfo or 100 μM FAC, then washed and incubated in DMEM-complete medium for up to 24 h. Triton lysates were prepared as previously described with addition of 2 mM citrate. Subcellular fractions were prepared and mitochondrial iron contents were measured as previously described [13].
2.3. RNA interference assays
The control siRNA was the non-targeting siRNA (Qiagen). siRNAs against human FDX1 were purchased from QIAGEN. The target sequences are listed in supplemental material Table S1. For RNA interference experiments, HeLa cells were cultured in DMEM with 10% vol/vol FBS and transfected at 30%–50% confluency with 100 nM siRNA using Lipofectamine 2000 (Invitrogen) every 72 h for 3–9 days. Human erythroid K562 cells (ATCC) were maintained in RPMI 1640 med 10% FBS, 2 mM l-glutamine, and 100 U/ml PenStrep. To transfect K562 cells, HiPerFect reagent (QIA-GEN) was used following the manufacturer's protocol. The cells were subsequently harvested and used for further studies.
2.4. Enzymatic activity assays
All enzymatic assays except aconitase activity assay were carried out on 96-well plates. A multiscan MCC plate reader (Fisher) was used for data acquisition.
2.5. Aconitase in-gel assay and electrophoretic mobility shift assay
Aconitase was assayed using a coupled assay after native PAGE separation, as described previously [13]. IRP-IRE binding activity was determined by electrophoretic mobility shift assay using a 32P-labeled ferritin IRE probe, as described previously [13].
2.6. Lactate dehydrogenase assay
Lactate dehydrogenase (LDH) activity was assessed according to the manufacturer's instructions. For FDX1 RNAi cells and wild type cells using Sigma Diagnostics' Lactate Dehydrogenase Kit (Product No. TOX-7), 100 μg whole protein of each sample was used for the assay, and an ELISA spectrophotometer system (Fisher Scientific) was used for data acquisition.
2.7. Xanthine/xanthine oxidase assay
XO activity was assayed using Amplex Red XO Assay Kit (Molecular Probes).
2.8. Complex I enzyme activity assay
Complex I enzyme activity assay was performed using the Complex I Enzyme Activity Dipstick Assay Kit (MitoScience, MS130) according to the manufacturer's instructions.
2.9. Quantitative real-time RT-PCR
Total RNA was extracted from HeLa cells using an RNeasy mini kit (QIAGEN, Maryland, USA) according to the manufacturer's instructions, and the quality of RNA (i.e., A260/280 > 1.8) was confirmed. The determination of mRNA by qRT-PCR was carried out using total RNA (1 μg) as a template and poly (dT) as a primer for cDNA synthesis by SuperScript II reverse transcriptase (Invitrogen). The mRNA levels of each gene were determined by quantitative real-time PCR using SYBR GreenER qPCR supermix (Invitrogen) and an ABI PRISM 7900HT Sequence Detection System.
A typical reaction mixture contained 25 μl of Platinum SYBR Green qPCR SuperMix-UDG, 1 μl of both forward primer (10 μM) and reverse primer (10 μM), 1 μl ROX Reference Dye, cDNA generated from 1 μg of total RNA, supplemented with DEPC-treated water to get a reaction mixture with final volume of 50 μl. The standard cycling program were: 50 °C for 2 min; 95 °C for 2 min. 40 cycles of: 95 °C for 15 s, 60 °C for 30 s, and 70 °C for 15 s. Correct quantitative RT-PCR product size was verified by agarose gel electrophoresis (data not shown). All primers used in the studies are listed in supplemental material Table S2. Relative transcript abundance was calculated using the 2−ΔΔct method, with GAPDH as the internal control.
2.10. Western blot analysis
The protein concentration was determined by the Bradford method (Pierce Chemical Co., Rockford, IL) with bovine serum albumin (Pierce Chemical Co.) as the standard. Western blot analysis was carried out as described previously [13].
2.11. Heme and iron assay
RNAi treated cells were washed with PBS to remove culture medium. After lysis, heme was quantified using the QuantiChrom Heme Assay Kit (BioAssay Systems). Cellular nonheme iron was quantified using the QuantiChromTM Iron Assay Kit (DIFE-250) from BioAssay Systems, which measures Fe2+ using a chromagen that forms a blue-colored complex specifically with Fe2+. In the assay, Fe3+ is reduced to Fe2+ prior to measurement at590 nm in the presence of chromagen.
2.12. Statistical analysis
All data excepting iron content measurements are expressed as means±SEM. Statistical analysis was performed using unpaired 2-tailed Student's t test, with P values less than 0.05 considered to be significant. In terms of iron content measurement, ANOVA followed by two-tail Dunett's test was used for statistic analysis, with P value is less than 0.05 considered to be significant.
3. Results
3.1. FDX1 is a component of both mitochondrial and cytosolic [Fe–S] machinery
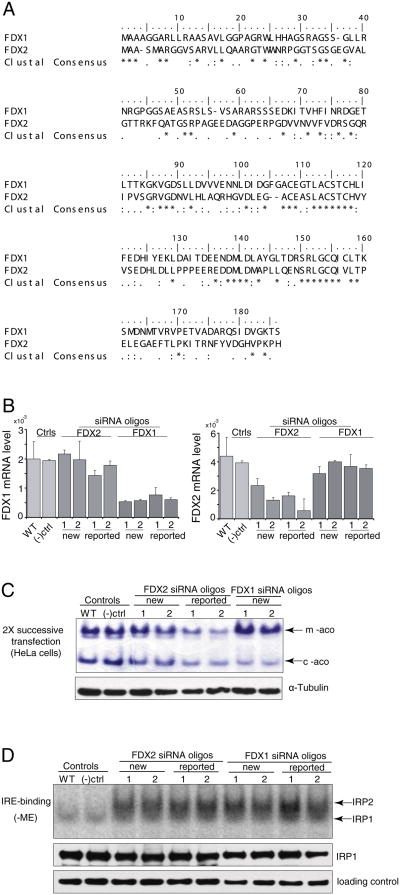
Protein sequence alignment revealed that FDX1 and FDX2 were 33% identical and 52% similar (Fig. 1A), and both contained long arginine-rich mitochondrial targeting sequences. To investigate the function of FDX1, we assessed its role in human Fe–S biogenesis by using RNAi technology in both HeLa and K562 cells and then measuring the enzymatic activities of several iron sulfur proteins. To develop tools for RNAi experiments, we used two previously reported oligonucleotides to target specifically either FDX1 or FDX2 [11], and we also designed several new oligonucleotides for each gene using areas of sequence dissimilarity. No changes of FDX1 mRNA were observed in FDX2 knock-down cells compared with wild-type and negative control cells (Fig. 1B, left panel); FDX2 mRNA also showed no obvious changes in FDX1 knock-down cells compared with wild-type and negative control cells (Fig. 1B, right panel). For these studies, several new oligos were designed as described in Materials and methods, and they were used to perform knockdown studies along with oligos that worked in a previous report [11]. RT-PCR analysis of either the FDX1 or FDX2 transcripts showed that the highest level of inhibition was reached 72 h after the third of three successive transfections (data not shown). Since recent studies on FDX1 and FDX2 claimed that FDX2, but not FDX1 was a member of the mitochondrial FeS protein assembly machinery, we assessed FeS activities after knockdowns of FDX1 or FDX2. We next performed a series of enzyme assays to evaluate the results of either FDX1 or FDX2 knockdown on the activities of several FeS proteins. First, the nondenaturing aconitase activity assay was used to monitor FeS cluster assembly in the mitochondria and cytosol of HeLa cells, a classical experiment that is frequently used to investigate the role of proteins involved in the Fe–S biosynthesis [10]. After only two successive transfections, we observed decreased mitochondrial and cytosolic aconitase activities in cells depleted of FDX2, in agreement with a recent report [11], but we also observed diminished cytosolic aconitase activity in cells depleted of FDX1 (Fig. 1C), which did not agree with the same recent report [11], and which made us realize that FDX1 might have a clear effect on iron–sulfur cluster biogenesis if we achieved a more complete knockdown (see Fig. 3).
Fig. 1.
Silencing of either FDX1 or its homologue, FDX2, diminishes aconitase activities and activates iron-responsive element (IRE)-binding protein activities. (A) Protein sequence alignment of human FDX1 and FDX2. Identical residues are marked byasterisks, and similar residues are denoted by dots. (B) Comparison of mRNA change to evaluate specificity in FDX1 or FDX2 knock-downs in HeLa cells. (C) In-gel aconitase assays revealed activity of mitochondrial and cytosolic aconitases in HeLa cells treated with FDX1 and FDX2 siRNA (WT, wild-type; (–)ctrl, negative control; oligo, siRNA of either FDX1 or FDX2) after two successive transfections. (D) Gel retardation assays of IRPs. Transfected cells were harvested six days after two successive transfections and analyzed for total binding activity of IRP1 and IRP2 to 32P-labeled IRE of human ferritin mRNA. Lysates of WT, FDX1 and FDX2 knock-down HeLa cells (10 mg protein/lane) were incubated with 32P-IRE and resolved on a 10% non-denaturing gel. Lanes were: WT, wild type; (–) ctrl, negative control; oligo, siRNAs of FDX1 or FDX2 as labeled. IRP1 is the bottom band and IRP2 is the upper band of the IRP-IRE complexes. Western blots for IRP1 and α-tubulin (loading control) demonstrate equal loading of the gels.
Fig. 3.
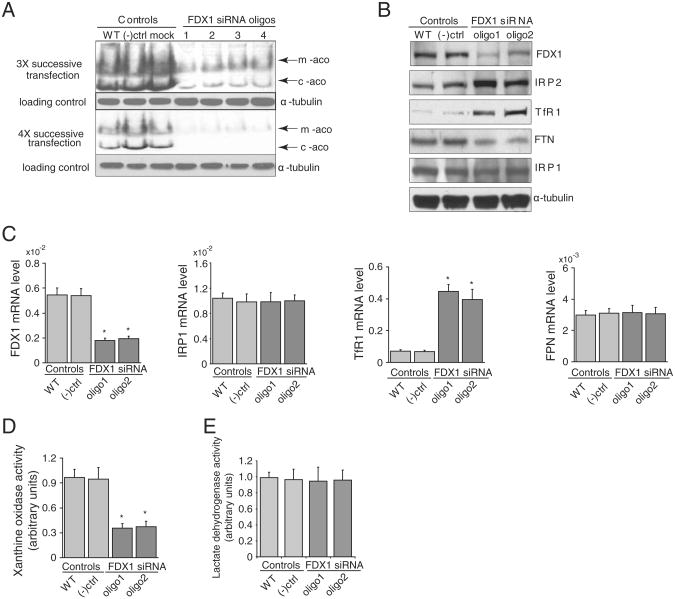
FDX1 knock-down leads to increased IRP2, and indications of cytosolic iron depletion. (A) FDX1 knock-downs were performed using four independent oligos and both mitochondria and cytololic aconitase activities were diminished after three or four successive transfections. Aconitase activity assay revealed reduced activity of mitochondrial and cytosolic aconitases in HeLa cells treated with FDX1 siRNA (Lanes are WT, wild-type; (–)ctrl, negative control represent cells treated with Lipofectamine 2000 reagent; oligos 1–4 represent different siRNAs of FDX1). (B) Comparison of protein expression levels between FDX1 knock-down HeLa cells and wild-type and negative control HeLa cells. At the protein expression level, western blots of cells transfected with newly designed FDX1 siRNA revealed that IRP1 and α-tubulin levels (loading control) did not significantly change, IRP2 and TfR1 protein levels increased, whereas ferritin levels decreased significantly. Results shown are representative of four independent experiments. (C) mRNA levels of IRP2, TfR1 (transferrin receptor 1) IRP1, and FPN. (D) Xanthine oxidase activity assay in the RNAi-treated cells compared with the untreated wild-type and negative control cells. (E) Lactate dehydrogenase activity assay in the RNAi-treated cells compared with the untreated wild-type and negative control cells.
3.2. Iron responsive element-binding activities of both IRP1 and IRP2 are activated by FDX1 deficiency
Both mitochondrial and cytosolic aconitase (IRP1) contain a [4Fe– 4S] cluster, and complete disassembly of the Fe–S cluster in cytosolic aconitase (c-aconitase) converts IRP1 to its RNA-binding form [14]. Therefore, measuring the IRE-binding activity of IRP1 also indicates the status of the Fe–S cluster status of IRP1. To examine whether impairment of Fe–S cluster biogenesis affected IRE-binding activity, we prepared a [a-32P]CTP-labeled IRE of ferritin mRNA probe and employed it in an IRP electrophoretic mobility shift assay in which extracts of FDX1-depleted HeLa cells were incubated with the IRE probe. Though aconitase activities were not visibly strongly affected after two transfections, we observed activation of IRE-binding activity of IRP1 and IRP2 on gel-shift studies, consistent with cytosolic iron depletion that is a frequent response to compromised iron–sulfur cluster assembly (Fig. 1D) [13]. Since most of IRP1 is in the c-aconitase form in normal cells, it can be difficult to discern a loss of cytosolic aconitase activity, whereas an increase in IRE-binding activity can be more easily appreciated since the initial background activity is low [14].
3.3. Effects of FDX1 depletion on cellular iron homeostasis
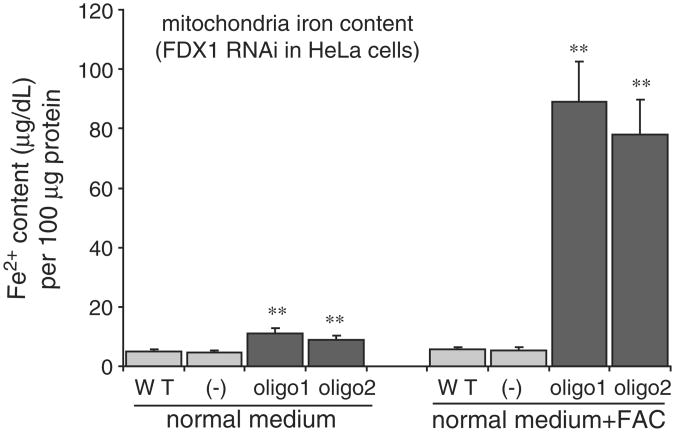
To further characterize the response of HeLa cells to loss of FDX1, we used our newly created oligos 1 and 2 to deplete FDX1, and we measured mitochondrial iron concentrations from cells grown in normal medium or in medium supplemented with iron. We observed statistically significant increases in mitochondrial iron levels after fractionation of FDX1 depleted cells, and levels increased 30-fold in cells grown in iron-supplemented medium (Fig. 2). Subcellular fractions were prepared as previously described [13] and verified by the western blot of mitochondria and cytosolic protein marker (data not shown). We also observed punctate accumulations of ferric iron in cells after knockdown (data not shown).
Fig. 2.
Depletion of FDX1 results in iron accumulation within mitochondria. After fractionation, the iron contents were determined (described in Materials and methods), and are displayed in the unit of μg/dl [Fe2+]. Data represent the mean ± SE (n=3). Analysis of variance (ANOVA) was used for the statistical analysis, with P-value <0.05 considered to be significant. The results shown are representative of data from three independent experiments that displayed similar results. Statistical analyses of the data from these three experiments showed that there was no significant difference between wild-type and negative control, since the mitochondrial iron contents were 4.9 ± 0.02 and 4.8 ± 0.03 under the normal medium culture condition, whereas, mitochondrial iron contents were 5.52 ± 0.01 and 5.48 ± 0.02 when cells were grown in FAC-supplemented medium. However, the mitochondrial iron contents were 11.04 ± 0.02 for oligo1-treated cells, 9.08 ± 0.03 for oligo2-treated cells under the conditions of normal medium culture, and with FAC supplementation, the mitochondrial iron contents were 89.17 ± 0.49 for oligo1-treated cells and 78.15±0.62 for oligo2-treated cells. These values are significantly different (P<0.05) from those of RNAi oligo control-treated cells, as calculated by ANOVA followed by two-tail Dunett's test.
3.4. FDX1 depletion affected the activities of both mitochondrial and cytosolicFe/S proteins, but did not affect the non-Fe–S containing proteins
To more completely assess the effects of FDX1 siRNA on iron– sulfur proteins, four newly designed FDX1 siRNA oligos (including the two oligos we used in experiments in Fig. 1) were used for comparison. We performed three or four successive transfections to achieve greater loss of FDX1, and then performed the in-gel aconitase activity assay. We found marked loss of mitochondrial and aconitase activities using each of four new oligos (Fig. 3A). We then chose to pursue further studies with the two oligos that showed the highest silencing efficacy. Western blot showed the FDX1 protein levels were reduced to less than 20% after four successive transfections of siRNA oligo-treated HeLa cells compared with wild-type and negative control HeLa cells (Fig. 3B), and we also found substantial increases in IRP2 in western blots, consistent with stabilization of IRP2 by low cytosolic iron levels. We also found increased TfR1 and decreased ferritin (FTN), as expected when IRE-binding activity increases (Fig. 3B) [14]. As expected, our data showed that FDX1 levels were reduced by siRNA treatments, at both protein and mRNA levels, (Fig. 3B and C). Increased TfR1 mRNA levels were expected, since IRP binding stabilizes the TfR1 mRNA. Activity of xanthine oxidase, a cytosolic FeS protein, which contains several [2Fe–2S] clusters [15], was markedly diminished by FDX1 siRNA treatment (Fig. 3D), whereas ferroportin levels did not change, and the control enzyme, lactate dehydrogenase, a non-FeS cytosolic enzyme, was unaffected (Fig. 3E).
3.5. Complex I activity is inactivated upon FDX1 depletion
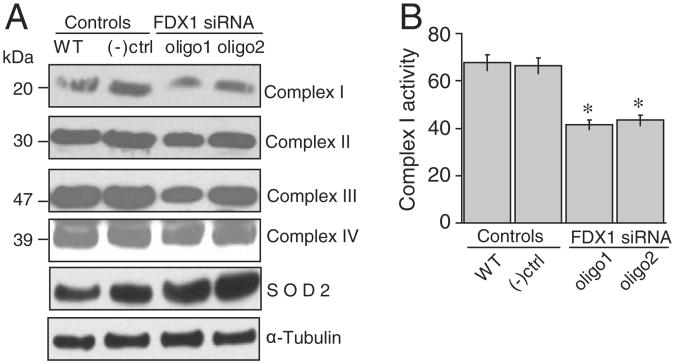
To assess the impact of the abnormal iron homeostasis and compromised iron–sulfur protein status, we performed western blots on multiple mitochondrial proteins and discovered that protein levels of complexes I–IV were slightly decreased, whereas mitochondrial superoxide dismutase, SOD2, was significantly increased (Fig. 4A). We have previously observed increased SOD2 in response to mitochondrial iron overload [17], and we hypothesize that oxidative stress caused by mitochondrial iron overload drives the increased expression of SOD2 in cells treated with FDX1 siRNA. We also found that complex Iactivity was significantly reduced (Fig. 4B), consistent with its dependence on eight iron–sulfur clusters for function [10].
Fig. 4.
FDX1 depletion diminished complex I activity and induced expression of the mitochondrial superoxide dismutase. (A) Amounts of complexes I, II and III and SOD2 were assessed after FDX1 depletion. (B) Complex I enzymatic activity decreased in HeLa cells after the FDX1 depletion. Results represent the average of 3 repeats, and differences were statistically significant (p<0.05).
3.6. Heme deficiency and altered cellular iron homeostasis was caused by FDX1 depletion in erythroblast cells
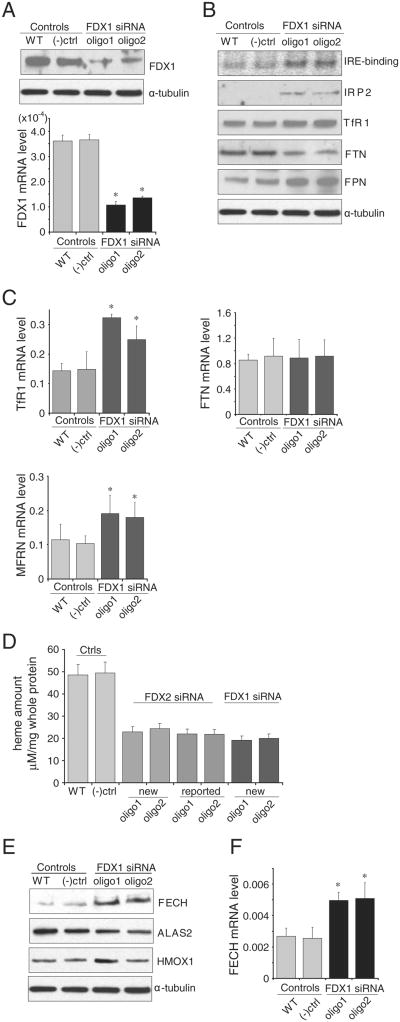
To assess the role of FDX1 in a different more specialized cell type, we performed siRNA studies on the erythroblast cell line, K562. Upon efficient knockdown of FDX1 (Fig. 5A), we observed the expected increases in IRP2 and TfR1. In addition, we observed a marked increase in FPN (Fig. 5B) that may be driven by oxidative stress [17]. We have previously observed that erythroblasts transcribe FPN from a second promoter that generates a transcript that lacks an IRE in its 5′UTR [16–18], and translation of this FPN transcript cannot be repressed by IRP activation in cells with cytosolic iron depletion. We observed significant increases in mRNA levels of TfR1 and in the mitochondrial iron importer, mitoferrin (MFRN1, also known as SLC25A37) (Fig. 5C). In addition, we observed marked decreases in total heme content, despite increased levels of ferrochelatase (FECH) protein and mRNA (Fig. 5D, E, F). Interestingly, we noted decreased levels of ALAS2 protein (Fig. 5E), which catalyzes the initial step of heme biosynthesis, and is encoded by a transcript that contains an IRE in its 5′UTR in erythroid cells. Thus, under conditions of iron depletion, ALAS2 expression can be potentially inhibited by activation of IRPs in erythroid cells. We previously suggested that cytosolic iron depletion in erythroid precursors and concomitant repression of ALAS2 translation may account in part for the anemia of a GLRX5 deficient patient [17], and now we have recapitulated that important observation here with our FDX1 knockdown studies. Additionally, increased heme oxygenase 1 (HMOX-1) protein levels were also observed (Fig. 5E), which could also contribute to the decreased heme content. Taken together, these data indicated that in addition to a general function in [Fe–S] synthesis and cellular iron homeostasis, the human FDX1 has an important role in erythropoiesis.
Fig. 5.
FDX1 is essential for heme biosynthesis in the human erythoblast cell line, K562. (A) Both FDX1 protein and mRNA levels were decreased upon FDX1 depletion in K562 cells. (B) Compared with wild-type and negative control K562 cells, FDX1 knock-down led to increased IRP2, TfR1 and FPN protein expression, whereas FTN protein expression levels decreased. (C) At mRNA levels, FDX1 knock-down led to increased expression of TfR1 mRNA, but there was no change of FTN mRNA. MFRN mRNA levels increased. (D) Decreased heme content was detected in FDX1-depleted K562 cells compared with wild-type and negative control K562 cells. (E) Upon FDX1 depletion, FECH and HMOX1 protein levels increased, whereas ALAS2 protein levels decreased. (F) Upon FDX1 depletion, FECH mRNA level increased.
3.7. Ferredoxin reductase (FDXR) is also important for the FeS protein activity and heme biosynthesis
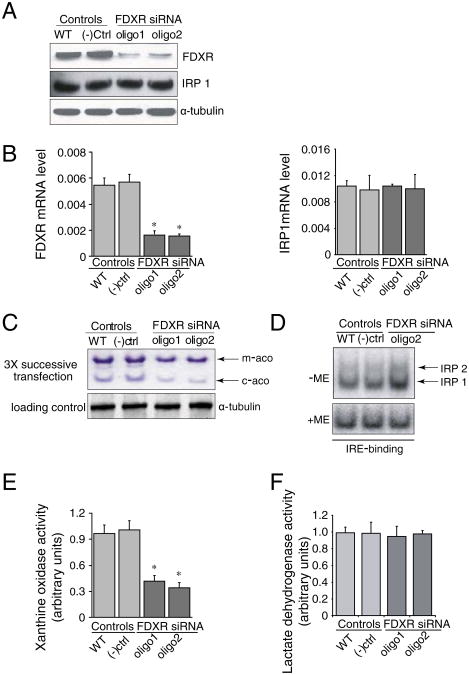
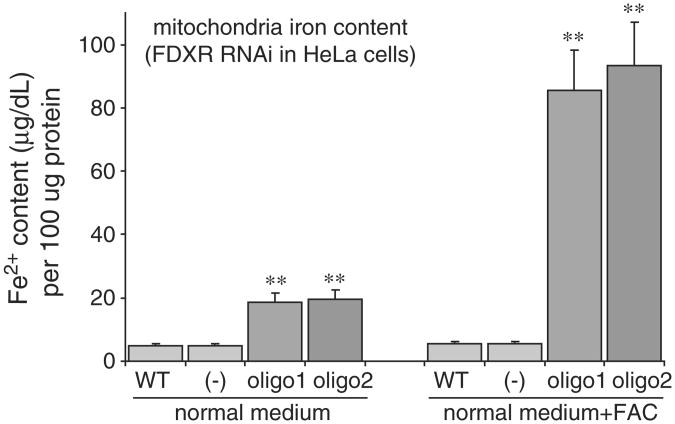
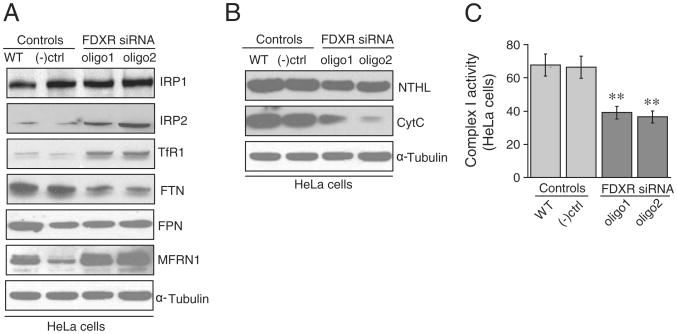
In the human genome, there is a single ferredoxin reductase, FDXR, located at chromosomal position 17q24. Since the two ferredoxins have been shown to play a role in iron sulfur cluster biogenesis, and there is apparently only one ferredoxin reductase, we predicted that knockdown of FDXR would also affect iron–sulfur cluster biogenesis. After three transfections, FDXR expression was decreased at both protein and mRNA levels (Fig. 6A and B) in HeLa cells, and we saw diminished mitochondrial and cytosolic aconitase activities (Fig. 6C). IRE binding activities of IRPs increased (Fig. 6D), and activity of xanthine oxidase decreased (Fig. 6E), whereas activity of the control, non-[Fe–S] enzyme, lactate dehydrogenase, was unaffected (Fig. 6F). To examine whether FDXR knockdown results recapitulated the mitochondrial iron homeostasis problem that we observed in FDX1 knockdowns, we analyzed iron assays of mitochondrial fractions (Fig. 7). To further analyze the general iron homeostasis pattern, we performed western blots and found that IRP2 and TfR1 levels were increased (Fig. 8A), whereas ferritin decreased. In addition, we found an increased expression of MFRN1 (Fig. 8A), indicating that MFRN1 might contribute to mitochondrial iron accumulation, consistent with the iron assays of mitochondrial fractions. We also found reduced levels of the nuclear DNA repair protein, NTHL, which requires an FeS cluster for structural stability, and reduced amounts of the heme protein, cytochrome C (Fig. 8B). Similar to our findings in FDX1 knockdowns, we found reduced Complex I activity (Fig. 8C) in HeLa cells.
Fig. 6.
siRNA treatments of the sole human ferredoxin reductase, FDXR, cause decreased iron–sulfur protein activities and activation of IRPs. Using oligonucleotides, we decreased FDXR protein (6A) and mRNA levels (6B, left). After three successive transfections, activities of m-aco and c-aco were reduced. This experiment is representative of three experimental repeats. IRE binding activities of IRP1 and IRP2 increased on gel-shift assay (6D) and xanthine oxidase activity decreased significantly (6E), whereas lactate dehydrogenase activity did not change (6F).
Fig. 7.
Knockdown of FDXR results in mitochondrial iron overload in HeLa cells. Using oligos 1 or 2, the iron content of mitochondria increased in HeLa cells grown in normal media, and more markedly in iron-supplemented media.
Fig. 8.
FDXR knockdown resulted in cytosolic iron depletion and increased expression of the mitochondrial iron importer, MFRN1. On western blots, we observed increased IRP2 and TfR1, decreased ferritin (FTN), and increased mitoferrin (MFRN1) (8A). On western blot, we also noted decreased NTHL, an iron–sulfur cluster containing endonuclease and decreased cytochrome C, a mitochondrial heme protein (8B). Complex I activity was significantly decreased in FDXR knockdowns (8C).
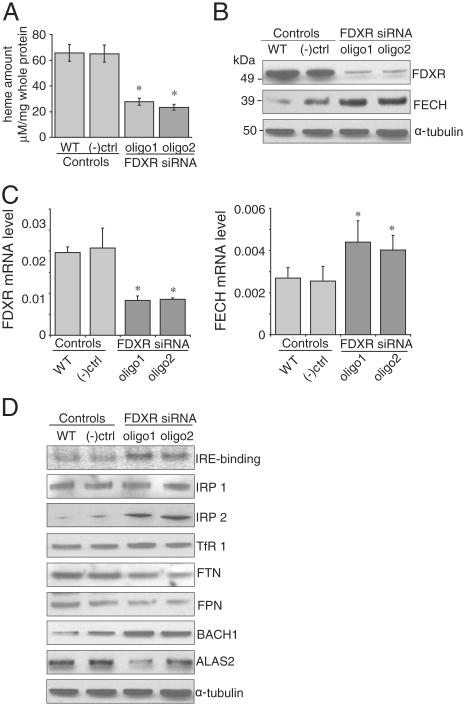
To further pursue our observation about cytochrome C, we performed FDXR knockdowns in K562 cells. Heme levels were markedly reduced (Fig. 9A), whereas ferrochelatase protein and mRNA levels increased (Fig. 9B and C). Interestingly, we observed increased levels of BACH1 protein (Fig. 9D), a heme binding protein that normally works as a repressor of HMOX1.
Fig. 9.
Heme was reduced in FDXR knockdown in HCT116 (K562) cells. Heme levels were significantly reduced (9A), by knockdown of FDXR protein (9B) and mRNA levels (9C), but ferrochelatase mRNA levels were increased (9C). In western blots, IRP2 levels increased, TfR1 increased, but ALAS2 protein levels decreased (9D).
Additionally, we found the expected changes in IRP2, TfR1, and ferritin in western blots and we also found that ALAS2 was reduced (Fig. 9D), consistent with translational repression of ALAS2 by IRPs. Not unexpectedly, the FDXR knockdown in K562 cells was associated with iron misregulation similar to the abnormal regulation observed in the FDX1 knockdown experiments. Since ferrochelatase mRNA and protein levels were increased, the decreased heme levels were more likely attributable to ALAS2 deficiency than to loss of ferrochelatase activity, since the stability of ferrochelatase proteins depends on presence of an intact [2Fe–2S] cluster [22].
4. Discussion
Here, we have used RNAi techniques to evaluate the roles of FDX1, FDX2 and FDXR in human iron sulfur cluster biogenesis. After knockdown, we observed that loss of FDX2 correlated with loss of aconitase activities, in agreement with a recent publication [11]. However, we found that siRNA of FDX1, which did not complement S. cerevisiaie deficient in Yah1, and was previously shown to be dispensable for iron sulfur cluster assembly [11], was clearly important for iron–sulfur protein activities, as judged by aconitase assays of mitochondrial and cytosolic cell fractions and by xanthine oxidase activity assays. Sheftel et al. asserted that only FDX1 was able to catalyze formation of cortisol, whereas FDX2 was not, and we did not assess the role of the two ferredoxins in p450 reactions. However, we disagree with their conclusion that FDX1, which is very highly expressed in the adrenal gland, is dedicated solely to pathways involving p450 enzymes, as we have found significant compromise of iron–sulfur protein activities. Even more impressively, we found that siRNA of FDX1 leads to mitochondrial iron overload and cytosolic iron deficiency, as indicated by mitochondrial iron measurements, and changes in IRE binding activities and expression of target proteins.
Therefore, we suggest that FDX1 and FDX2 represent a duplicated gene pair in which both contribute to iron–sulfur cluster biogenesis. FDX2 is not more highly expressed in the adrenal than in other tissues, and we acknowledge the possibility that FDX1 participates more in p450 reactions. The roles of these two homologues might be distinguished in mouse knockout models. Murine FDX1 is coded as MGI:103224 and there are three commercially available genetrapped or targeted alleles. FDX2 is known as FDX1l in mice, MGI:1915415, and there are nine available trapped alleles. FDXR is known as FDXr MGI:104724, and there are two targeted alleles that are commercially available. Thus, there are some questions that could be pursued using available mouse deletion models.
As might be predicted, we found that the ferredoxin reductase, FDXR, was needed for FeS activities, heme synthesis in K562, and normal regulation of cellular iron homeostasis. Thus far, these results and previous results might predict that the FDX2 knockout would not be lethal, because FDX1 also participates in FeS activities, whereas FDX1 knockouts might have problems with stress responses and mineralocorticoid production. None of the experiments address the question here of how the p450 enzymes of the endoplasmic reticulum acquire their electrons. Both FDX1 and FDX2 appear to be targeted to mitochondria [11], but the cytochrome p450 enzymes of the endoplasmic reticulum are enzymatically active in the cytosol, and it is possible that enough ferredoxins are left in the cytosol to fulfill the role of electron donation for the p450s. Alternatively, the p450s of the endoplasmic reticulum may partner with other proteins that can donate reducing equivalents.
[Fe–S] biogenesis and heme biosynthesis are among the most important pathways of cellular iron metabolism, and we have observed that the machineries of both processes are impaired in the FDX1 knock-down cells. We observed that adequate heme synthesis requires FDX1 and FDXR. Heme deficiency could cause a compensatory increase in iron uptake. BACH1 is a heme binding protein that normally works as a repressor of HMOX1, and decreased heme concentrations may enhance nuclear accumulation of BACH1 [19]. The increased mRNA and protein expression of ferrochelatase might represent an attempt to overcome the shortage in heme. It is also possible that ferrochelatase was partially inactivated by superoxide radicals that were generated from the electron transport chain [20].
It also remains unclear which step of iron–sulfur cluster biogenesis requires ferredoxin activity [21], although ferredoxin facilitated the initial formation of the iron–sulfur cluster of IscU in an in vitro system [12]. One possible way to better understand the role of the FDX–FDXR proteins in mammalian systems would be to perform two-hybrid screens for FDX1, FDX2 and FDXR. Since many of the steps FeS biogenesis have been identified, it might be possible to integrate the FDX–FDXR contribution by into the FeS biosynthesis scheme by identifying protein binding partners.
Supplementary Material
Supplementary data to this article can be found online at doi:10.1016/j.bbamcr.2011.11.002.
Acknowledgments
We thank Dr. Harry Dailey for the ferrochelatase antibody, Dr. Barry Paw for the mitoferrin antibody, Dr. Esther G. Meyron-Holtz for L-ferritin antibody and the members of the Rouault lab for helpful discussions. This work was supported by the intramural program of the Eunice Kennedy Shriver National Institute of Child Health and Human Development.
Footnotes
Conflict of interest statement: We declare no conflicts of interest.
References
- 1.Ewen KM, Kleser M, Bernhardt R. Adrenodoxin: the archetype of vertebratetype [2Fe–2S] cluster ferredoxins. Biochim Biophys Acta. 2011;1814:111–125. doi: 10.1016/j.bbapap.2010.06.003. [DOI] [PubMed] [Google Scholar]
- 2.Vickery LE. Molecular recognition and electron transfer in mitochondrial steroid hydroxylase systems. Steroids. 1997;62:124–127. doi: 10.1016/s0039-128x(96)00170-5. [DOI] [PubMed] [Google Scholar]
- 3.Zheng L, Cash VL, Flint DH, Dean DR. Assembly of iron–sulfur clusters. Identification of an iscSUA-hscBA-FDX gene cluster from Azotobacter vinelandii. J Biol Chem. 1998;273:13264–13272. doi: 10.1074/jbc.273.21.13264. [DOI] [PubMed] [Google Scholar]
- 4.Jung YS, Gao-Sheridan HS, Christiansen J, Dean DR, Burgess BK. Purification and biophysical characterization of a new [2Fe–2S] ferredoxin from Azotobacter vinelandii, a putative [Fe–S] cluster assembly/repair protein. J Biol Chem. 1999;274:32402–32410. doi: 10.1074/jbc.274.45.32402. [DOI] [PubMed] [Google Scholar]
- 5.Tokumoto U, Takahashi Y. Genetic analysis of the isc operon in Escherichia coli involved in the biogenesis of cellular iron–sulfur proteins. J Biochem. 2001;130:63–71. doi: 10.1093/oxfordjournals.jbchem.a002963. [DOI] [PubMed] [Google Scholar]
- 6.Barros MH, Nobrega FG. YAH1 of Saccharomyces cerevisiae: a new essential gene that codes for a protein homologous to human adrenodoxin. Gene. 1999;233:197–203. doi: 10.1016/s0378-1119(99)00137-7. [DOI] [PubMed] [Google Scholar]
- 7.Manzella L, Barros MH, Nobrega FG. ARH1 of Saccharomyces cerevisiae: a new essential gene that codes for a protein homologous to the human adrenodoxin reductase. Yeast. 1998;14:839–846. doi: 10.1002/(SICI)1097-0061(19980630)14:9<839::AID-YEA283>3.0.CO;2-A. [DOI] [PubMed] [Google Scholar]
- 8.Lange H, Kaut A, Kispal G, Lill R. A mitochondrial ferredoxin is essential for biogenesis of cellular iron–sulfur proteins. Proc Natl Acad Sci U S A. 2000;97:1050–1055. doi: 10.1073/pnas.97.3.1050. [DOI] [PMC free article] [PubMed] [Google Scholar]
- 9.Li J, Saxena S, Pain D, Dancis A. Adrenodoxin reductase homolog (Arh1p) of yeast mitochondria required for iron homeostasis. J Biol Chem. 2001;276:1503–1509. doi: 10.1074/jbc.M007198200. [DOI] [PubMed] [Google Scholar]
- 10.Rouault TA, Tong WH. Iron–sulfur cluster biogenesis and human disease. Trends Genet. 2008;24:398–407. doi: 10.1016/j.tig.2008.05.008. [DOI] [PMC free article] [PubMed] [Google Scholar]
- 11.Sheftel AD, Stehling O, Pierik AJ, Elsasser HP, Muhlenhoff U, Webert H, Hobler A, Hannemann F, Bernhardt R, Lill R. Humans possess two mitochondrial ferredoxins, FDX1 and FDX2, with distinct roles insteroidogenesis, heme, and Fe/S cluster biosynthesis. Proc Natl Acad Sci U S A. 2010;107:11775–11780. doi: 10.1073/pnas.1004250107. [DOI] [PMC free article] [PubMed] [Google Scholar]
- 12.Chandramouli K, Unciuleac MC, Naik S, Dean DR, Huynh BH, Johnson MK. Formation and properties of [4Fe–4S] clusters on the IscU scaffold protein. Biochemistry. 2007;46:6804–6811. doi: 10.1021/bi6026659. [DOI] [PubMed] [Google Scholar]
- 13.Shi Y, Ghosh MC, Tong WH, Rouault TA. Human ISD11 is essential for both iron–sulfur cluster assembly and maintenance of normal cellular iron homeostasis. Hum Mol Genet. 2009;18:3014–3025. doi: 10.1093/hmg/ddp239. [DOI] [PMC free article] [PubMed] [Google Scholar]
- 14.Rouault TA. The role of iron regulatory proteins in mammalian iron homeostasis and disease. Nat Chem Biol. 2006;2:406–414. doi: 10.1038/nchembio807. [DOI] [PubMed] [Google Scholar]
- 15.Nishino T, Okamoto K. The role of the [2Fe–2s] cluster centers in xanthine oxido-reductase. J Inorg Biochem. 2000;82:43–49. doi: 10.1016/s0162-0134(00)00165-3. [DOI] [PubMed] [Google Scholar]
- 16.Zhang DL, Hughes RM, Ollivierre-Wilson H, Ghosh MC, Rouault TA. A ferroportin transcript that lacks an iron-responsive element enables duodenal and erythroid precursor cells to evade translational repression. Cell Metab. 2009;9:461–473. doi: 10.1016/j.cmet.2009.03.006. [DOI] [PMC free article] [PubMed] [Google Scholar]
- 17.Ye H, Jeong SY, Ghosh MC, Kovtunovych G, Silvestri L, Ortillo D, Uchida N, Tisdale J, Camaschella C, Rouault TA. Glutaredoxin 5 deficiency causes sideroblastic anemia by specifically impairing heme biosynthesis and depleting cytosolic iron in human erythroblasts. J Clin Invest. 2010;120:1749–1761. doi: 10.1172/JCI40372. [DOI] [PMC free article] [PubMed] [Google Scholar]
- 18.Ye H, Rouault TA. Erythropoiesis and iron sulfur cluster biogenesis. Adv Hematol. 2010 doi: 10.1155/2010/329394. Article ID 329394, 8 p. [DOI] [PMC free article] [PubMed] [Google Scholar]
- 19.Mense SM, Zhang L. Heme: a versatile signaling molecule controlling the activities of diverse regulators ranging from transcription factors to MAP kinases. Cell Res. 2006;16:681–692. doi: 10.1038/sj.cr.7310086. [DOI] [PubMed] [Google Scholar]
- 20.Atamna H, Killilea DW, Killilea AN, Ames BN. Heme deficiency may be a factor in the mitochondrial and neuronal decay of aging. Proc Natl Acad Sci USA. 2002;99:14807–14812. doi: 10.1073/pnas.192585799. [DOI] [PMC free article] [PubMed] [Google Scholar]
- 21.Sheftel A, Stehling O, Lill R. Iron–sulfur proteins in health and disease. Trends Endocrinol Metab. 2010;21:302–314. doi: 10.1016/j.tem.2009.12.006. [DOI] [PubMed] [Google Scholar]
- 22.Crooks DR, Ghosh MC, Haller RG, Tong WH, Rouault TA. Posttranslational stability of the heme biosynthetic enzyme ferrochelatase is dependent on iron availability and intact iron–sulfur cluster assembly machinery. Blood. 2010;115:860–869. doi: 10.1182/blood-2009-09-243105. [DOI] [PMC free article] [PubMed] [Google Scholar]
Associated Data
This section collects any data citations, data availability statements, or supplementary materials included in this article.
Supplementary Materials
Supplementary data to this article can be found online at doi:10.1016/j.bbamcr.2011.11.002.


