

Abstract
The vibrational Stark effect provides insight into the roles of hydrogen bonding, electrostatics, and conformational motions in enzyme catalysis. In a recent application of this approach to the enzyme ketosteroid isomerase (KSI), thiocyanate probes were introduced in site-specific positions throughout the active site. This paper implements a quantum mechanical/molecular mechanical (QM/MM) approach for calculating the vibrational shifts of nitrile (CN) probes in proteins. This methodology is shown to reproduce the experimentally measured vibrational shifts upon binding of the intermediate analog equilinen to KSI for two different nitrile probe positions. Analysis of the molecular dynamics simulations provides atomistic insight into the roles that key residues play in determining the electrostatic environment and hydrogen-bonding interactions experienced by the nitrile probe. For the M116C-CN probe, equilinen binding reorients an active site water molecule that is directly hydrogen bonded to the nitrile probe, resulting in a more linear CNH angle and increasing the CN frequency upon binding. For the F86C-CN probe, equilinen binding orients the Asp103 residue, decreasing the hydrogen-bonding distance between the Asp103 backbone and the nitrile probe and slightly increasing the CN frequency. This QM/MM methodology is applicable to a wide range of biological systems and has the potential to assist in the elucidation of the fundamental principles underlying enzyme catalysis.
I. Introduction
Understanding the fundamental principles that govern enzyme catalysis is important for the development of effective molecular catalysts and inhibitors, as well as for protein engineering and drug design. Hydrogen bonding, electrostatics, and conformational motions have all been proposed to play key roles in enzyme catalysis.1 Although a wide variety of experimental and computational tools have been used to analyze the roles of these factors, the direct probing of changes in the hydrogen-bonding interactions and electrostatic environment during catalysis is challenging. The vibrational Stark effect is a powerful tool for examining these aspects of enzymatic systems. In a recent application of this approach to Δ5-3-ketosteroid isomerase (KSI), thiocyanate (~SCN) probes were introduced in site-specific positions throughout the active site of the enzyme.2–6 As illustrated in Figure 1, the CN vibrational frequency is sensitive to the local electrostatic environment, and changes in this frequency reflect the varying electric fields caused by perturbations such as ligand binding, photoexcitation of a ligand, and residue ionization.
Figure 1.
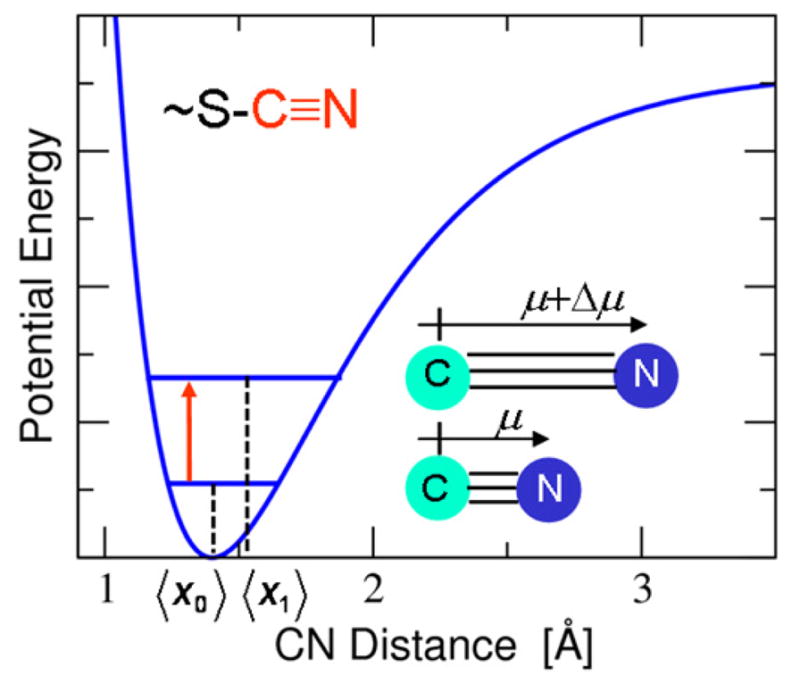
Schematic diagram of the one-dimensional potential energy curve as a function of the CN bond length and the corresponding ground and first excited vibrational state energy levels. The anharmonicity of this curve leads to different average CN bond lengths, where 〈x1〉 > 〈x0〉, and therefore different dipole moments, where 〈μ〉 > 0, associated with these two vibrational states. As a result, the CN vibrational frequency, indicated by the red arrow, is sensitive to the local electrostatic field, leading to the vibrational Stark effect. This figure was inspired by and modeled after Figure S1 in Ref. 6.
The enzyme KSI catalyzes the migration of a double bond in steroids such as 5-androstene-3,17-dione (5-AND) through a two-step general acid-base mechanism. This enzyme has been studied with a wide range of theoretical and experimental methods.7–28 According to the proposed mechanism, Asp40 abstracts a proton from the steroid C4 position to form a dienolate intermediate in the first step, and a proton is transferred from Asp40 to the steroid C6 position in the second step. The dienolate intermediate is thought to be stabilized by hydrogen-bonding interactions with Tyr16 and Asp103. Equilenin (EQU) is an intermediate analog that has been proposed to mimic the electrostatic effects of the dienolate intermediate associated with the 5-AND substrate. Figure 2 depicts the structure of both EQU and the dienolate intermediate. Experimental evidence suggests that EQU may be bound to D40N KSI in both the anionic and neutral forms, with approximately 50% of the population bound in each form.19
Figure 2.

Comparison of chemical structures of the intermediate dienolate form of the 5-AND steroid substrate and the intermediate analog EQU.
To investigate the electrostatic environment of the KSI active site, Boxer, Herschlag, and coworkers introduced thiocyanate probes into site-specific locations within a cysteine-free variant of D40N Pseudomonas putida KSI (pKSI).2 The probe was introduced by mutating a specific residue to cysteine and converting the Cys to Cys-CN, where the CN group replaces the thiol hydrogen of the cysteine residue. This modification was shown to be only minimally perturbative to ligand binding and catalysis.3 The two systems that will be studied in the present paper are the M116C-CN and F86C-CN variants of the cysteine-free, D40N mutant of pKSI, as depicted in Figure 3 with bound EQU. In the M116C-CN system, as shown in Figure 3A, the nitrile group is hydrogen bonded to an active site water molecule and is ~4.5 Å from the EQU oxygen. In the F86C-CN system, as shown in Figure 3B, the nitrile group participates in a bifurcated hydrogen bond involving the backbone atoms of Asp103 and Met84 and is ~5.1 Å from the EQU oxygen.
Figure 3.

Representative snapshots from MD simulations of D40N KSI with bound EQU in its anionic form for the (A) M116C-CN and (B) F86C-CN systems. The residues that are included in the QM region for the QM/MM calculations of the vibrational shifts and line shapes are depicted with thicker lines.
To investigate the effects of ligand binding and solvent exclusion, Boxer, Herschlag, and coworkers measured the vibrational shift of the nitrile group upon binding of a series of ligands to the M116C-CN system.3 Upon binding of the intermediate analog EQU, as well as two other intermediate analogs that lack the distal steroid rings of EQU, they observed a blue shift in the FTIR peak of ~3 cm−1. In contrast, upon binding of the product analog 19-nortestosterone, they observed a much smaller peak shift of 0.4 cm−1. The authors concluded that the localized negative charge on the oxygen of the intermediate analogs (see Figure 2) significantly alters the local electric field, resulting in a shift in the vibrational stretching frequency of the nitrile probe. Solvent exclusion and replacement by hydrophobic steroid rings were found to exert negligible effects on the electrostatic environment in this case. In a subsequent paper, the authors presented a method for decomposing the shifts in the IR spectra into purely local electrostatic and specific hydrogen-bonding effects.4 More recent work analyzed the vibrational shifts for several other probe positions, including the F86C-CN variant, to provide a more complete picture of the heterogeneous and anisotropic electrostatic environment in KSI.5,6
In this paper, we present an approach for calculating the IR spectra of nitrile groups incorporated in proteins and use this methodology to study the shifts in the IR spectra for nitrile probes in the active site of KSI upon EQU binding. Our calculations do not distinguish between classical vibrational Stark effects, where the changes in vibrational frequency arise only from classical electrostatics and are linearly related to changes in the local electrostatic field, and specific interactions between the nitrile probe and proximal hydrogen bond donors. This approach is based on previous simulations of the vibrational frequencies,29–31 and specifically the vibrational Stark effect,32,33 for small molecules in solution. Note that a related approach has been used to study the vibrational frequency shift and energy relaxation of the azide ligand in carbonic anhydrase.34 In our implementation, classical molecular dynamics (MD) simulations of the protein with the CN probe are performed, and mixed quantum mechanical/molecular mechanical (QM/MM) calculations are used to calculate the CN vibrational frequency for a large number of configurations. We studied the frequency shift caused by EQU binding for the M116C-CN and F86C-CN probe variants of D40N pKSI. Our calculations provide atomistic details that explain the experimentally observed vibrational shifts of the nitrile probes in KSI. In particular, these calculations provide insight into the changes in the electrostatic environment and hydrogen bonding interactions within the active site caused by intermediate analog binding. They also assist in determining the protonation states of ionizable active site residues. This computational methodology is applicable to a wide range of other biological systems.
An outline of this paper is as follows. In Section II, we present the computational methodology. This section begins with a summary of the overall approach, followed by the details of the classical MD simulations and the QM/MM calculations, including the reparameterization of the PM3 semiempirical method and the determination of the partitioning between the QM and MM regions. The second part of this section describes the calculation of the line shapes using the fluctuating frequency approximation. Section III presents the results of the application of this methodology to KSI with the M116C-CN and F86C-CN probes, focusing on the comparison to experimental data and the atomistic insights provided by the simulations. The concluding remarks are provided in Section IV.
II. Computational Methods
We simulate the IR spectrum for two different thiocyanate probes in KSI using a combination of classical MD simulations and QM/MM energy calculations. The first step of this procedure is to propagate a classical MD trajectory of the solvated protein with the nitrile probe. The second step is to perform QM/MM calculations on the configurations sampled during this MD trajectory to calculate the nitrile stretching frequencies. In our implementation, the QM region is treated with a reparametrized semiempirical method, and the MM region is represented as a collection of classical point charges. The nitrile stretching frequency is calculated by generating the one-dimensional potential energy curve along the CN axis, fitting this potential to a Morse function, and analytically calculating the splitting between the ground and first-excited vibrational states. From these calculated frequencies, the spectral line shapes are computed using the fluctuating frequency approximation.35–38 The details of these calculations are given below.
A. Molecular dynamics simulations
We performed classical MD simulations for the M116C-CN and F86C-CN variants of cysteine-free, D40N pKSI using the GROMACS molecular dynamics package.39 We simulated each of these systems as the free enzyme and with EQU bound to the active site. The protonation states of ionizable residues were chosen based on published experimental data. The free enzyme simulations were performed with Tyr57 deprotonated, as suggested by experimental data in Ref. 6. The EQU-bound enzyme simulations were performed for two different protonation states: (1) the anionic form of EQU and (2) the neutral form of EQU with the Tyr16 residue deprotonated, as suggested by experimental data in Ref. 19.
The initial configurations for each of the MD trajectories were obtained from the recently solved crystal structures that include the nitrile probe.6 The 3OWS and 3OXA crystal structures correspond to the M116C-CN variant with and without the EQU, respectively, and the 3OWU and 3OX9 crystal structures correspond to the F86C-CN variant with and without EQU, respectively. We modeled the enzyme as a monomer with and without bound EQU. All of these crystal structures are missing the N- and C-termini (residues 1 and 131). These amino acids were added using the PROFIX utility.40 The initial protonation states for all titratable residues were determined using the H++ program.41 The H++ methodology predicts that both ionizable tyrosine residues, 16 and 57, would exist in the protonated form. As mentioned above, however, experiments indicate that these residues may be deprotonated,6,16 and we simulated the various proposed protonation states.
For all MD simulations, we used the AMBER99SB42,43 force field as implemented in GROMACS. For non-standard atom types, we used the non-bonded van der Waals parameters for the nitrile carbon and nitrogen from the work of Lindquist and Corcelli,32,33 who used a similar QM/MM strategy to calculate the IR stretching frequencies of acetonitrile in protic and aprotic solvents.10,11 Since Lindquist and Corcelli used a rigid acetonitrile model, we adopted the bond parameters that Oh et al.44 used to study the dynamics and IR stretching frequency of acetonitrile and methylthiocyanate in water. We determined partial atomic charges for the thiocyanate probe, deprotonated tyrosine, and EQU, in both the neutral and anionic forms, using the restrained electrostatic potential (RESP) methodology45 with the HF/6-31G* level of theory as implemented in Gaussian0346 and the AMBER RESP program.47
The enzyme was solvated by TIP3P48 water molecules in a periodically replicated cubic box, ensuring that the edges of the box are at least 9.0 Å from any protein atoms or crystallographic water molecules. We added five sodium ions using the genion utility within GROMACS to neutralize the charge of the system. The bonds involving hydrogen were constrained with the LINCS algorithm.49 In addition, we used a non-bonded van der Waals cutoff of 10 Å, a 1 fs timestep, and the particle mesh Ewald method for long-range electrostatics.50
Our equilibration procedure for preparing each system is as follows. First the solvent molecules and sodium ions were equilibrated for 50 ps at 300 K with the protein and ligand fixed. Then the entire system was optimized using the steepest descent algorithm in GROMACS. Next the system was equilibrated with a simulated annealing procedure in which the temperature was increased to 300 K in increments of 50 K, equilibrating for 50 ps at each temperature. The equilibration procedure was performed at constant NPT with the Nosé-Hoover thermostat51,52 and the Parrinello-Rahman barostat53 with a reference pressure of 1 bar. After the simulated annealing procedure, an additional 1 ns of equilibration was performed.
The simulations used for data collection were performed at 300 K in the canonical (constant NVT) ensemble for at least 1 ns, and configurations were saved every 1 fs for analysis. The time scale for these trajectories does not allow us to study large-scale conformational changes of the enzyme that could occur on a much longer time scale. Starting the equilibration from crystal structures that include the nitrile probe, however, allows us to sample conformational space in the region of the global ground state structure. For each system studied (i.e., probe, ligand, and protonation state), we propagated two independent trajectories. We present the data for only one trajectory, and the results of the second trajectory are provided in Supporting Information. In each case, the maximum and width of the frequency distributions are the same to within 0.6 cm−1 for the two independent trajectories. Moreover, the results were the same to within 0.5 cm−1 when using only the data from each half of the 1 ns trajectory.
B. QM/MM calculation of vibrational frequency
We calculated the CN vibrational frequency with an approach similar to that developed by Lindquist and Corcelli for small molecules in solution.12,13 In this approach, the local nitrile frequency is calculated by mapping the CN stretching potential energy curve onto a Morse potential for which the vibrational energy level spacings can be calculated analytically. As depicted in Figure 1, the Morse potential incorporates the anharmonicity of the stretching mode. For each configuration sampled, a series of QM/MM calculations is performed to determine the nitrile frequency. All atoms except the nitrogen atom are held fixed, and the nitrogen is moved to alter the CN bond from 1.0 to 1.4 Å in increments of 0.05 Å. For each CN distance, a single-point energy calculation is performed for the QM region surrounded by the MM point charges of all other atoms. Corcelli and co-workers included only the acetonitrile solute molecule in their QM region, and all of the solvent molecules were treated as MM point charges. In our implementation, we expand the QM region to include not only the thiocyanate group, but also proximal waters and protein residues. Each of the protein residues included in the QM region is capped at the termini with hydrogen atoms at equilibrium N-H (1.00 Å) and C-H (1.09 Å) bond distances. The determination of our QM region will be discussed below for each of the systems studied.
The accurate calculation of the IR spectrum for a single system requires nearly 10,000,000 electronic structure calculations, thereby limiting the level of theory that can be used to describe the QM region for such studies. For this reason, we follow the procedure of Corcelli and co-workers and utilize the PM3 semiempirical method.54 To enhance the quantitative accuracy of the PM3 method, however, we reparameterized it for this specific type of application. The Corcelli group reparametrized the PM3 method to specifically treat an acetonitrile molecule in water. They optimized the 18 free PM3 parameters for nitrogen, as well as two coupling parameters between the QM and MM regions, to reproduce calculated frequencies at the B3LYP/6-311++G(d,p) level of theory for a single acetonitrile molecule in water. The configurations for these DFT and PM3 calculations were obtained from a classical MD trajectory. This derived parameter set was shown to correctly predict the direction and magnitude (to within ~1 cm−1) of the shift in the vibrational spectra upon transferring acetonitrile, benzonitrile, and p-tolunitrile from water to THF. The transferability of the reparameterized PM3 method to different molecules and solvents motivated us to implement a similar reparameterization scheme in our studies of KSI. Thus, we derived a new set of PM3 parameters that are suitable for studying thiocyanate systems, as described in the next subsection.
1. PM3 reparameterization
We derived a set of PM3 parameters by minimizing the difference in the frequencies calculated with DFT and PM3 for a series of configurations obtained from an MD simulation of methyl thiocyanate (MeSCN) in water. Methyl thiocyanate was chosen as the model system because it is similar to the nitrile probes used in the protein studies but is relatively small and non-specific. The choice of methyl thiocyanate in water was also motivated by experimental investigations by Maienschein-Cline and Londergan studying the vibrational frequency of the nitrile group of methyl thiocyanate in a series of protic and aprotic solvents, including water.55 Future work will focus on determining the roles that classical electrostatics, polarization, and other non-classical effects play in describing the solvatochromic shifts observed in their experiments. The reparameterization procedure and the optimized PM3 parameters are provided in Supporting Information.
To test the accuracy of this reparameterized PM3 potential, we performed calculations on a purely quantum mechanical gas phase model system comprised of MeSCN and a water molecule. The internal coordinates of the MeSCN and water were fixed at the geometries optimized with the extended Amber99SB forcefield and the TIP3P water model, respectively. When the relative coordinates of MeSCN and water in the hydrogen-bonded complex were optimized at the B3LYP/6-311++G(d,p) level of theory, the NH distance was R(N--H) = 2.1 Å and the C≡N—H angle was nearly linear. In Figure 4A, the CN vibrational frequency is calculated using DFT and several different PM3 parameterizations as the CNH angle is decreased from 180° to 90°. The CN vibrational frequency decreases monotonically as this angle is decreased for the DFT calculations and the PM3 calculations with our new parameterizations. Although the frequencies are calculated with a different method, these results are qualitatively consistent with previous theoretical calculations on the hydrogen bonding angular dependence for both acetonitrile-water and MeSCN-water dimers.56 Figure 4B depicts the dependence of the frequencies on the NH distance for the CNH angle of 135°, which was determined to be the most probable angle in the classical MD trajectory of MeSCN in water. The dependencies of the frequencies on the NH distance for CNH angles of 90° and 180° are provided in Figure S2 of Supporting Information.
Figure 4.

Calculated CN frequencies for the gas phase methyl thiocyanate-water dimer treated fully quantum mechanically using the following methods: DFT B3LYP/6-311++G(d,p) (black circles), PM3 with parameters developed for acetonitrile by Corcelli and coworkers33 (red), and PM3 from the present work obtained with no waters (blue), one water (green), and two waters (violet) included in the QM region during the fitting procedure. The CN frequency is calculated as a function of (A) the CNH angle at the equilibrium N--H distance of 2.1 Å and (B) the N--H distance with a CNH angle of 135°. The analogs of Figure 4B with CNH angles of 90° and 180° are provided in Figure S2 of Supporting Information.
In results that are not shown in Figure 4, the original PM3 parameterization dramatically overestimates the absolute nitrile vibrational frequency by more than 100 cm−1 for some geometries, and the frequency increases rather than decreases as the CNH angle is decreased from 180° to 90°. The original PM3 parameters were derived to reproduce geometrical and thermochemical properties of closed-shell molecules, so it is not surprising that these original parameters do not reproduce the physics of the hydrogen-bonding dimer. The PM3 parameters derived by Corcelli and coworkers for acetonitrile in water also overestimate the CN vibrational frequency and lead to the qualitatively incorrect trend in the angular dependence for this model system, as illustrated in Figure 4A. This discrepancy highlights the lack of transferability of these nitrogen PM3 parameters for chemically different probes (i.e., carbon-bound versus sulfur-bound nitrile groups). We emphasize that the PM3 parameters were fit to DFT results for methyl thiocyanate in water and subsequently were found to be transferable to thiocyanate probes in a protein environment. As shown below, the vibrational frequency shifts upon EQU binding to KSI agree well with experimental data for two probe positions without any further adjustment of the parameters. In principle, similar results would be obtained if this level of DFT were used in the QM/MM calculations. Furthermore, the PM3 method could be reparameterized to higher levels of theory such as MP2 and coupled cluster to improve the quantitative accuracy.
As discussed in Supporting Information, we derived three different PM3 parameter sets by including zero, one, or two water molecules in the QM region during the fitting procedure. The results obtained for all three fits are presented in Figure 4. These results indicate that at least one water molecule should be included in the QM region to describe polarization and other non-classical effects from the solvent. The similarity between the fits with one or two water molecules treated quantum mechanically, however, suggests that these effects are local and that treating only one water molecule quantum mechanically is sufficient.
2. QM/MM partitioning
As shown in the previous subsection, accounting for polarization and other non-classical effects from residues that strongly interact with the thiocyanate vibrational probe is important to properly describe the electrostatic environment. To determine which residues should be included in the QM region, we calculated the CN frequencies for a subset of configurations using a series of different QM regions. The benchmark calculations included all of the key active site residues in the QM region, and the frequencies obtained with this large QM region were compared to those obtained with a series of smaller QM regions.
For the M116C-CN probe calculations, we define the active site to include the M116C-CN probe, the tyrosine hydrogen-bonded triad (Tyr16, Tyr57, Tyr32), Asp103, the mutated Asn40, and EQU when it is bound. In the crystal structures containing the M116C-CN probe with and without EQU (3OWS and 3OXA, respectively), a crystallographic water molecule is located in a position conducive to acting as a hydrogen-bond donor with the nitrogen atom of the probe, as illustrated in Figure 3A. Our MD simulations support the persistence of this hydrogen-bonding water in the active site for up to 5 ns. Therefore, we have also included the nearest water molecule to the thiocyanate nitrogen in our definition of the active site.
Table 1 gives the RMSD for the CN frequencies calculated with the indicated QM region compared to the frequencies calculated with the entire active site in the QM region (as defined above). The inclusion of Asn40 in the QM region dramatically reduces the RMSD of the calculated frequencies. This improvement probably arises because the amide group of Asn40 is a hydrogen-bond donor for the active site water molecule and serves to further polarize the hydrogen bond between the water and the nitrile probe. Interestingly, the inclusion of Tyr57 in the QM region does not significantly improve the calculated frequency even though it acts as a hydrogen bond acceptor from the active site water molecule. Additional calculations have also ruled out the necessity of including Tyr16, Tyr32, Asp103, EQU, or additional water molecules in the QM region. Based on these systematic studies, we include the M116C-CN probe, the closest water molecule, and Asn40 in the QM region for this system.
Table 1.
RMSD for the CN frequencies calculated with the indicated QM region compared to the frequencies calculated with the entire active site in the QM region.a
| M116C-CN | ||
|---|---|---|
| QM Residues | RMSD(EQU)b | RMSD(No Ligand)b |
| Probe Only | 4.96 | 5.64 |
| H2O | 3.75 | 5.18 |
| 40/H2O | 0.71 | 0.97 |
| 103/H2O | 3.41 | 5.06 |
| 40/103/H2O | 0.98 | 0.64 |
| 40/57/H2O | 0.79 | 0.94 |
| F86C-CN | ||
| QM Residues | RMSD(EQU)c | RMSD(No Ligand)d |
| Probe Only | 16.14 | 13.05 |
| 84 | 16.20 | 13.07 |
| 103 | 2.55 | 2.15 |
| 84/103 | 0.85 | 0.56 |
RMSD given for a set of 500 configurations in units of cm−1. All calculations include the probe in the QM region.
For the M116C-CN system, the entire active site is defined to include the thiocyanate probe, Tyr16, Tyr32, Asn40, Tyr57, Asp103, the nearest active-site water molecule, and EQU when it is present.
For the F86C-CN system with bound EQU, the entire active site is defined to include the thiocyanate probe, Met84, Asp103, and EQU.
For the F86C-CN system with no ligand in the active site, the entire active site is defined to include the thiocyanate probe, Met84, Asp103, and 2 water molecules.
As illustrated in Figure 3B, the F86C-CN probe is located on the opposite side of the EQU plane from Asn40, and the nitrile moiety is pointed toward the backbone of Asp103. The backbone amide of Asp103 forms a bifurcated hydrogen bond with both the backbone carbonyl group of the Met84 residue and the nitrile probe. For this system with bound EQU, we define the active site to include the F86C-CN probe, as well as Met84, Asp103, and EQU. For the free enzyme, water molecules approach the sulfur atom of the probe but are unable to interact closely with the nitrile of the probe due to the close interaction between the probe and Asp103. We define the active site for the free enzyme (i.e., without bound EQU) to include the F86C-CN probe, Met84, Asp103, and the two water molecules closest to the nitrogen atom of the probe.
As given in Table 1, the calculations that include only the F86C-CN probe in the QM region dramatically underestimate the frequencies calculated with the entire active site. The inclusion of both Asp103 and Met84 in the QM region is shown to be important. For the free enzyme, we found that the frequencies were not significantly influenced by the QM treatment of the two closest water molecules. Inclusion of EQU in the QM region was also determined to be unnecessary. Based on these systematic studies, we include the F86C-CN probe, Met84, and Asp103 in the QM region for further calculations on this system.
C. Calculation of vibrational line shapes
We calculated the IR line shape, I(ω), using the fluctuating frequency approximation formalism.35–38 In this formalism, the IR line shape is calculated with following expression:
| (1) |
where δω(t) = ω(t) − 〈ω〉 is the deviation of the instantaneous frequency ω(t) from the average frequency 〈ω;〉, û(t) is the unit vector along the transition dipole moment, assumed to lie along the CN bond, and the brackets indicate the classical ensemble average. The input quantities to Eq. (1) were calculated from a 1 ns classical MD trajectory with frequencies calculated every 1 fs. Analysis of the time-dependence of the frequencies illustrated that the average frequency remained constant over the 1 ns trajectory, and the line shapes were converged in less than 1 ns. The instantaneous and average frequencies were all calculated with the QM/MM methodology described above.
III. Results
The protonation states of ionizable residues in the active site of KSI have been probed experimentally but are still not determined definitively. Recent experiments suggest that a tyrosine residue in the active site is deprotonated for the D40N mutant form of KSI without bound ligand.6 These experiments suggest that Tyr57 is the most likely tyrosine residue to be deprotonated. Based on these experimental data, the results shown below assume that Tyr57 is deprotonated in the free D40N KSI enzyme. In addition, experimental data suggest that EQU can bind to D40N KSI in both the anionic and neutral forms.19 Specifically, Childs and Boxer fit the absorption spectrum of EQU bound to D40N KSI to a linear combination of protonated and deprotonated solution spectra and determined that the fraction of the protonated (neutral) form of EQU bound to D40N KSI is 46%. More recent studies by Fried and Boxer validate this methodology for determining the relative populations of protonation states by comparison to an alternative method applied to a chemically related fluorinated phenol bound to the D40N mutant of KSI.21
When EQU is bound in the protonated form, either Tyr16 or Asp103 is thought to be deprotonated, and theoretical calculations suggest that the deprotonated residue is most likely Tyr16.27 Based on these experimental data, the results from two sets of calculations with either Tyr16 or EQU deprotonated in the EQU-bound form of the enzyme are given below. The experimentally obtained IR spectra are expected to pertain to a 46/54 weighted average of the spectral peaks from the calculations with deprotonated Tyr16 and deprotonated EQU, respectively.
Figure 5 depicts the calculated vibrational spectra for the M116C-CN KSI system with and without EQU bound in the active site. The peak of the calculated IR spectrum for the free enzyme simulation is located at 2162.1 cm−1 which is in reasonably good agreement with the experimentally measured frequency of 2159.6 cm−1. The absolute difference of 2.5 cm−1 between the calculated and experimental frequencies is most likely due to limitations in the reparameterized PM3 method, as well as the method for generating the one-dimensional potential curve along the CN axis. On the other hand, this peak position is in much better agreement than the results obtained with the original PM3 method, where the peak is ~100 cm−1 higher than the experimental frequency, and the results obtained with the PM3 parameters derived by the Corcelli group for acetonitrile, where the peak occurs at 2222 cm−1. Note that this level of agreement with experiment for the absolute frequencies may be fortuitous in this case. Our objective, however, is to calculate accurate vibrational frequency shifts rather than absolute frequencies. Despite the relatively minor discrepancies in the absolute peak positions, the line widths and the shifts in the peak frequencies upon EQU binding are in excellent agreement with experiment.
Figure 5.

Calculated IR spectra of the CN vibrational stretching frequency for the M116C-CN D40N KSI system with no ligand bound and Tyr57 depronated (solid red line), with EQU bound in its anionic form (solid black line), and with EQU bound in its neutral form and Tyr16 deprotonated (dashed black line).
As described above, the line shapes of the spectra are calculated using the fluctuating frequency approximation. The calculated line widths agree to within 1 cm−1 of the experimentally measured FWHM of 8 cm−1.3 Figure 5 depicts the calculated IR spectra for the free enzyme (red curve) and for the EQU-bound enzyme (black curves) with either deprotonated EQU (solid black) or deprotonated Tyr16 (dashed black). The calculated peak shifts upon EQU binding are 2.0 cm−1 and 3.0 cm−1 for deprotonated EQU and Tyr16, respectively. The experimentally measured peak shift upon EQU binding is 2.8 cm−1 for this system. Based on the experimental data suggesting that the fraction of EQU bound in the protonated form is 46%, the experimental data are expected to correspond to a weighted mixture of deprotonated EQU and Tyr16. A weighted average of the two peak shifts corresponds to a shift of 2.5 cm−1 which is in excellent agreement with the experiments.
An advantage of our methodology is that the simulations provide atomistic insight into the origins of the shift in the IR spectra upon ligand binding. Figure 6 depicts the distribution of the CNH angle between the nitrile probe and the hydrogen-bonded water molecule as determined from the MD simulations. This figure illustrates that the average CNH angle is more linear when EQU is bound to the active site. Moreover, Figure 4A indicates that the CN frequency increases as the CNH angle becomes more linear for a model system comprised of the MeSCN-water dimer. Thus, the binding of EQU serves to reorient the active site water molecule in a manner that results in a more linear CNH angle between the nitrile probe and the water molecule, leading to an increase in the CN frequency.
Figure 6.
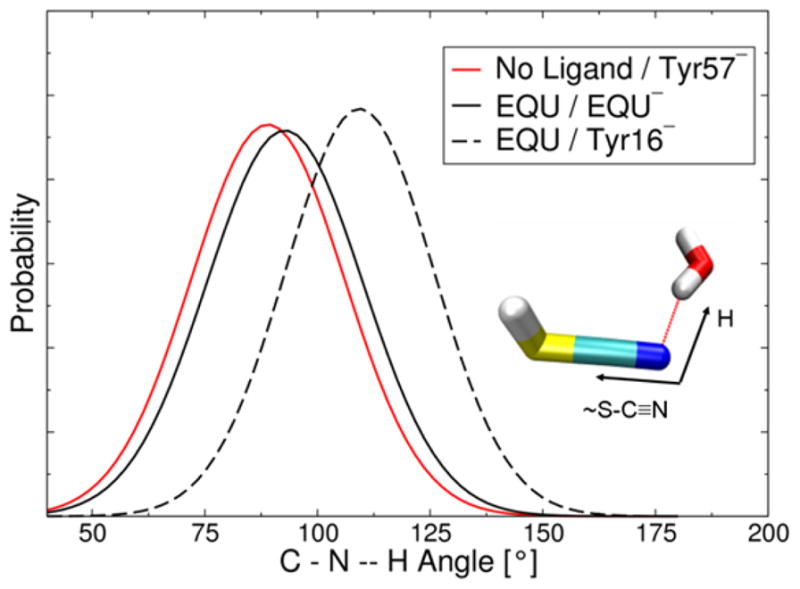
Distribution of the CNH angle between the nitrile probe and the hydrogen-bonded water molecule as determined from the MD simulations of the M116C-CN D40N KSI system with no ligand bound and Tyr57 depronated (solid red line), with EQU bound in its anionic form (solid black line), and with EQU bound in its neutral form and Tyr16 deprotonated (dashed black line).
The angle and frequency shifts are greater when Tyr16 is deprotonated than when EQU is deprotonated, suggesting that the water reorientation is more significant when Tyr16 is deprotonated. Note that EQU or Tyr16 is deprotonated in the EQU-bound calculations, and Tyr57 is deprotonated in the free enzyme calculations. Each of these deprotonated sites (i.e., EQU, Tyr16, or Tyr57) may directly hydrogen bond to the active site water molecule, and Tyr16 hydrogen bonds to Tyr57 and to EQU when it is bound. Our calculations suggest that the position of the active site water molecule with respect to the nitrile probe is different for these three distinct protonation states due to differences in these hydrogen-bonding interactions.
Figure 7 depicts the calculated vibrational spectra for the F86C-CN KSI system with and without EQU bound in the active site. As shown in Figure 3, the probe nitrile group points toward the backbone amide of Asp103, which forms a bifurcated hydrogen bond with the carbonyl group in the backbone of the Met84 residue as well as with the nitrile group of the probe. This orientation leads to a nearly linear CNH angle, which corresponds to an increased CN vibrational frequency (see Figure 4A). As a result, the absolute CN vibrational frequencies are significantly greater for this system than for the M116C-CN system. Moreover, in this case, the peak for the free enzyme is positioned at 2186.8 cm−1, overestimating the experimental frequency of 2165.9 cm−1 by 20.9 cm−1. The greater discrepancy in the absolute frequencies for the F86C-CN probe compared to the M116C-CN probe may arise from limitations in the method of generating the one-dimensional Morse potential curve along the CN axis for the more linear configuration. Recently, the Corcelli group used a discrete variable representation to calculate the vibrational frequencies of phosphate groups and carbon-deuterium bonds.57,58 Another improvement would be to move both the carbon and nitrogen atoms relative to their center of mass for the generation of these one-dimensional potentials. In addition, the PM3 method could be reparameterized using a higher level of theory, such as MP2 or coupled cluster methods. Future investigations will focus on these types of alternative methods that may improve the quantitative accuracy of absolute frequencies. As mentioned above, however, our goal is to calculate accurate vibrational frequency shifts rather than absolute frequencies, and the calculated peak shift upon EQU binding agrees well with experiment for this system as well.
Figure 7.

Calculated IR spectra of the CN vibrational stretching frequency for the F86C-CN D40N KSI system with no ligand bound and Tyr57 depronated (solid red line), with EQU bound in its anionic form (solid black line), and with EQU bound in its neutral form and Tyr16 deprotonated (dashed black line).
Similar to the results for the M116C-CN probe, the calculated shift for the F86C-CN probe upon EQU binding shows a differentiation between the two EQU protonation states studied (i.e., for the deprotonated EQU and Tyr16, corresponding to the solid and dashed black lines, respectively, in Figure 7). The experimentally measured peak shift was 1.8 cm−1, and the calculated peak shifts are 1.0 and 1.7 cm−1 for deprotonated EQU and Tyr16, respectively. The weighted average of the calculated peak shifts based on the experimentally measured relative protonation states is 1.3 cm−1, which is in good agreement with the experimental value. Note that the calculated vibrational shift for the EQU-bound system with deprotonated Tyr16 is in even better agreement with the experimental value, although all of these values are within the expected error for calculations of relative vibrational frequencies.
Analysis of the MD simulations indicates that upon EQU binding, the Asp103 residue forms a consistent hydrogen bond with the EQU oxygen with an average O–O distance of 2.7 Å for the deprotonated EQU case and 2.8 Å for the deprotonated Tyr16 case. This hydrogen bond between EQU and Asp103 limits the mobility of the Asp103 residue and therefore restricts the fluctuations of both the side chain and the backbone. Figure 8 depicts the distribution of the distance between the amide hydrogen of the Asp103 backbone and the nitrogen of the F86C-CN probe as determined from the MD simulations. This figure illustrates that this hydrogen-bonding distance is reduced upon EQU binding. Moreover, Figure 4B illustrates that the CN vibrational frequency increases as the hydrogen-bonding distance between the nitrogen and a hydrogen-bonding partner decreases for the CNH angles sampled by this probe. Further analysis of the MD simulations reveals a concomitant increase in the distance between the Asp103 amide hydrogen and the carbonyl oxygen in the backbone of Met84 upon EQU binding. Thus, the presence of EQU serves to reorient the Asp103 residue in a manner that results in a shorter hydrogen-bonding distance between the Asp103 backbone and the nitrile probe, leading to an increase in the CN frequency.
Figure 8.

Distribution of the distance between the amide hydrogen of the Asp103 backbone and the nitrogen of the F86C-CN probe as determined from the MD simulations of the F86C-CN D40N KSI system with no ligand bound and Tyr57 depronated (solid red line), with EQU bound in its anionic form (solid black line), and with EQU bound in its neutral form and Tyr16 deprotonated (dashed black line).
IV. Conclusions
The vibrational Stark effect is a powerful tool for elucidating the roles of hydrogen bonding, electrostatics, and conformational motions in enzyme catalysis. We have presented a QM/MM approach for calculating the IR spectra associated with thiocyanate probes site-specifically positioned in proteins. This methodology has been shown to reproduce the experimentally measured vibrational shifts upon binding of the intermediate analog equilinen for two different nitrile probe positions in KSI. The calculated line widths of the simulated IR spectra are also in excellent agreement with the experimental data. Further reparameterization of the PM3 method to higher levels of theory and modification of the methodology to generate the one-dimensional potentials along the CN axis and the associated vibrational frequencies may lead to additional improvements. For example, both the carbon and nitrogen atoms could be moved relative to their center of mass, rather than moving only the nitrogen atom, and the discrete variable representation could be used to calculate the frequency for a general potential, rather than fitting to a Morse potential.
Our analysis of the MD simulations provides atomistic insight into the role that key residues play in determining the electrostatic environment and hydrogen-bonding interactions experienced by the nitrile probe. For the M116C-CN probe, EQU binding was found to reorient an active site water molecule that is directly hydrogen bonded to the nitrile probe. This reorientation results in a more linear CNH angle, thereby increasing the CN frequency upon ligand binding. This shift is underestimated when the negative charge is localized on the EQU oxygen and overestimated when the negative charge is localized on Tyr16, which is hydrogen bonded to the EQU oxygen. The weighted average of the shifts for these two protonation states is within 0.3 cm−1 of the experimentally measured shift. These results are consistent with experiments suggesting that the fraction of EQU bound in the protonated form is approximately 50%. Thus, these types of calculations are useful in identifying the protonation states of ionizable residues. For the F86C-CN probe, EQU binding was found to result in a reorientation of the Asp103 residue, decreasing the hydrogen-bonding distance between the Asp103 backbone and the nitrile probe, thereby leading to an increase in the CN frequency. Overall, these simulations were able to identify the changes in the local electrostatic environment and hydrogen-bonding interactions that lead to the observed vibrational shifts of the nitrile probes.
We emphasize that this approach does not differentiate between classical vibrational Stark effects, where the changes in vibrational frequency arise from classical electrostatics and are linearly related to changes in the local electrostatic field, and specific hydrogen-bonding interactions between the nitrile probe and nearby partners. In general, the rigorous separation of these two effects is challenging because hydrogen-bonding interactions contain an electrostatic component. For the two specific systems studied in this paper, the calculations suggest that the vibrational shifts of the nitrile probe upon ligand binding are due mainly to changes in specific hydrogen-bonding interactions. In particular, ligand binding alters the hydrogen-bonding interaction between the nitrile probe and an active site water molecule for the M116C-CN system and between the nitrile probe and the Asp103 backbone for the F86C-CN system. The necessity of including the hydrogen-bonding partner (i.e., the water molecule or the Asp103 residue) in the QM region to ensure convergence of the calculations as well as agreement with the experimental data implies that these hydrogen-bonding interactions are quantum mechanical in nature. Specifically, the accurate description of the hydrogen-bonding interactions and the impact of these interactions on the vibrational frequency requires the inclusion of polarization effects. Future work will focus on developing tools to decompose the effects on the vibrational frequencies into classical electrostatics, polarization, and other non-classical factors.
These types of QM/MM approaches are applicable to a wide range of enzymes and will assist in the elucidation of the fundamental principles underlying enzyme catalysis, specifically the roles of electrostatics, hydrogen bonding, and conformational motions. For this purpose, the vibrational Stark shift can be measured for intermediates along the catalytic reaction pathway for a system such as dihydrofolate reductase (DHFR). Moreover, time-resolved vibrational Stark effect measurements can be used to probe changes in electrostatics and hydrogen bonding during the chemical reaction itself. Often these changes are directly connected to equilibrium conformational motions, typically on the subangstrom length scale, occurring within the ligand and enzyme. In future work, a combination of experimental and computational vibrational Stark effect studies will be used to investigate these key aspects of enzyme catalysis.
Supplementary Material
Acknowledgments
We are grateful for helpful discussions with Phil Hanoian, Steve Boxer, Dan Herschlag, and Ryan Haws. This work was funded by NIH Grant No. GM56207.
Footnotes
Procedure for PM3 reparameterization, optimized PM3 parameters, correlation between DFT and PM3 CN vibrational frequencies, analog of Figure 4B for two different CNH angles, results for a second set of independent trajectories, and coordinates of the dimer used to generate Figure 4. This material is available free of charge via the Internet at http://pubs.acs.org.
References
- 1.Benkovic SJ, Hammes-Schiffer S. Science. 2003;301:1196. doi: 10.1126/science.1085515. [DOI] [PubMed] [Google Scholar]
- 2.Fafarman AT, Webb LJ, Chuang JI, Boxer SG. J Am Chem Soc. 2006;128:13356. doi: 10.1021/ja0650403. [DOI] [PMC free article] [PubMed] [Google Scholar]
- 3.Sigala PA, Fafarman AT, Bogard PE, Boxer SG, Herschlag D. J Am Chem Soc. 2007;129:12104. doi: 10.1021/ja075605a. [DOI] [PMC free article] [PubMed] [Google Scholar]
- 4.Fafarman AT, Sigala PA, Herschlag D, Boxer SG. J Am Chem Soc. 2010;132:12811. doi: 10.1021/ja104573b. [DOI] [PMC free article] [PubMed] [Google Scholar]
- 5.Jha SK, Ji MBA, Gaffney KJ, Boxer SG. Proc Natl Acad Sci USA. 2011;108:16612. doi: 10.1073/pnas.1113874108. [DOI] [PMC free article] [PubMed] [Google Scholar]
- 6.Fafarman AT, Sigala PA, Schwans JP, Fenn TD, Herschlag D, Boxer SG. Proc Natl Acad Sci USA. 2012;109:E299. doi: 10.1073/pnas.1111566109. [DOI] [PMC free article] [PubMed] [Google Scholar]
- 7.Hawkinson DC, Eames TCM, Pollack RM. Biochemistry. 1991;30:10849. doi: 10.1021/bi00109a007. [DOI] [PubMed] [Google Scholar]
- 8.Pollack RM. Bioorg Chem. 2004;32:341. doi: 10.1016/j.bioorg.2004.06.005. [DOI] [PubMed] [Google Scholar]
- 9.Zhao QJ, Abeygunawardana C, Gittis AG, Mildvan AS. Biochemistry. 1997;36:14616. doi: 10.1021/bi971549m. [DOI] [PubMed] [Google Scholar]
- 10.Massiah MA, Abeygunawardana C, Gittis AG, Mildvan AS. Biochemistry. 1998;37:14701. doi: 10.1021/bi981447b. [DOI] [PubMed] [Google Scholar]
- 11.Kim DH, Jang DS, Nam GH, Choi G, Kim JS, Ha NC, Kim MS, Oh BH, Choi KY. Biochemistry. 2000;39:4581. doi: 10.1021/bi992119u. [DOI] [PubMed] [Google Scholar]
- 12.Choi G, Ha NC, Kim MS, Hong BH, Oh BH, Choi KY. Biochemistry. 2001;40:6828. doi: 10.1021/bi002767+. [DOI] [PubMed] [Google Scholar]
- 13.Mazumder D, Kahn K, Bruice TC. J Am Chem Soc. 2003;125:7553. doi: 10.1021/ja030138s. [DOI] [PubMed] [Google Scholar]
- 14.Park H, Merz KM. J Am Chem Soc. 2003;125:901. doi: 10.1021/ja0208097. [DOI] [PubMed] [Google Scholar]
- 15.Kraut DA, McAnaney TB, Boxer S, Herschlag D. Biophys J. 2003;84:169. [Google Scholar]
- 16.Kraut DA, Sigala PA, Pybus B, Liu CW, Ringe D, Petsko GA, Herschlag D. Plos Biology. 2006;4:501. doi: 10.1371/journal.pbio.0040099. [DOI] [PMC free article] [PubMed] [Google Scholar]
- 17.Sigala PA, Caaveiro JMM, Ringe D, Petsko GA, Herschlag D. Biochemistry. 2009;48:6932. doi: 10.1021/bi900713j. [DOI] [PMC free article] [PubMed] [Google Scholar]
- 18.Kraut DA, Sigala PA, Fenn TD, Herschlag D. Proc Natl Acad Sci USA. 2010;107:1960. doi: 10.1073/pnas.0911168107. [DOI] [PMC free article] [PubMed] [Google Scholar]
- 19.Childs W, Boxer SG. Biochemistry. 2010;49:2725. doi: 10.1021/bi100074s. [DOI] [PMC free article] [PubMed] [Google Scholar]
- 20.Childs W, Boxer SG. J Am Chem Soc. 2010;132:6474. doi: 10.1021/ja1007849. [DOI] [PMC free article] [PubMed] [Google Scholar]
- 21.Fried SD, Boxer SG. J Phys Chem B. 2012;116:690. doi: 10.1021/jp210544w. [DOI] [PMC free article] [PubMed] [Google Scholar]
- 22.Warshel A, Sharma PK, Chu ZT, Aqvist J. Biochemistry. 2007;46:1466. doi: 10.1021/bi061752u. [DOI] [PubMed] [Google Scholar]
- 23.Kamerlin SCL, Chu ZT, Warshel A. J Org Chem. 2010;75:6391. doi: 10.1021/jo100651s. [DOI] [PMC free article] [PubMed] [Google Scholar]
- 24.Kamerlin SCL, Sharma PK, Chu ZT, Warshel A. Proc Natl Acad Sci USA. 2010;107:4075. doi: 10.1073/pnas.0914579107. [DOI] [PMC free article] [PubMed] [Google Scholar]
- 25.Chakravorty DK, Soudackov AV, Hammes-Schiffer S. Biochemistry. 2009;48:10608. doi: 10.1021/bi901353v. [DOI] [PMC free article] [PubMed] [Google Scholar]
- 26.Chakravorty DK, Hammes-Schiffer S. J Am Chem Soc. 2010;132:7549. doi: 10.1021/ja102714u. [DOI] [PMC free article] [PubMed] [Google Scholar]
- 27.Hanoian P, Sigala PA, Herschlag D, Hammes-Schiffer S. Biochemistry. 2010;49:10339. doi: 10.1021/bi101428e. [DOI] [PMC free article] [PubMed] [Google Scholar]
- 28.Hanoian P, Hammes-Schiffer S. Biochemistry. 2011;50:6689. doi: 10.1021/bi200703y. [DOI] [PMC free article] [PubMed] [Google Scholar]
- 29.Li SZ, Schmidt JR, Corcelli SA, Lawrence CP, Skinner JL. J Chem Phys. 2006;124:204110. doi: 10.1063/1.2200690. [DOI] [PubMed] [Google Scholar]
- 30.Li SZ, Schmidt JR, Piryatinski A, Lawrence CP, Skinner JL. J Phys Chem B. 2006;110:18933. doi: 10.1021/jp057568k. [DOI] [PubMed] [Google Scholar]
- 31.Li SZ, Schmidt JR, Skinner JL. J Chem Phys. 2006;125:244507. doi: 10.1063/1.2408421. [DOI] [PubMed] [Google Scholar]
- 32.Lindquist BA, Corcelli SA. J Phys Chem B. 2008;112:6301. doi: 10.1021/jp802039e. [DOI] [PubMed] [Google Scholar]
- 33.Lindquist BA, Haws RT, Corcelli SA. J Phys Chem B. 2008;112:13991. doi: 10.1021/jp804900u. [DOI] [PubMed] [Google Scholar]
- 34.Garcia-Viloca M, Nam K, Alhambra C, Gao JL. J Phys Chem B. 2004;108:13501. [Google Scholar]
- 35.Anderson PW. J Phys Soc Jpn. 1954;9:316. [Google Scholar]
- 36.Kubo RJ. J Phys Soc Jpn. 1954;9:935. [Google Scholar]
- 37.Mukamel S. Principles of Nonlinear Optical Spectroscopy. Oxford University Press; New York: 1995. [Google Scholar]
- 38.Schmidt JR, Corcelli SA. J Chem Phys. 2008:128. doi: 10.1063/1.2917349. [DOI] [PubMed] [Google Scholar]
- 39.Hess B, Kutzner C, van der Spoel D, Lindahl E. J Chem Theory Comput. 2008;4:435. doi: 10.1021/ct700301q. [DOI] [PubMed] [Google Scholar]
- 40.Xiang JZ, Honig B. Columbia University and Howard Hughes Medical Institute; New York: 2002. [Google Scholar]
- 41.Gordon JC, Myers JB, Folta T, Shoja V, Heath LS, Onufriev A. Nucleic Acids Res. 2005;33:W368. doi: 10.1093/nar/gki464. [DOI] [PMC free article] [PubMed] [Google Scholar]
- 42.Hornak V, Abel R, Okur A, Strockbine B, Roitberg A, Simmerling C. Proteins-Structure Function and Bioinformatics. 2006;65:712. doi: 10.1002/prot.21123. [DOI] [PMC free article] [PubMed] [Google Scholar]
- 43.Cornell WD, Cieplak P, Bayly CI, Gould IR, Merz KM, Ferguson DM, Spellmeyer DC, Fox T, Caldwell JW, Kollman PA. J Am Chem Soc. 1996;118:2309. [Google Scholar]
- 44.Oh KI, Choi JH, Lee JH, Han JB, Lee H, Cho M. J Chem Phys. 2008;128:154504. doi: 10.1063/1.2904558. [DOI] [PubMed] [Google Scholar]
- 45.Bayly CI, Cieplak P, Cornell WD, Kollman PA. J Phys Chem. 1993;97:10269. [Google Scholar]
- 46.Frisch MJ, Trucks GW, Schlegel HB, Scuseria GE, Robb MA, Cheeseman JR, Montgomery JJA, Vreven T, Kudin KN, Burant JC, Millam JM, Iyengar SS, Tomasi J, Barone V, Mennucci B, Cossi M, Scalmani G, Rega N, Petersson GA, Nakatsuji H, Hada M, Ehara M, Toyota K, Fukuda R, Hasegawa J, Ishida M, Nakajima T, Honda Y, Kitao O, Nakai H, Klene M, Li X, Knox JE, Hratchian HP, Cross JB, Bakken V, Adamo C, Jaramillo J, Gomperts R, Stratmann RE, Yazyev O, Austin AJ, Cammi R, Pomelli C, Ochterski JW, Ayala PY, Morokuma K, Voth GA, Salvador P, Dannenberg JJ, Zakrzewski VG, Dapprich S, Daniels AD, Strain MC, Farkas O, Malick DK, Rabuck AD, Raghavachari K, Foresman JB, Ortiz JV, Cui Q, Baboul AG, Clifford S, Cioslowski J, Stefanov BB, Liu G, Liashenko A, Piskorz P, Komaromi I, Martin RL, Fox DJ, Keith T, Al-Laham MA, Peng CY, Nanayakkara A, Challacombe M, Gill PMW, Johnson B, Chen W, Wong MW, Gonzalez C, Pople JA. Revision C02. Gaussian, Inc; Wallingford, CT: 2004. [Google Scholar]
- 47.Case DA, Darden TA, Cheatham TE, Simmerling ICL, Wang J, Duke RE, Luo R, Walker RC, Zhang W, Merz KM, Roberts BP, Wang B, Hayik S, Roitberg A, Seabra G, Kolossváry I, Wong KF, Paesani F, Vanicek J, Liu J, Wu X, Brozell SR, Steinbrecher T, Gohlke H, Cai Q, Ye X, Wang J, Hsieh M-J, Cui G, Roe DR, Mathews DH, Seetin MG, Sagui C, Babin V, Luchko T, Gusarov S, Kovalenko A, Kollman PA. University of California; San Francisco: 2010. [Google Scholar]
- 48.Jorgensen WL, Chandrasekhar J, Madura JD, Impey RW, Klein ML. J Chem Phys. 1983;79:926. [Google Scholar]
- 49.Hess B. J Chem Theory Comput. 2008;4:116. doi: 10.1021/ct700200b. [DOI] [PubMed] [Google Scholar]
- 50.Darden T, York D, Pedersen L. J Chem Phys. 1993;98:10089. [Google Scholar]
- 51.Nose S. Mol Phys. 1984;52:255. [Google Scholar]
- 52.Hoover WG. Physical Review A. 1985;31:1695. doi: 10.1103/physreva.31.1695. [DOI] [PubMed] [Google Scholar]
- 53.Parrinello M, Rahman A. Phys Rev Lett. 1980;45:1196. [Google Scholar]
- 54.Stewart JJP. J Comput Chem. 1989;10:209. [Google Scholar]
- 55.Maienschein-Cline MG, Londergan CH. J Phys Chem A. 2007;111:10020. doi: 10.1021/jp0761158. [DOI] [PubMed] [Google Scholar]
- 56.Choi JH, Oh KI, Lee H, Lee C, Cho M. J Chem Phys. 2008;128 doi: 10.1063/1.2844787. [DOI] [PubMed] [Google Scholar]
- 57.Miller CS, Corcelli SA. J Phys Chem B. 2009;113:8218. doi: 10.1021/jp903520s. [DOI] [PubMed] [Google Scholar]
- 58.Levinson NM, Bolte EE, Miller CS, Corcelli SA, Boxer SG. J Am Chem Soc. 2011;133:13236. doi: 10.1021/ja2042589. [DOI] [PMC free article] [PubMed] [Google Scholar]
Associated Data
This section collects any data citations, data availability statements, or supplementary materials included in this article.