Abstract
Reference intervals (RI) are the most common decision support tool used for interpretation of numerical laboratory reports. The quality of the RI can play as large a role in result interpretation as the quality of the result itself. As such there is hardly any study examining RI for liver specific biochemical parameters in Indian population especially north Indians having drastically different food habits as compared to rest of the India. So there is a need to establish the RI for north Indian population. Present study was conducted on 2,021 apparently healthy individuals of north Indian origin ranging in age from 15–60 years, were selected randomly using defined criteria. Lipemic, hemolysed, icteric and stored samples were also excluded adopting preanalytical criteria for rejection of sample. Non parametric methodology for determination of RI was adopted as most of the biochemical parameters included revealed non Gaussian distribution. Data were analyzed for middle 95 percentile (2.5th–97.5th percentile), median and 95 % confidence interval using SPSS software package version 10.0. The upper and the lower limit of RI (reported Vs observed) for bilirubin (0–1.2 Vs 0.30–1.30 mg/dL), serum glutamate oxaloacetate transferase (SGOT) (0–41 Vs 13–52.80 IU/L), serum glutamate pyruvate transferase (SGPT) (0–50 Vs 10–68 IU/L) showed wide variation as compared to reported standard RI however Gamma glutamyl transferase (GGT) (0–50 Vs 5.00–50.60 IU/L) remained within the reported standard RI. Further gender wise evaluation revealed higher cutoff in males (AST 14–55, ALT 11–70.35, GGT 6.76–51.09 in IU/L, bilirubin (0.40–1.34 mg/dL) as compared to females (SGOT 13–50.43, SGPT 9–63.43, GGT 3.92–48.70 in IU/L, Bilirubin 0.30–1.20 mg/dL) for both enzymatic and non enzymatic biochemical parameters. The variations may be attributed to dietary pattern smoking and alcoholism.
Keywords: Reference interval, Liver specific biochemical parameter, Observed value, Reported value
Introduction
Reference interval (RI) for biochemical and hematological parameters are used to aid physicians to interpret the results of clinical measurements. They may also be used for setting inclusion/exclusion criteria in clinical trials as well as the basis of safety monitoring for trial participants. In establishing reference values, it is essential that population is well defined and properly selected to be representative of that population, as the lower and upper limits of measurement are known to be more affected by the choice of sample population, standardization of sample collection, handling, analysis and statistical analysis [1, 2].
Reference interval of Indian population are not readily available and the values in use are either borrowed from the textbooks and articles or insert literature from the Kit manufactures which are based on sample population other than Indians. Moreover the upper and lower limit of measurements varies dependent on source of information as well as the methodology followed. Besides, a RI do vary with various factors often not taken into consideration which include race/ethnicity [3, 4], environmental factors, life style factors, metabolic and physiological changes with advancing age and also gender based formal changes.
As such there is hardly any study conducted to examine RI for biochemical parameters in Indian population specially north Indians which have drastically different food habits, life style, exposure to environmental conditions as compared to the population of Southern and Eastern India. So there is a need to establish the RI for a north Indian population.
This study has been conducted to establish RI of reference population which is taken from Jaipur (Rajasthan) and adjoining areas which represents north Indian sample population. The current study is thus conducted so that parameters evaluated in the healthy defined group of individuals would serve as the reference values for the reference population.
Materials and Methods
The present study was conducted in the Department of Biochemistry at S.M.S. Medical College and Associated Group Hospitals, Jaipur. 2,021 apparently healthy individuals of north Indian origin were randomly selected using defined criteria. The candidates were included after obtaining informed consent. Out of 2,021 individuals 494 were excluded using appropriate exclusion criteria defined by IFCC and NCCLS [5]. Finally 1,527 individuals were included in our study. Information regarding age, sex, disease if any, dietary habits, physical activity, smoking or alcoholic habit, anthropometric parameters were obtained in respect to each subject. All the individuals were called personally in the laboratory.
Exclusion criteria for selection of individuals to determine reference values: diseases if any: diabetes, CAD etc. Risk factors: obesity (BMI > 30), hypertension, risks from occupation or environment, genetically determined risks. Intake of pharmacologically active agents: drug treatment for disease or suffering, oral contraceptives, drug abuse, alcohol, tobacco. Specific physiological states: pregnancy, stress, excessive exercise.
After overnight fasting, venous blood was drawn from anticubital vein using aseptic technique. Analysis of samples was done after proper standardization of the instruments with the help of calibrators and controls. Samples which were lipemic, hemolytic or icteric were not considered in the study. Fasting samples were analyzed for liver function parameters using IFCC approved method. Total bilirubin and direct bilirubin were analyzed by Diazo method [6]. Gamma glutamyl transferase (GGT), serum glutamate oxaloacetate transferase (SGOT) and serum glutamate pyruvate transferase (SGPT) methods are an adaptation of recommended procedure of IFCC [7–9]. Alkaline phosphatase (ALP) was estimated by PNPP kinetic method [10], Total protein and albumin by Biuret [11, 12] and Bromocresol green method [13]. All tests were performed on fully autoanalyzer AU–400 by Olympus.
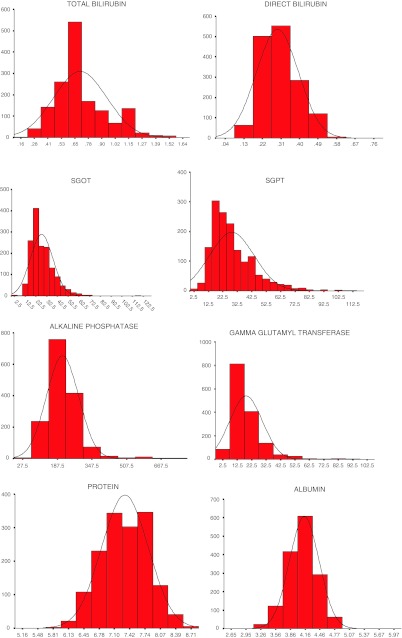
To ensure the reproducibility and repeatability of the test results, the laboratory participated in established external quality assessment programs by CMC, Vellore and BIORAD and a comprehensive internal quality control program and the results were accordingly released after calibrating the values between mean ± 1SD. The quality control check was done every day. In present study, non parametric methodology for determination of RI has been adopted as recommended by IFCC [2] and NCCLS [1] and most of the biochemical parameters included revealed non Gaussian distribution (Fig. 1–8). Median, central 95 percentile and 90 % confidence interval (CI) were calculated. The 97.5 percentile and 2.5 percentile formed the upper and lower reference limits of the population. Statistical analysis was done using SPSS version 10.0 packages [14].
Fig. 1–8.
Distribution curves of liver function test parameters
Results and Discussion
Table 1 depicts median, 95 percentile and 90 % CI of liver function test parameters in north Indian population according to various partitioning criteria.
Table 1.
Reference interval of liver function tests in north Indian population
| Total bilirubin | Direct bilirubin | SGOT | SGPT | ALP | GGT | Protein | Albumin | |||
|---|---|---|---|---|---|---|---|---|---|---|
| Total | Median | 0.70 | 0.30 | 25.00 | 25.00 | 200.00 | 16.00 | 7.30 | 4.10 | |
| 95 Percentile | 2.5 | 0.30 | 0.10 | 13.0 | 10.0 | 107.0 | 5.0 | 6.40 | 3.50 | |
| 97.5 | 1.30 | 0.50 | 52.80 | 68.0 | 361.8 | 50.60 | 8.30 | 4.90 | ||
| 90 % CI | Lower | 0.18–0.42 | 0.06–0.14 | 12.47–13.53 | 9.24–10.76 | 103.28–110.72 | 4.33–5.67 | 6.38–6.42 | 3.36–3.64 | |
| Upper | 1.18–1.42 | 0.46–0.54 | 52.27–53.33 | 67.24–68.76 | 358.08–365.52 | 49.93–51.27 | 8.28–8.32 | 4.86–4.94 | ||
| Male | Median | 0.70 | 0.30 | 26.00 | 28.00 | 210.00 | 17.00 | 7.30 | 4.20 | |
| 95 Percentile | 2.5 | 0.40 | 0.10 | 14.00 | 11.00 | 116.30 | 6.76 | 6.37 | 3.60 | |
| 97.5 | 1.34 | 0.50 | 55.00 | 70.35 | 388.00 | 51.09 | 8.30 | 4.80 | ||
| 90 % CI | Lower | 0.22–0.58 | 0.02–0.18 | 13.29–14.71 | 9.94–12.06 | 111.01–121.59 | 5.80–7.72 | 6.33–6.41 | 3.58–3.62 | |
| Upper | 1.16–1.52 | 0.42–0.58 | 54.29–55.71 | 69.29–71.41 | 382.71–393.29 | 50.13–52.05 | 8.26–8.34 | 4.78–4.82 | ||
| Female | Median | 0.60 | 0.30 | 24.00 | 22.00 | 192.00 | 14.00 | 7.40 | 4.10 | |
| 95 Percentile | 2.5 | 0.30 | 0.10 | 13.00 | 9.00 | 100.58 | 3.92 | 6.50 | 3.40 | |
| 97.5 | 1.20 | 0.50 | 50.43 | 63.43 | 323.00 | 48.70 | 8.30 | 4.60 | ||
| 90 % CI | Lower | 0.12–0.48 | 0.02–0.18 | 12.22–13.78 | 7.92–10.08 | 95.60–105.56 | 3.08–4.76 | 6.46–6.54 | 3.38–3.42 | |
| Upper | 1.02–1.38 | 0.42–0.58 | 49.65–51.21 | 62.35–64.51 | 318.02–327.98 | 47.86–49.54 | 8.26–8.34 | 4.58–4.62 | ||
| Age <20 years | Median | 0.70 | 0.30 | 26.00 | 22.00 | 261.00 | 13.00 | 7.50 | 4.30 | |
| 95 Percentile | 2.5 | 0.40 | 0.10 | 15.00 | 12.00 | 118.00 | 2.30 | 6.50 | 3.80 | |
| 97.5 | 1.50 | 0.50 | 50.00 | 56.00 | 622.00 | 48.43 | 8.20 | 4.70 | ||
| 90 % CI | Lower | 0.34–0.46 | 0.08–0.12 | 13.43–16.57 | 9.92–14.08 | 93.48–142.52 | 0.18–4.42 | 6.42–6.58 | 3.76–3.84 | |
| Upper | 1.44–1.56 | 0.48–0.52 | 48.43–51.57 | 53.92–58.08 | 597.48–646.52 | 49.88–54.12 | 8.16–8.24 | 4.66–4.74 | ||
| Age 20–40 years | Median | 0.70 | 0.30 | 25.00 | 25.00 | 196.00 | 16.00 | 7.40 | 4.20 | |
| 95 Percentile | 2.5 | 0.30 | 0.10 | 13.00 | 9.50 | 103.58 | 6.00 | 6.40 | 3.5 | |
| 97.5 | 1.30 | 0.50 | 52.00 | 71.00 | 328.00 | 52.00 | 8.30 | 4.70 | ||
| 90 % CI | Lower | 0.12-0.48 | 0.02–0.18 | 12.29–13.71 | 8.38–10.62 | 99.01–108.15 | 5.31–6.69 | 6.36–6.44 | 3.48–3.52 | |
| Upper | 1.12–1.48 | 0.42–0.58 | 51.29–52.71 | 69.88–72.12 | 323.43–332.57 | 47.74–49.12 | 8.26–8.34 | 4.68–4.72 | ||
| Age 41–60 years | Median | 0.60 | 0.30 | 26.00 | 25.00 | 202.00 | 17.00 | 7.20 | 4.10 | |
| 95 Percentile | 2.5 | 0.35 | 0.10 | 13.00 | 10.20 | 114.20 | 5.00 | 6.40 | 3.50 | |
| 97.5 | 1.20 | 0.50 | 54.80 | 65.00 | 318.00 | 54.00 | 8.30 | 4.70 | ||
| 90 % CI | Lower | 0.33–0.37 | 0.02–0.18 | 12.10–13.90 | 8.98–11.42 | 109.81–118.59 | 3.61–6.39 | 6.36–6.44 | 3.50–3.54 | |
| Upper | 1.18–1.22 | 0.42–0.58 | 53.90–55.70 | 63.78–66.22 | 313.61–322.39 | 52.61–55.39 | 8.26–8.34 | 4.68–4.72 | ||
| Rural | Median | 0.70 | 0.30 | 26.00 | 23.00 | 197.00 | 14.00 | 7.30 | 4.10 | |
| 95 Percentile | 2.5 | 0.30 | 0.10 | 13.00 | 9.34 | 102.18 | 3.84 | 6.50 | 3.40 | |
| 97.5 | 1.20 | 0.50 | 50.00 | 63.00 | 430.25 | 43.48 | 8.10 | 4.70 | ||
| 90 % CI | Lower | 0.28–0.32 | 0.02–0.18 | 12.12–13.88 | 8.24–10.44 | 95.48–108.88 | 2.57–5.11 | 6.46–6.54 | 3.38–3.42 | |
| Upper | 1.18–1.22 | 0.42–0.58 | 49.12–50.88 | 61.90–64.10 | 423.55–436.95 | 42.21–44.75 | 8.06–8.14 | 4.68–4.72 | ||
| Urban | Median | 0.62 | 0.30 | 25.00 | 26.00 | 205.00 | 17.00 | 7.30 | 4.20 | |
| 95 Percentile | 2.5 | 0.30 | 0.10 | 13.53 | 10.00 | 111.05 | 6.00 | 6.40 | 3.60 | |
| 97.5 | 1.30 | 0.50 | 55.00 | 71.00 | 344.00 | 52.00 | 8.40 | 4.70 | ||
| 90 % CI | Lower | 0.14–0.46 | 0.04–0.16 | 12.86–14.20 | 8.96–11.04 | 106.09–116.01 | 5.27–6.73 | 6.36–6.44 | 3.40–3.80 | |
| Upper | 1.14–1.46 | 0.44–0.56 | 54.33–55.67 | 69.96–72.04 | 339.57–348.43 | 51.27–52.73 | 8.36–8.44 | 4.50–4.90 | ||
| BMI < 25 | Median | 0.70 | 0.30 | 25.00 | 24.00 | 199.00 | 15.00 | 7.30 | 4.20 | |
| 95 Percentile | 2.5 | 0.30 | 0.10 | 13.00 | 10.00 | 104.63 | 5.00 | 6.40 | 3.50 | |
| 97.5 | 1.30 | 0.50 | 52.00 | 66.00 | 388.00 | 50.23 | 8.30 | 4.70 | ||
| 90 % CI | Lower | 0.14–0.46 | 0.04–0.16 | 12.41–13.59 | 9.18–10.82 | 100.30–108.96 | 4.24–5.76 | 6.38–6.42 | 3.32–3.68 | |
| Upper | 1.14–1.46 | 0.44–0.56 | 51.41–52.59 | 65.18–66.82 | 383.67–392.33 | 49.47–50.99 | 8.28–8.32 | 4.52–4.88 | ||
| BMI ≥ 25 | Median | 0.60 | 0.30 | 25.00 | 28.00 | 200.00 | 18.00 | 7.20 | 4.10 | |
| 95 Percentile | 2.5 | 0.30 | 0.10 | 13.80 | 10.00 | 117.90 | 7.00 | 6.36 | 3.60 | |
| 97.5 | 1.30 | 0.50 | 55.40 | 79.00 | 310.60 | 62.36 | 8.24 | 4.60 | ||
| 90 % CI | Lower | 0.28–0.32 | 0.00–0.20 | 12.57–15.03 | 8.06–11.94 | 111.12–124.68 | 5.69–8.31 | 6.30–6.42 | 3.56–3.64 | |
| Upper | 1.14–1.46 | 0.40–0.60 | 54.17–56.63 | 77.06–80.94 | 303.82–317.38 | 61.63–63.09 | 8.18–8.30 | 4.56–4.64 | ||
| Vegetarian | Median | 0.67 | 0.30 | 24.00 | 24.00 | 198.00 | 15.00 | 7.30 | 4.10 | |
| 95 Percentile | 2.5 | 0.30 | 0.10 | 13.00 | 9.50 | 104.00 | 5.00 | 6.44 | 3.50 | |
| 97.5 | 1.30 | 0.50 | 52.58 | 68.00 | 417.75 | 49.15 | 8.30 | 4.90 | ||
| 90 % CI | Lower | 0.14–0.46 | 0.04–0.16 | 12.37–13.63 | 8.60–10.40 | 99.37–108.63 | 4.18–5.82 | 6.42–6.46 | 3.32–3.68 | |
| Upper | 1.14–1.46 | 0.44–0.56 | 51.95–53.21 | 67.10–68.90 | 413.12–422.38 | 48.33–49.97 | 8.28–8.32 | 4.70–5.10 | ||
| Non Vegetarian | Median | 0.70 | 0.30 | 26.00 | 27.00 | 212.00 | 18.00 | 7.30 | 4.20 | |
| 95 Percentile | 2.5 | 0.40 | 0.10 | 13.40 | 10.00 | 112.40 | 7.50 | 6.28 | 3.60 | |
| 97.5 | 1.30 | 0.50 | 53.20 | 67.50 | 344.20 | 52.18 | 8.40 | 4.80 | ||
| 90 % CI | Lower | 0.38–0.42 | 0.00–0.20 | 12.46–14.34 | 8.53–11.47 | 106.36–118.44 | 6.40–8.60 | 6.22–6.34 | 3.58–3.62 | |
| Upper | 1.28–1.32 | 0.40–0.60 | 52.26–54.14 | 66.03–68.97 | 338.16–350.24 | 51.08–53.28 | 8.34–8.46 | 4.78–4.82 | ||
| Smokers | Median | 0.70 | 0.30 | 28.00 | 32.00 | 204.50 | 21.00 | 7.20 | 4.10 | |
| 95 Percentile | 2.5 | 0.40 | 0.10 | 14.00 | 12.00 | 98.00 | 8.80 | 6.40 | 3.60 | |
| 97.5 | 1.20 | 0.50 | 60.00 | 66.00 | 323.00 | 58.00 | 8.40 | 4.80 | ||
| 90 % CI | Lower | 0.36–0.44 | 0.02–0.22 | 12.47–15.53 | 10.26–13.74 | 90.77–105.23 | 7.15–10.45 | 6.34–6.46 | 3.56–3.64 | |
| Upper | 1.16–1.24 | 0.38–0.62 | 59.06–60.94 | 64.53–67.47 | 315.77–330.23 | 56.35–59.65 | 8.34–8.46 | 4.76–4.84 | ||
| Alcoholic | Median | 0.70 | 0.30 | 29.00 | 33.00 | 206.00 | 24.00 | 7.20 | 4.10 | |
| 95 Percentile | 2.5 | 0.39 | 0.20 | 14.00 | 11.00 | 98.85 | 9.00 | 6.39 | 3.60 | |
| 97.5 | 1.30 | 0.50 | 60.00 | 84.00 | 324.65 | 75.80 | 8.23 | 4.80 | ||
| 90 % CI | Lower | 0.37–0.41 | 0.10–0.30 | 12.65–15.35 | 9.45–12.55 | 92.60–105.10 | 7.16–10.84 | 6.33–6.45 | 3.56–3.64 | |
| Upper | 1.28–1.32 | 0.38–0.62 | 59.06–60.94 | 66.53–69.47 | 318.40–330.90 | 64.70–66.90 | 8.17–8.29 | 4.76–4.84 | ||
| Pre Menopause | Median | 0.60 | 0.30 | 24.00 | 20.00 | 180.00 | 13.00 | 7.40 | 4.10 | |
| 95 Percentile | 2.5 | 0.30 | 0.10 | 13.00 | 9.00 | 98.00 | 3.80 | 6.50 | 3.40 | |
| 97.5 | 1.20 | 0.50 | 50.35 | 61.35 | 423.75 | 40.70 | 8.22 | 4.70 | ||
| 90 % CI | Lower | 0.28–0.32 | 0.00–0.20 | 11.94–14.06 | 7.67–10.33 | 90.89–105.11 | 2.80–4.80 | 6.46–6.54 | 3.36–3.44 | |
| Upper | 1.18–1.22 | 0.40–0.60 | 49.29–51.41 | 60.02–62.68 | 416.64–430.86 | 39.70–41.70 | 8.18–8.26 | 4.66–4.74 | ||
| Post Menopause | Median | 0.60 | 0.30 | 25.00 | 24.00 | 208.50 | 15.10 | 7.30 | 4.00 | |
| 95 Percentile | 2.5 | 0.30 | 0.10 | 13.00 | 8.00 | 115.78 | 5.00 | 6.48 | 3.58 | |
| 97.5 | 1.20 | 0.50 | 51.23 | 66.45 | 314.00 | 52.20 | 8.32 | 4.60 | ||
| 90 % CI | Lower | 0.28–0.32 | 0.00–0.22 | 11.84–14.16 | 6.24–9.76 | 109.47–122.09 | 3.59–6.41 | 6.42–6.54 | 3.54–3.62 | |
| Upper | 1.18–1.22 | 0.38–0.62 | 50.07–52.39 | 64.69–68.21 | 307.69–320.31 | 50.79–53.61 | 8.26–8.38 | 4.56–4.64 | ||
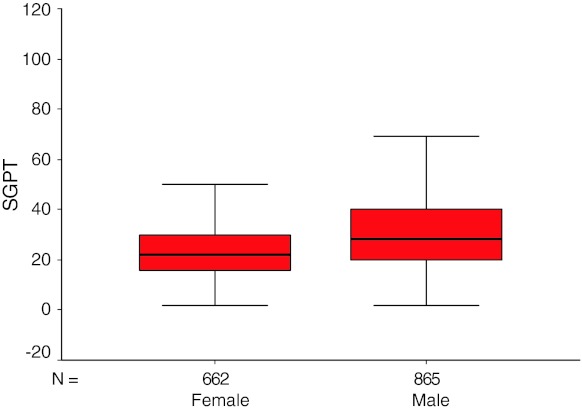
There are limited numbers of studies on RI of tests often used for assessing liver functions. There are several factors which could affect RI, even modern life style changes and dietary habits may alter the RI of liver specific biochemical tests. However impact of these factors have never been related to liver specific parameters as a result of which normal reported RI remain unchanged for the past several years despite the population exposure to these factors. Further, this is reflected as wider range of RI for most of these biochemical parameters examined in this study. The upper and lower limit of RI (reported Vs observed) for bilirubin (0–1.2 Vs 0.30–1.30), SGOT (0–40 Vs 13–52.80), SGPT (0–50 Vs 10–68), ALP (110–310 Vs 107–361.80) showed wide variation as compared to reported standard RI while GGT (0–50 Vs 5.00–50.60) which is related to biliary disease and alcohol intake remained within the reported standard RI. For both enzymatic and non enzymatic biochemical parameters upper cutoff value was greater in males (SGOT 14–55, SGPT 11–70.35 (Fig. 9), GGT 6.76–51.09, bilirubin 0.40–1.34) as compared to females (SGOT 13–50.43, SGPT 9–63.43, GGT 3.92–48.70, bilirubin 0.30–1.20). These findings are consistent to finding of other workers [15–17]. These differences can be correlated to dietary habit, smoking and alcoholism.
Fig. 9.
Comparison between reference interval of SGPT in male and female Indian population
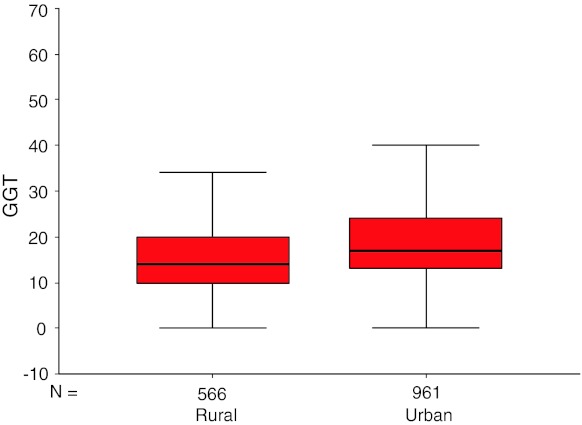
Serum SGOT, SGPT levels had wider RI in urban as compared to rural population. Modern life style perhaps be responsible for changes in liver specific enzyme. Both liver specific enzymatic and non enzymatic parameters have higher cutoff of RI in males as compared to females but the difference is more pronounced in urban males and females as compared to rural males and females. Urban male population showed higher cutoff of RI for bilirubin, SGOT, SGPT as compared to rural males and simultaneously higher cutoff values were observed for ALP and GGT (Fig. 10) in rural population as compared to urban population. Higher cutoff of RI in urban females for all liver specific enzymatic parameters except ALP was observed. No appreciable difference was observed in RI of bilirubin according to rural and urban females.
Fig. 10.
Comparison between reference interval of GGT in rural and urban Indian population
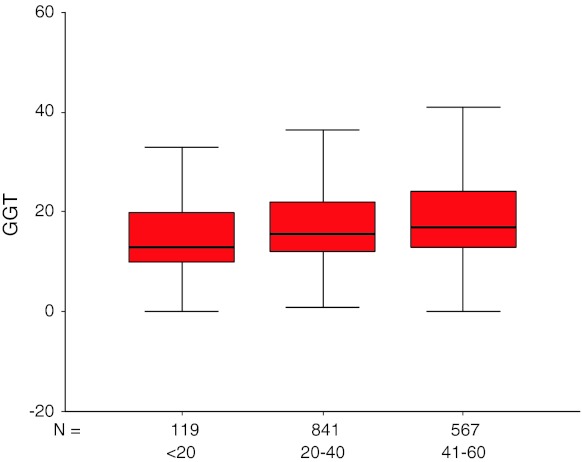
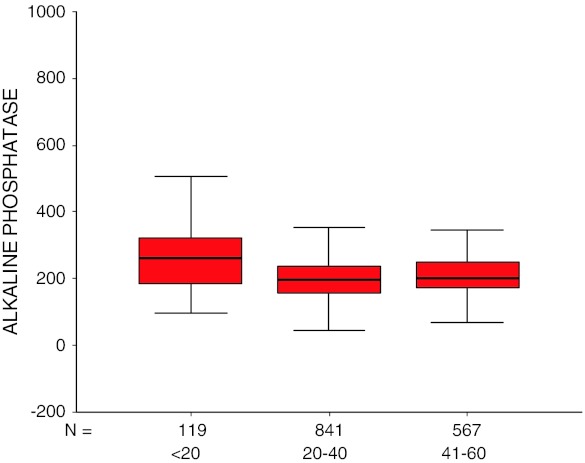
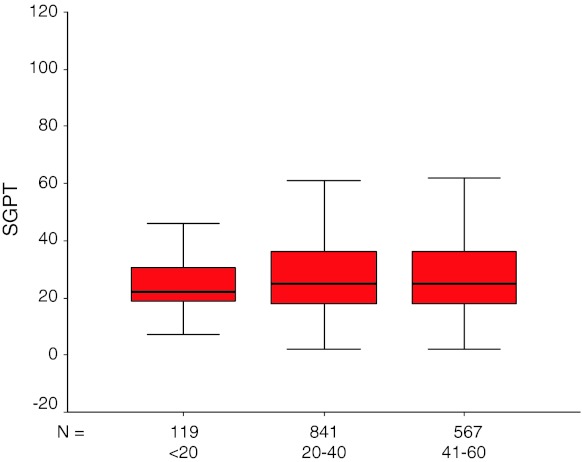
With respect to age a progressive narrowing of RI of bilirubin was observed, this may be attributed to decreased efficiency of liver functioning with advancing age. For liver specific enzymes, a mild to moderate increase in cutoff values of lower and upper limits of RI was noticed with progression of age (Fig. 13) except for ALP (Fig. 12) which showed reverse trend. These findings are consistent to findings observed by other workers [15–17]. The increase in RI of SGPT was more pronounced in age group 20–40 years as compared to age groups 41–60 years (Fig. 11). This may be because of irregularity in daily activities and life style in younger age group.
Fig. 13.
Age specific distribution of GGT
Fig. 12.
Age specific distribution of ALP
Fig. 11.
Age specific distribution of SGPT
Reference interval for SGOT, SGPT, ALP and GGT of males was higher in all age groups. However, in females GGT level was surprisingly high in <20 years of age group.
When pre and post menopausal women were compared it was observed that except bilirubin rest of the liver parameters were in higher range in post menopausal women which may be due to hormonal changes after menopause.
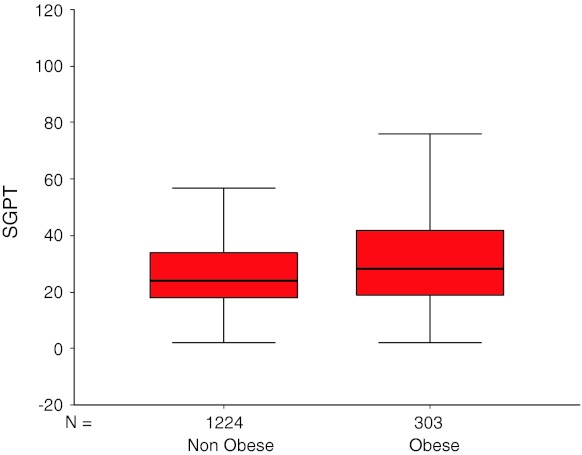
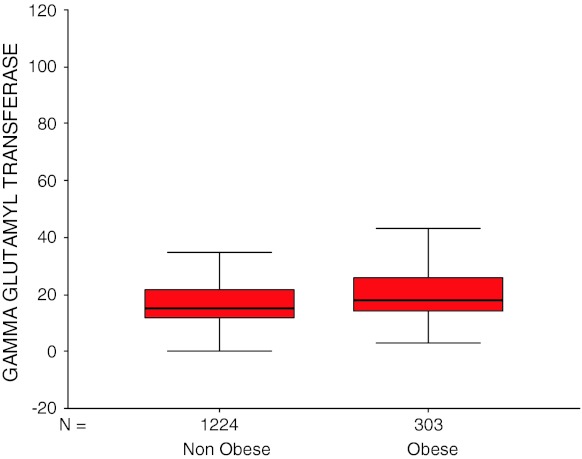
Obesity seems to affect liver functions appreciably as revealed by high RI of all liver specific enzymes in obese (BMI ≥ 25) as compared to non obese (BMI < 25) except bilirubin which remained within reported standard RI (Fig. 14, 15). RI of all liver enzymes was higher in both obese and non obese males as compared to obese and non obese females. Bilirubin have mild lower cutoff of RI in both obese and non obese females as compared to obese and non obese males.
Fig. 14.
Distribution of SGPT according to obesity
Fig. 15.
Distribution of GGT according to obesity
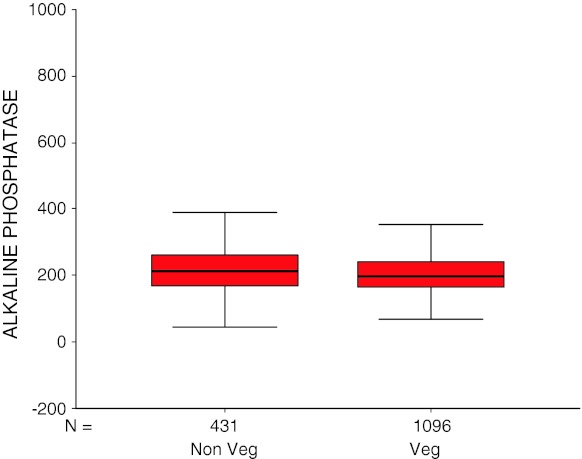
As per dietary habits, non vegetarian subjects showed elevation in upper cut off for ALP (Fig. 16) and GGT. Both enzymatic and non enzymatic liver parameters showed wide range of RI in males as compared to females when further studied in relation to dietary habits i.e. vegetarian and non vegetarian.
Fig. 16.
Distribution of ALP according to diet
Smokers showed higher range of RI for SGOT, GGT and ALP while no substantial difference in RI of SGPT was observed as compared to non smokers. Similarly in alcoholics, mild to moderate increase in cutoff of RI of these enzymes was observed as compared to non alcoholics. No marked difference was found in bilirubin levels both in alcoholic and smokers as compared to non alcoholic and non smokers.
In the view of above variations seen in RI of various liver specific biochemical parameters, it is suggested that every laboratory should establish it’s own RI for various biochemical parameters for its reference population so as to improve diagnosis and provide better patient care.
Contributor Information
Dharamveer Yadav, Email: dharam143s@gmail.com.
Praveen Sharma, Email: praveensharma55@gmail.com.
References
- 1.Sasse Edward A, Doumas Basil T, D’Orazio Paul, Eckfeldt John H, Evans Susan A, Graham Gary A, et al. How to define and determine reference intervals in the clinical laboratory approved guideline second edition. NCCLS Document C28-A2. 2000; 20(13).
- 2.Solberg Helge Erik. The IFCC recommendation on estimation of reference intervals. The RefVal Program. Clin Chem Lab Med. 2004;42(7):710–714. doi: 10.1515/CCLM.2004.121. [DOI] [PubMed] [Google Scholar]
- 3.Horn Paul S, Pesce Amadeo J. Effect of ethnicity on reference intervals. Clin Chem. 2002;48(10):1802–1804. [PubMed] [Google Scholar]
- 4.Aneke C, Nduka N, Maxwell-Owhochuku S. Comparison of some haematological indices of Africans and Caucasions resident in the Nigerian environment. Haematologia (Budapest) 1988;21(1):57–63. [PubMed] [Google Scholar]
- 5.Clinical and Laboratory Standards Institute. Defining, establishing and verifying reference intervals in the clinical laboratory; approved guideline, 3rd ed. CLSI document C28-A3. Wayne, PA: Clinical and Laboratory Standards Institute. 2008;28(30):61.
- 6.Doumas BT, Perry BW, Sasse EA, et al. Standardisation in bilirubin assays: evaluations of selected methods and stability of bilirubin solutions. Clin Chem. 1973;19:984–993. [PubMed] [Google Scholar]
- 7.Shaw LM, Stromme JH, London JL, Theodorsen L. IFCC methods for the determination of enzymes part 4. IFCC method for gamma glutamyl transferase [(gamma glutamyl)-peptide; amino acid gamma glutamyl transferase, EC 2.3.2.2.]. Clin Chem Acta. 1983;15F–338F. [PubMed]
- 8.Saris NE. Revised IFCC method for aspartate aminotransferase. Clin Chem. 1978;24:720–721. [Google Scholar]
- 9.Bergmeyer HU, Scheibe P, Wahlefeld AW. Optimization of methods for aspartate aminotransferase and alanine aminotransferase. Clin Chem. 1978;24:1. [PubMed] [Google Scholar]
- 10.Bowers GN, McComb RB. A continuous spectrophotometric method for measuring the activity of serum alkaline phosphatase. Clin Chem. 1966;12:70. [PubMed] [Google Scholar]
- 11.Kingsley GR. The direct biuret method for determination of serum proteins as applied to photoelectric and visual colorimetry. J Lab Clin Med. 1942;27:840–845. [Google Scholar]
- 12.Silverman LM, Christenson RH. Amino acids and proteins. In: Burtis CA, Ashwood ER, editors. Tietz textbook of clinical chemistry. 2. Philadelphia: W.B. Saunders; 1993. pp. 696–698. [Google Scholar]
- 13.Doumas BT, Peters T., Jr Serum and urine albumin: a progress report on their measurement and clinical significance. Clin Chem Acta. 1997;258:3–20. doi: 10.1016/S0009-8981(96)06446-7. [DOI] [PubMed] [Google Scholar]
- 14.SPSS Chicago IL. SPSS Inc. 2003 http://www.spss.com. Accessed Sep 2008, AIIMS, New Delhi.
- 15.Sultana F, Anitha D, Venkatesh T. Estimation of reference values in liver function test in health plan individuals of urban south Indian population. Indian J Clin Biochem. 2004;19(2):72–79. doi: 10.1007/BF02894260. [DOI] [PMC free article] [PubMed] [Google Scholar]
- 16.Ashavaid TF, Todur SP, Dherai AJ. Establishment of reference intervals in Indian population. Indian J Clin Biochem. 2005;20(2):110–118. doi: 10.1007/BF02867409. [DOI] [PMC free article] [PubMed] [Google Scholar]
- 17.Yadav D, Mishra S, Gupta M, Sharma P. Reference intervals of certain liver specific biochemical analytes in Indian population . Indian J Clin Biochem. 2011;26(1):97–98. doi: 10.1007/s12291-011-0107-5. [DOI] [PMC free article] [PubMed] [Google Scholar]


