

Abstract

The serotonin transporter (SERT), a primary target for many antidepressants, is expressed in the brain and also in peripheral blood cells. Although platelet SERT function is well accepted, lymphocyte SERT function has not been definitively characterized. Due to their small size, platelets often are found in peripheral blood mononuclear cell preparations aimed at isolating lymphocytes, monocytes, and macrophages. The presence of different cells makes it difficult to assign SERT expression and function to specific cell types. Here, we use flow cytometry and IDT307, a monoamine transporter substrate that fluoresces after uptake into cells, to investigate SERT function in lymphocyte and platelet populations independently, as well as simultaneously without prior isolation. We find that murine lymphocytes exhibit temperature-dependent IDT307 transport but uptake is independent of SERT. Lack of measurable SERT function in lymphocytes was corroborated by chronoamperometry using serotonin as a substrate. When we examined rhesus and human mixed blood cell populations, we found that platelets, and not lymphocytes, were primary contributors to SERT function. Overall, these findings indicate that lymphocyte SERT function is minimal. Moreover, flow cytometry, in conjunction with the fluorescent transporter substrate IDT307, can be widely applied to investigate SERT in platelets from populations of clinical significance.
Keywords: Serotonin transporter, Lymphocytes, platelets, chronoamperometry, flow cytometry, depression
Uptake by serotonin transporters (SERT) is an important mechanism for serotonin clearance from the extracellular space and one of a number of factors that regulates serotonergic neurotransmission.1,2 Serotonin transporters are the principal pharmacologic targets of serotonin-selective reuptake inhibiting antidepressants (SSRIs) and are believed to play a role in the etiology of neuropsychiatric disorders, including major depressive disorder (MDD),3,4 anxiety-related disorders,5 and obsessive-compulsive disorder.6 The Sequenced Treatment Alternatives to Relieve Depression (STAR*D) study, the largest United States clinical trial of its kind, evaluated treatment response rates to common antidepressants in thousands of patients with MDD.7 The results of this study indicated that only 30% of individuals diagnosed with MDD achieved remission after initial treatment with the SSRI citalopram.8 With such low initial remission rates, it would be highly advantageous for clinicians to determine which patients with MDD are likely to respond to SSRIs prior to treatment. Reduced [3H]-imipramine binding to SERT in platelets has been studied as a potential biomarker for depression, although after 30 years, consensus has not been reached as to whether depressed individuals have lower platelet SERT binding.9,10 By contrast, far fewer studies have focused on SERT function and of these only a handful have investigated changes in SERT function during treatment.11−15 To date, no studies have focused on SERT function as a predictive measure of antidepressant treatment response.
Serotonin transporter regulation and function have been studied using radiometric assay, voltammetry, or fluorescence microscopy in synaptosomes,16−18 platelets,19,20 peripheral blood cells (PBCs),21,22 lymphoblasts,23−25 brain slices,1 and the intact brains of experimental animals.26−28,2 Although SERT function can be effectively measured by all of these methods, ambiguity arises when samples containing multiple cell types, such as PBCs, are investigated due to the difficulty in assigning uptake to individual cell types. Blood cells are of particular interest because they can act as peripheral biomarkers of SERT function in neuropsychiatric diseases such as MDD.29,22 Additionally, characterizing SERT function in PBCs may lead to better understanding of the role of serotonin in immune cell function,30,31 blood pressure regulation,32 and lymphocyte malignancies.33,34
The gene that is responsible for SERT expression in the brain has been shown to code for SERT in peripheral blood cells.35−37,20 Platelets are small 2–3 μM anucleate cell fragments derived from megakaryocytes that are primarily responsible for hemostasis and blood clotting.38 Platelets have long been known to express SERT,38,32 and more recently dopamine transporter (DAT) expression has been identified in platelets.39,38 Serotonin transporter function has been characterized in platelets using [3H]-serotonin with typical Km values reported in the nano- to micromolar range.19,40 Lymphocyte SERT30,41 and DAT42,43 expression have also recently been described. Serotonin transporters are reported to be expressed in primary B-lymphocytes,41 T-lymphocytes,41 and mixed lymphocyte populations.44,41,45,46,21 However, others have failed to detect (or have detected only small amounts of) SERT in B-lymphocytes33,34 and T-lymphocytes.30 Human lymphoblastoid cell lines, which are Epstein–Barr virus-immortalized B-lymphocytes, are also thought to express functional SERT and have been used to study human SERT gene variants.23,24 Other immune cells, such as monocytes41 and dendritic cells,30 are thought to express SERT, though these cells are rare, making them difficult to isolate in quantities necessary for studying uptake. In light of the ambiguity surrounding SERT expression, particularly in lymphocytes, it is important to determine the cell types primarily responsible for SERT function to improve future efforts aimed at predicting/monitoring antidepressant responsiveness and to increase knowledge regarding the collective effects of SERT gene polymorphisms on SERT function.
Here, we investigated the use of IDT307, a fluorescent substrate for monoamine transporters including SERT, DAT, and norepinephrine transporters (NET), in combination with flow cytometry to delineate SERT function in mixed blood cell populations. An analogue of the nonfluorescent dopaminergic neurotoxin and DAT substrate 1-methylphenylpyridinium (MPP+), IDT307 is a twisted intramolecular charge transfer compound that fluoresces by adopting a planar conformation in hydrophobic or intercalated environments, that is, when bound to biomolecules such as protein and DNA (Figure S1, Supporting Information). Using flow cytometry to characterize IDT307 fluorescence, we determined SERT function in mixed cell populations where individual cell types were identified by differences in light scattering properties or surface epitopes. Across three species, our findings indicate that platelets are the major contributors to SERT function in peripheral blood cells.
Results and Discussion
Flow Cytometry and IDT307 to Measure Serotonin Uptake
Real-time determination of SERT function was carried out using the fluorescent transporter substrate IDT307 (excitation 488 nm, emission 520 nm) in combination with flow cytometry. In HEK293 cells stably expressing SERT (SERT-HEK cells), fluorescence intensity associated with IDT307 increased with time (Figure 1A). Preincubation of HEK-SERT cells with paroxetine to inhibit SERT reduced time-dependent fluorescence to levels in nontransfected cells.
Figure 1.

Serotonin transporter (SERT) function is determined by the fluorescent substrate IDT307 and flow cytometry. (A) Time course of uptake of IDT307 (3 μM) in SERT-transfected HEK293 cells (SERT-HEK). Fluorescence associated with IDT307 is minimal in cells not expressing SERT (HEK) and in SERT-HEK cells coincubated with the SERT inhibitor paroxetine (PRX; 1 μM). (B) Fluorescence at different concentrations of IDT307 (1–10 μM) in SERT-HEK cells. Specific uptake is the difference between total uptake in SERT-HEK cells and nonspecific uptake in HEK cells. Data (N = 5–6 per point) are expressed as means ± SEMs, the latter of which are too small to be pictured in some cases. Each sample contained 106 cells. Fluorescence intensity is in relative fluorescence units.
Concentration-dependent IDT307 uptake was investigated in SERT-HEK cells and compared to nontransfected cells. Fluorescence associated with IDT307 (1–10 μM) increased to a greater extent in SERT-HEK cells compared to HEK cells lacking SERT (Figure 1B). Nonspecific fluorescence in HEK cells, indicative of nonspecific binding or uptake by low affinity cation transporters,47 was subtracted from total fluorescence associated with SERT-HEK cells at each IDT307 concentration to determine specific uptake. These data indicate that IDT307 undergoes specific transport in the presence of SERT and that uptake kinetics can be investigating using this fluorescent substrate in combination with flow cytometry.
SERT Function in Mouse Lymphocytes versus Platelets
After incubation with IDT307, mouse lymphocytes showed increases in fluorescence compared to lymphocytes that had not been incubated with IDT307. To evaluate if increased fluorescence was due to an active process, we examined the relationship between IDT307 fluorescence and temperature. Fluorescence was significantly decreased when cells were incubated at 22 °C and was almost completely abolished at 4 °C, compared to 37 °C (Figure 2), suggesting that IDT307 fluorescence in mouse lymphocytes is associated with an active uptake process.
Figure 2.

Uptake of IDT307 in mouse lymphocytes is temperature-dependent. Fluorescence associated with IDT307 was significantly decreased when incubations were carried out at lower temperatures over 50 min. **P < 0.01 and ***P < 0.001 versus 37 °C; ††P < 0.01 versus 22 °C; N = 3 per temperature.
Previously, we used chronoamperometry to quantify SERT function in mouse brain synaptosomes16,17 and rhesus PBCs.21,22 Here, we employed chronoamperometry to assess SERT function in mouse lymphocytes isolated from spleen. Unlike rhesus PBCs, the current versus time trace in Figure 3A showed no evidence of uptake of serotonin from the extracellular solution into lymphocytes, indicating minimal SERT function. To explore this apparent lack/low level of SERT function in lymphocytes further, we used flow cytometry and IDT307. Here, forward scatter of visible light gives information about cell size, while side scatter provides information about cell granularity and surface complexity. Using information inherent in the forward scatter versus side scatter plot (Figure 3B), a population of cells known to be lymphocytes (Figure S2, Supporting Information) was selectively gated in flow cytometry experiments. Incubation of mouse lymphocytes with IDT307 shifted the lymphocyte peak to the right, indicating increased fluorescence intensity (Figure 3C). However, coincubating lymphocytes with IDT307 and the serotonin-selective uptake inhibitor paroxetine (1 μM) failed to shift the lymphocyte peak back to lower levels of fluorescence (Figure 3C). Furthermore, coincubation of mouse lymphocytes with two other SERT inhibitors, S-citalopram (1 μM) or clomipramine (1 μM), similarly failed to inhibit IDT307 uptake (Figure 3C, D). High concentrations of serotonin (500 μM) were also unable to compete with IDT307 uptake. Together, these data show that IDT307, but not serotonin, is actively transported by mouse lymphocytes; however, IDT307 uptake is not occurring via SERT.
Figure 3.

Mouse lymphocytes show little evidence of SERT-specific uptake. (A) Real-time uptake was monitored by chronoamperometry and shows a lack of clearance of extracellular serotonin by mouse lymphocytes (N = 4; SEMs in gray). Arrow represents time of serotonin injection. (B) Representative forward scatter (FSC-H) versus side scatter (SSC-H) flow cytometry data for cells isolated from mouse spleen. Lymphocytes (red) are gated based on scattering characteristics determined previously in cells selectively isolated using immunomagnetic bead separation (Figure S2, Supporting Information). Other cell populations are doublets (above lymphocyte population) or red blood cells, debris, etc. (below lymphocyte population). (C) Histograms of IDT307-associated fluorescence in mouse lymphocytes incubated without IDT307 (black), with IDT307 alone (green), or with IDT307 + 1 μM PRX (navy blue), 1 μM S-CIT (blue), or 1 μM CMI (light blue). Histograms for samples coincubated with uptake inhibitors overlap. (D) Fluorescence associated with IDT307 uptake is not significantly altered by coincubation with SERT inhibitors or serotonin (5-HT; 500 μM) (N = 3–9 per condition).
Compared to lymphocytes, platelets are known to have high levels of SERT protein19,20,45 and to take up19,20 and to release serotonin.48,49 We investigated uptake of IDT307 by flow cytometry in platelet-rich plasma isolated from mice and observed that lower concentrations of paroxetine (100 nM) or S-citalopram (100 nM) inhibited IDT307 uptake into mouse platelets (Figure 4).
Figure 4.

Mouse platelets exhibit robust SERT function. (A) Representative side scatter (SSC-H) versus IDT307 fluorescence intensity (IDT307) plot of platelets incubated without IDT307 (light gray), with IDT307 (green), or with IDT307 in the presence of 100 nM paroxetine (dark gray). (B) Uptake of IDT307 is significantly decreased in the presence of the SERT-specific inhibitors paroxetine (PRX) or S-citalopram (S-CIT) in mouse platelets (106 cells/sample). *P < 0.05 versus IDT307 alone; N = 5–8 mice.
Rhesus and Human Platelets but Not Lymphocytes Exhibit Measurable SERT Function
To determine if the lack of SERT function in mouse lymphocytes was species-specific, we examined IDT307 uptake in PBCs isolated from human or rhesus whole blood. Additionally, we used chronoamperometry to measure SERT function in human platelet-rich plasma versus human PBCs that were extensively washed to remove platelets. Figure 5 shows a comparison of the results obtained by both methods. Using chronoamperometry, clearance of serotonin by human platelets was readily observed at a rate of 0.46 ± 0.1 pmol/106 platelet × min (Figure 5A), whereas in isolated lymphocytes uptake was minimal to nonexistent; that is, the change in serotonin current over 20 min was <10% (Figure 5B).
Figure 5.

Human platelets but not lymphocytes show evidence of functional SERT. (A) Chronoamperometry monitoring of changes in extracellular serotonin concentration in human platelet samples (N = 3) shows complete clearance of serotonin. Shown in gray are SEMs for chronoamperometry data. Arrow indicates time of serotonin injection. (B) Lymphocyte samples (N = 4) show negligible uptake of serotonin. (C) Representative forward scatter (FSC-H) versus side scatter (SSC-H) flow cytometry plot indicating gating based on known scattering characteristics for lymphocytes and platelets. (D) Fluorescence histogram plot gated for lymphocytes shows that fluorescence increases after incubation in the presence (green) versus absence (black) of IDT307. However, IDT307-associated fluorescence in human lymphocytes is not altered by coincubation with the SERT inhibitors paroxetine (100 nM; dark gray), S-citalopram (100 nM; blue), or clomipramine (100 nM; lavender). (E) By contrast, IDT307-associated fluorescence in human platelets is decreased by 80–90% in the presence of the same concentrations of SERT inhibitors.
Coincubation of human PBCs with IDT307 and paroxetine, citalopram, clomipramine, or serotonin failed to show evidence of SERT-specific uptake when lymphocytes were selectively analyzed (Figures 5D and 6A). Interestingly, high concentrations of imipramine (100 μM), which have been used to inhibit serotonin uptake in lymphoblasts,23 reduced IDT307 uptake in human lymphocytes by approximately 40% (Figure 6A). However, at this concentration, imipramine is likely to interact nonselectively with unknown transporters, in addition to SERT (Ki (SERT) = 140 ± 40 nM50). Similarly, coincubations of rhesus PBCs with IDT307 and two different concentrations of S-citalopram (100 nm, 1 μM) or serotonin (500 μM) were used to investigate SERT-specific uptake by flow cytometry. Consistent with mouse and human lymphocyte experiments, selective gating for rhesus lymphocytes showed IDT307-associated fluorescence, but this was independent of SERT (Figure 6C).
Figure 6.

Comparison of lymphocyte versus platelet uptake of IDT307 in mixed blood cell populations by flow cytometry. Peripheral blood cell samples isolated from humans or rhesus monkeys containing both platelets and lymphocytes were analyzed for IDT307 uptake by flow cytometry. (A) SERT-specific function is not detectable in human lymphocytes using the SERT inhibitors paroxetine (PRX; 100 nM), S-CIT (100 nM), clomipramine (CMI; 100 nM), or 5-HT (500 μM). A high concentration of imipramine (IMI; 100 μM) caused a modest decrease in IDT307 uptake in human lymphocytes. (B) By contrast, human platelet SERT function is almost completely abolished in the presence of the same concentrations of inhibitors used in human lymphocytes. (C) IDT307-associated fluorescence (green bar) in rhesus lymphocytes is not inhibited by different concentrations of S-citalopram (S-CIT) or serotonin (5-HT; 500 μM). (D) Similar to human platelets, rhesus platelet IDT307 uptake is significantly inhibited by S-CIT or 5-HT. **P < 0.01 and ***P < 0.001 versus control. N = 3–6 samples per condition.
Peripheral blood cells isolated from whole blood, as opposed to lymphocytes from spleen, contain large numbers of platelets, in addition to mononuclear cells such as lymphocytes. In flow cytometry, the platelet population can be distinguished from the lymphocyte population on the basis of light scattering characteristics (Figure 5C) and dead cells of all types can be identified via propidium iodide staining (Figure S3, Supporting Information). Furthermore, platelets can be differentiated from lymphocytes through the use of cell-specific surface markers (Figure S4, Supporting Information). Concurrent with lymphocyte uptake, we examined IDT307 transport by human and rhesus platelets in PBC preparations. Paroxetine, S-citalopram, and clomipramine reduced human and rhesus platelet IDT307 uptake to <5% and <20% of total uptake, respectively, confirming that the majority of IDT307 uptake in platelets is mediated by SERT (Figures 5E and 6B, D). Furthermore, in contrast to lymphocytes, serotonin competed effectively for IDT307 uptake in platelets.
The primary finding of the present study is that platelets, not lymphocytes, contribute to the majority of SERT function in Ficoll-separated peripheral blood cells. Others and we have previously reported that lymphocytes and lymphoblastoid cell lines express functional SERT.23,24,41,21,51 However, the chronoamperometry and flow cytometry results presented here are not in strong agreement with prior findings. It is possible that lymphocytes express SERT but that, in nonactivated or nonmalignant cells, surface SERT localization is absent or present only in very low amounts. Others have failed to detect the presence of surface SERT on lymphocytes.30 The promiscuity of IDT307 for other transporters might also interfere with the ability to detect small changes in IDT307 fluorescence associated with low levels of SERT function, although the chronoamperometry findings using the native substrate for SERT (serotonin) do not support this idea. Fluorescence-activated cell sorting (FACS) to isolate lymphocyte and platelet fractions will be used in the future to compare relative surface SERT protein levels across different cell populations.
An additional finding is the probability of an unidentified transporter on lymphocytes that takes-up IDT307. In platelets, we hypothesize that SERT contributes to the majority of IDT307 uptake because almost complete inhibition of uptake was observed in the presence of SERT inhibitors (Table 1). However, in lymphocytes, uptake of IDT307 was not inhibited by coincubation with SERT inhibitors. Furthermore, although other laboratories have found evidence of DAT42,43 and NET (52) expression in lymphocytes, DAT and NET inhibitors failed to reduce IDT307 fluorescence (data not shown). Low affinity/high capacity organic cation transporters (OCT) can transport positively charged substrates like IDT307.47 Moreover, OCT-3 has been shown to transport serotonin at high concentrations under conditions of low SERT capacity.27,53 Since OCT-3 expression has not been explored in lymphocytes, we carried out preliminary experiments with IDT307 and coincubation with the OCT-3 inhibitor decynium-22. However, decynium-22 fluoresces at the emission wavelength used to detect IDT307 (520 nm), complicating evaluation of its inhibitory potency by flow cytometry. Nonetheless, a high concentration of serotonin failed to inhibit IDT307 uptake into lymphocytes, arguing against a role for OCT-3 or other decynium-22 sensitive transporters, including OCT1, OCT2, and the plasma membrane monoamine transporter (PMAT).
Table 1. Summary of Effects of SERT Inhibitors in Lymphocytes versus Platelets from Different Speciesa.
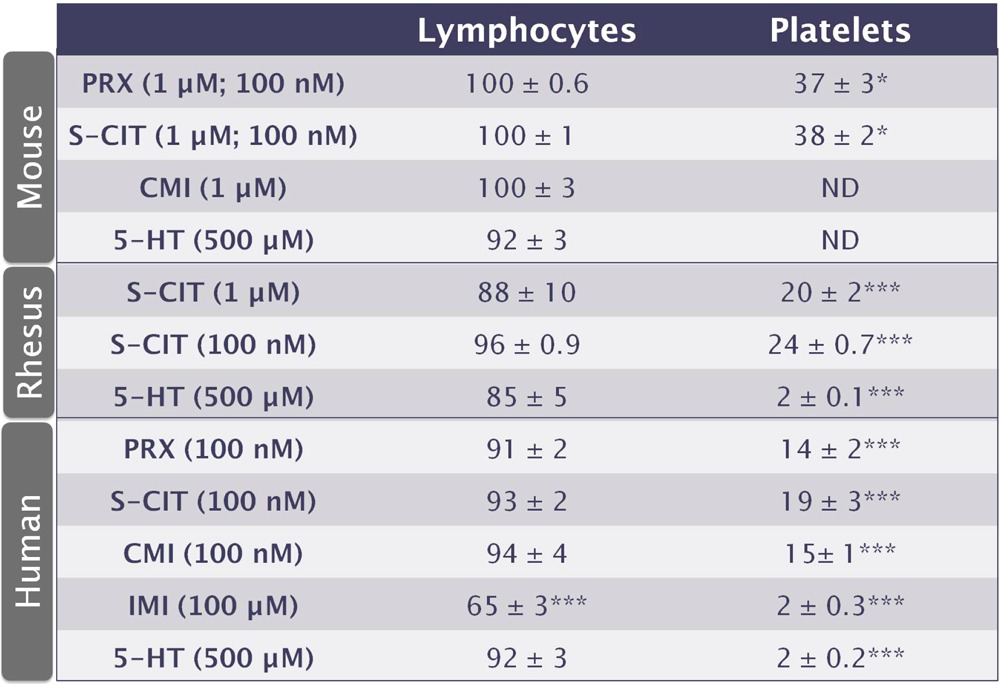
Fluorescence associated with IDT307 in samples coincubated with various transporter inhibitors or serotonin (5-HT) is expressed as a percent of fluorescence measured in samples incubated with IDT307 alone. Inhibitor concentrations are in parentheses, with concentrations in lymphocytes listed first. Values are means ± SEMs. *P < 0.05 and ***P < 0.001 versus IDT307 alone. ND is not done.
The use of flow cytometry has multiple advantages over other techniques to study monoamine transporter function. Flow cytometry enables transporter function to be differentiated in mixed cell populations on the basis of cell type. Using light scattering properties or fluorescent antibody labeling of cell-surface markers, different cell populations can be identified and analyzed with respect to IDT307-associated fluorescence. Radiometric uptake, voltammetry, or analysis of fluorescent substrates using microplate readers require that distinct cell populations be separated since these methods can not differentiate uptake by cell type. Furthermore, fluorescence associated with individual cells is measured by flow cytometry enabling variance within cell populations to be evaluated. Further, flow cytometry is optimized for cells such as lymphocytes that grow suspended in media, unlike HEK293 cells, which are adherent cell lines used in transfection and overexpression studies.
Although radiometric methods are a cornerstone for studying transporter function, the goals and limitations of particular types of experiments must be considered. Moreover, fluorescence-based techniques have already replaced radiometric methods to advantage in many important areas, for example, DNA sequencing and gene expression analysis. There are multiple benefits associated with using a fluorescent substrate for monoamine transporters. For example, receptor modulation of transporter function can be differentiated based on the selectivity of nonnative substrates versus endogenous substrates for transporters over receptors. Others have shown using ASP+, another fluorescent MPP+ analogue (Figure S1, Supporting Information), that DAT is regulated by activation of D2 and D3 dopamine receptors.54 Unlike dopamine, ASP+ interacts selectively with DAT versus dopamine receptors. Similarly, flow cytometry, in combination with IDT307, could be used to examine SERT/5-HT1A receptor interactions in immune cells.55 There are some drawbacks to using IDT307, which is a promiscuous substrate for multiple transporters. While IDT307 can be used to study the function of multiple transporters in native cells experiments must be carefully designed. This is evidenced by the findings of temperature-dependent yet SERT-independent IDT307 uptake in lymphocytes.
The use of peripheral blood cells as biomarkers for central nervous system function has the potential to impact the diagnosis and treatment of neuropsychiatric disorders. Others have begun to examine immune cells as biomarkers for neurological diseases such as Parkinson’s disease,56 multiple system atrophy,43 and amyotrophic lateral sclerosis.42 We are currently investigating SERT function using chronoamperometry in PBCs from patients with MDD to predict treatment effectiveness. By looking directly at SERT function, we hope to circumvent the need to identify and to understand the contributions of a large number of known and unknown genetic factors that may influence antidepressant responses. Unlike chronoamperometry, flow cytometry is commonly found in most major clinical and research centers enabling biomarker assays to be put into clinical practice faster and with more ease.29 Moreover, a miniaturized fluorescent microscope and flow cytometer coupled to a cell phone have been recently demonstrated and could form the basis of future personalized medicine/remote analysis approaches.57,58 Understanding the relationship between pretreatment SERT function29,22 or changes in uptake occurring early in treatment59 and therapeutic outcomes might give clinicians the ability to prescribe certain classes of drugs for different patients with greater reliably. With high treatment uncertainty in current approaches, these types of advances are necessary for the realization of personalized medicine.
Experimental Procedures
Chemicals and Drugs
IDT307 was synthesized and characterized by standard methods at Vanderbilt University. Dulbecco’s modified Eagle's medium (DMEM), fetal bovine serum (FBS), and propidium iodide (PI) were purchased from Life Technologies (Grand Island, NY). Serotonin (5-HT), paroxetine (PRX), imipramine (IMI), NH4Cl, KHCO3, Na2EDTA, DMSO, and prostaglandin E1 were purchased from Sigma-Aldrich (St Louis, MO). Clomipramine (CMI) was purchased from Sigma Aldrich/RBI (Natick, MA). S-Citalopram (S-CIT) was from Biotrend (Destin, FL). Penicillin/streptomycin was purchased from Fisher Scientific (Pittsburgh, PA). Chemicals used for the assay buffer were purchased from VWR (West Chester, PA).
HEK293 Cells
Human embryonic kidney-293 cells (HEK293) and SERT-transfected HEK293 cells were cultured until confluent at 37 °C in 5% CO2 in DMEM containing 10% FBS and 1% penicillin/streptomycin. Prior to uptake experiments, cells were gently dissociated from the bottoms of culture flasks using trituration with a serological pipet. Cell suspensions were centrifuged at 100g and resuspended in assay buffer (150 mM NaCl, 5 mM KCl, 1.2 mM MgCl2, 5 mM glucose, 10 mM HEPES, 2 mM CaCl2; pH 7.4).21 For real-time experiments, IDT307 (3 μM) was added 60 s after beginning fluorescence measurements. Uptake was monitored for an additional 10 min with fluorescence averaged every 20 s. For saturation experiments, HEK293 cells and HEK-SERT cells were incubated with different concentrations of IDT307 (1.0–10.0 μM) at room temperature for 10 min. Cells were then centrifuged at 100g and resuspended in fresh assay buffer.
Mouse Lymphocytes and Platelets
All procedures involving animals were carried out in accordance with National Institutes of Health Animal Care and Use Guidelines and were approved by the Pennsylvania State University Animal Care and Use Committee or the University of California, Los Angeles Chancellor’s Animal Research Committee. For lymphocyte isolations, mice were anesthetized with 5% isoflurane, euthanized immediately by cervical dislocation, and the spleens were rapidly removed and homogenized in 15 mL of sterile 2% FBS in phosphate buffered saline (2% FBS/PBS). Homogenates were centrifuged at 500g and resuspended in 5 mL of ACK lysis buffer (0.15 M NH4Cl, 0.01 M KHCO3, 0.1 mM Na2EDTA, pH 7.2–7.4) to remove the majority of red blood cells. Lysis was stopped by the addition of 40 mL of cold 2% FBS/PBS. The lysis solution was removed by centrifugation at 500g for 10 min. Cells were resuspended in 10 mL of cold 2% FBS/PBS and filtered through 40 μm nylon mesh filters to obtain lymphocytes.
To isolate mouse platelets, trunk blood was collected into heparinized capillaries (Drummond Scientific Company, Broomall, PA). Blood was pooled in 1.5 mL Eppendorf tubes and 1/2 volume 150 mM NaCl/10 mM HEPES/1 mM EDTA; pH 7.4 was added. Samples were centrifuged at 300g for 15 min to isolate platelet rich plasma (PRP), which was removed and placed into fresh 1.5 mL Eppendorf tubes. Prostaglandin E1 was added to PRP for a final concentration of 1 μM to inhibit platelet activation. Samples were centrifuged at 1000g for 10 min and platelet pellets were resuspended in assay buffer prior to uptake measurements.
Rhesus and Human Peripheral Blood Cells
Whole blood was collected in 10 mL tubes containing 158 USP units of sodium heparin (BD Vacutainer, Franklin Lakes, NJ). Blood was transferred into 50 mL conical tubes, and PBS was added for a total volume of 30 mL. Blood/PBS solutions were layered on 15 mL of Ficoll-Plaque solution (GE Healthcare, Uppsala, Sweden) and centrifuged at 1400g for 20 min with no brake. The buffy layer (containing peripheral blood mononuclear cells and platelets) was removed and washed twice with PBS followed each time by a 15 min spin at 500g. Cells were resuspended in 90% FBS/10% DMSO and placed into a Mr. Frosty freezing chamber overnight at −80 °C. Just prior to experiments, cells were gently thawed for 2 min and then quickly poured into 12 mL of fresh assay buffer. Cells were centrifuged at 500g for 6 min. Supernatants were removed, and cells were resuspended in assay buffer.
To isolate human platelet-rich plasma and lymphocytes, whole blood samples (20 mL) were centrifuged at 200g for 15 min to pellet red blood cells and mononuclear cells. The PRP supernatants were removed and placed into fresh centrifuge tubes. Prostaglandin E1 was added to a final concentration of 1 μM to prevent platelet activation. Samples of PRP were centrifuged at 2500g for 5 min, washed once with 2 mL PBS, and then centrifuged again at 2500g for 5 min. Platelets were resuspended in assay buffer and used for chronoamperometry. For chronoamperometry experiments using isolated lymphocytes, PBCs from Ficoll separations were washed with PBS (10 mL) three additional times and centrifuged after each wash at 100g for 10 min to remove platelets. Cell samples were examined using light microscopy to verify that most platelets had been removed.
IDT307 Uptake and Flow Cytometry
Following isolation, mouse, rhesus, or human peripheral blood cells were centrifuged for 10 min at 500g. Supernatants were removed, and cells were resuspended in fresh 37 °C assay buffer. Experiments for each treatment per animal were conducted in duplicate. Cells for all experiments were counted manually using a hemocytometer. Cells were divided equally (106 cells/mL) into 1.5 mL Eppendorf tubes and individual drugs or serotonin were added to specific tubes. Samples were placed in a 37 °C incubator for 10–20 min to allow time for drug diffusion/binding. After preincubation, 1.5 μM IDT307 was added and samples were further incubated for 50 min at 37 °C. The concentration of IDT307 used in PBC experiments was associated with maximal uptake above which nonspecific fluorescence increased substantially. Following incubation, cells were centrifuged for 10 min at 500g and resuspended in fresh, cold assay buffer to terminate uptake. For temperature dependence experiments, cells were incubated at different temperatures prior to and during uptake of 1.5 μM IDT307. Propidium iodide was added to each sample prior to cytometric analysis to assay dead cells (Figure S3, Supporting Information). A Becton Dickinson FACScalibur flow cytometer or a Coulter FC500 flow cytometer was used to carry out flow cytometry. Propidium iodide and IDT307 were excited with a 488 nm laser, and fluorescence was monitored at 520 nm for IDT307 and 585 nm for PI.
Chronoamperometry
Experiments using chronoamperometry and boron-doped diamond electrodes were carried out as previously described.21 Samples containing mouse splenocytes (∼35 million cells), human lymphocytes (∼10 million cells), or human platelets (∼350 million cells) were placed into single wells of a 12-well plate in 2 mL assay buffer. Working and reference electrodes were stabilized in cells suspensions, after which serotonin was injected into each well at a final concentration of 750 nM. Uptake was measured over 20 min followed by postcalibration.
Data Analysis
Flow cytometry data were analyzed using FCS Express (De Novo Software, Los Angeles, CA). Propidium iodide fluorescence was analyzed to distinguish IDT307 fluorescence associated with live cells. Individual cell types have unique light scattering properties based on differences in cell size (forward scatter) and granularity (side scatter). Gating on these properties, in combination with identification via fluorescently labeled cell surface epitopes or dead cells, enables changes in IDT307 fluorescence to be analyzed in specific populations of cells.60 After selectively gating on lymphocytes or platelets, median fluorescence intensities in the detector at the IDT307 emission wavelength were used to determine background fluorescence of cells in the absence of IDT307. Sets of samples that were incubated with drugs or serotonin included samples where IDT307 was excluded to assess background fluorescence associated with the drugs themselves. GraphPad Prism (GraphPad Software, La Jolla, CA) was used for graphing and statistical analysis. Values are expressed as means ± standard errors of the means (SEM) and are shown as relative fluorescence intensity or are expressed as percents of relative controls. One-way analysis of variance (ANOVA) was used to analyze drug effects in lymphocyte and platelet experiments. Tukey’s post hoc multiple comparisons were used for individual group comparisons after one-way ANOVA.
Acknowledgments
Cells (HEK293 and SERT-HEK) were a generous gift from Dr. Randy Blakely, Vanderbilt University. The authors are grateful to Dr. Avery August (Cornell University) and his laboratory for technical assistance with splenocyte isolation protocols. Rhesus peripheral blood cell samples were kind gifts from Dr. Michael Murphey-Corb and Ms. Heather Michael (University of Pittsburgh). The authors would like to thank Ms. Stefanie Altieri for assistance with graphics design, and Mr. Huan Cao and Dr. Wei-Ssu Liao for assistance with chemical structures. Ms. Altieri and Prof. Paul Weiss are also gratefully acknowledged for critical feedback on the manuscript. Flow cytometry was conducted with the assistance of the Penn State Microscopy and Cytometry Facility (University Park, PA) and the UCLA Jonsson Comprehensive Cancer Center and Center for AIDS Research Flow Cytometry Core Facility (Los Angeles, CA). The content is solely the responsibility of the authors and does not necessarily represent the official views of the National Institute of Mental Health or the National Institutes of Health.
Glossary
Abbreviations
- 5-HT
serotonin
- SERT
serotonin transporter
- MDD
major depressive disorder
- PBCs
peripheral blood cells
- SSRI
serotonin-selective reuptake inhibitor
- PRX
paroxetine
- S-CIT
S-citalopram
- CMI
clomipramine
- IMI
imipramine
- DAT
dopamine transporter
- NET
norepinephrine transporter
- OCT
organic cation transporter
- PI
propidium iodide
- FSC-H
forward scatter
- SSC-H
side scatter
- Ex[5-HT]
extracellular serotonin
Supporting Information Available
Additional experimental methods and figures as described in the text. This material is available free of charge via the Internet at http://pubs.acs.org.
Author Contributions
B.S.B. and A.M.A. designed the experiments, analyzed the data, and wrote the paper. B.S.B. carried out the experiments. I.D.T. and S.J.R. developed and synthesized the fluorescent compound IDT307 used in the experiments.
Support from the National Institute of Mental Health (MH064756) is gratefully acknowledged.
The authors declare the following competing financial interest(s): S. J. Rosenthal and I. D. Tomlinson declare financial interests in commercial products involving IDT307. B. S. Beikmann and A. M. Andrews declare no conflicts of interest.
Funding Statement
National Institutes of Health, United States
Supplementary Material
References
- Jennings K. A.; Lesch K.-P.; Sharp T.; Cragg S. J. (2010) Non-linear relationship between 5-HT transporter gene expression and frequency sensitivity of 5-HT signals. J. Neurochem. 115, 965–973. [DOI] [PubMed] [Google Scholar]
- Hashemi P.; Dankoski E. C.; Lama R.; Wood K. M.; Takmakov P.; Wightman R. M. (2012) Brain dopamine and serotonin differ in regulation and its consequences. Proc. Natl. Acad. Sci. U.S.A. 109, 11510–11515. [DOI] [PMC free article] [PubMed] [Google Scholar]
- Vaidya V. A.; Duman R. S. (2001) Depression – emerging insights from neurobiology. Br. Med. Bull. 57, 61–79. [DOI] [PubMed] [Google Scholar]
- Tamminga C. A.; Nemeroff C. B.; Blakely R. D.; Brady L.; Carter C. S.; Davis K. L.; Dingledine R.; Gorman J. M.; Grigoriadis D. E.; Henderson D. C.; B. Innis R.; Killen J.; Laughren T. P.; McDonald W. M.; M. Murphy G. Jr; Paul S. M.; Rudorfer M. V.; Sausville E.; Schatzberg A. F.; Scolnick E. M.; Suppes T. (2002) Developing novel treatments for mood disorders: accelerating discovery. Biol. Psychiatry 52, 589–609. [DOI] [PubMed] [Google Scholar]
- Stein M.; Seedat S.; Gelernter J. (2006) Serotonin transporter gene promoter polymorphism predicts SSRI response in generalized social anxiety disorder. Psychopharmacology 187, 68–72. [DOI] [PubMed] [Google Scholar]
- Ozaki N.; Goldman D.; Kaye W. H.; Plotnicov K.; Greenberg B. D.; Lappalainen J.; Rudnick G.; Murphy D. L. (2003) Serotonin transporter missense mutation associated with a complex neuropsychiatric phenotype. Mol. Psychiatry 8, 933–936. [DOI] [PubMed] [Google Scholar]
- Sinyor M.; Schaffer A.; Levitt A. (2010) The Sequenced Treatment Alternatives to Relieve Depression (STAR*D) Trial: A Review. Can. J. Psychiatry 55, 126–135. [DOI] [PubMed] [Google Scholar]
- Rush A. J.; Warden D.; Wisniewski S. R.; Fava M.; Trivedi M. H.; Gaynes B. N.; Nierenberg A. A. (2009) STAR*D: Revising conventional wisdom. CNS Drugs 23, 627–647. [DOI] [PubMed] [Google Scholar]
- Marcusson J. O.; Ross S. B. (1990) Binding of some antidepressants to the 5-hydroxytryptamine transporter in brain and platelets. Psychopharmacology (Berlin, Ger.) 102, 145–155. [DOI] [PubMed] [Google Scholar]
- Owens M. J.; Nemeroff C. B. (1994) Role of serotonin in the pathophysiology of depression: focus on the serotonin transporter. Clin. Chem. 40, 288–295. [PubMed] [Google Scholar]
- Urbina M.; Pineda S.; Pinango L.; Carreira I.; Lima L. (1999) [3H]Paroxetine binding to human peripheral lymphocyte membranes of patients with major depression before and after treatment with fluoxetine. Int. J. Immunopharmacol. 21, 631–646. [DOI] [PubMed] [Google Scholar]
- Lima L.; Urbina M. (2002) Serotonin transporter modulation in blood lymphocytes from patients with major depression. Cell. Mol. Neurobiol. 22, 797–804. [DOI] [PMC free article] [PubMed] [Google Scholar]
- Rausch J. L.; Johnson M. E.; Fei Y. J.; Li J. Q.; Shendarkar N.; Hobby H. M.; Ganapathy V.; Leibach F. H. (2002) Initial conditions of serotonin transporter kinetics and genotype: influence on SSRI treatment trial outcome. Biol. Psychiatry 51, 723–732. [DOI] [PubMed] [Google Scholar]
- Axelson D. A.; Perel J. M.; Birmaher B.; Rudolph G.; Nuss S.; Yurasits L.; Bridge J.; Brent D. A. (2005) Platelet serotonin reuptake inhibition and response to SSRIs in depressed adolescents. Am. J. Psychiatry 162, 802–804. [DOI] [PubMed] [Google Scholar]
- Pena S.; Baccichet E.; Urbina M.; Carreira I.; Lima L. (2005) Effect of mirtazapine treatment on serotonin transporter in blood peripheral lymphocytes of major depression patients. Int. Immunopharmacol. 5, 1069–1076. [DOI] [PubMed] [Google Scholar]
- Perez X. A.; Andrews A. M. (2004) Chronoamperometry to determine differential reductions in uptake in brain synaptosomes from serotonin transporter knockout mice. Anal. Chem. 77, 818–826. [DOI] [PubMed] [Google Scholar]
- Perez X. A.; Bianco L. E.; Andrews A. M. (2006) Filtration disrupts synaptosomes during radiochemical analysis of serotonin uptake: Comparison with chronoamperometry in SERT knockout mice. J. Neurosci. Methods 154, 245–255. [DOI] [PubMed] [Google Scholar]
- Oz M.; Libby T.; Kivell B.; Jaligam V.; Ramamoorthy S.; Shippenberg T. S. (2010) Real-time, spatially resolved analysis of serotonin transporter activity and regulation using the fluorescent substrate, ASP. J. Neurochem. 114, 1019–1029. [DOI] [PMC free article] [PubMed] [Google Scholar]
- Greenberg B. D.; Tolliver T. J.; Huang S.-J.; Li Q.; Bengel D.; Murphy D. L. (1999) Genetic variation in the serotonin transporter promoter region affects serotonin uptake in human blood platelets. Am. J. Med. Genet. 88, 83–87. [PubMed] [Google Scholar]
- Jayanthi L. D.; Samuvel D. J.; Blakely R. D.; Ramamoorthy S. (2005) Evidence for biphasic effects of protein kinase C on serotonin transporter function, endocytosis, and phosphorylation. Mol. Pharmacol. 67, 2077–2087. [DOI] [PubMed] [Google Scholar]
- Singh Y. S.; Sawarynski L. E.; Michael H. M.; Ferrell R. E.; Murphey-Corb M. A.; Swain G. M.; Patel B. A.; Andrews A. M. (2010) Boron-doped diamond microelectrodes reveal reduced serotonin uptake rates in lymphocytes from adult rhesus monkeys carrying the short allele of the 5-HTTLP. ACS Chem. Neurosci. 1, 49–64. [DOI] [PMC free article] [PubMed] [Google Scholar]
- Singh Y. S.; Altieri S. C.; Gilman T. L.; Michael H. M.; Tomlinson I. D.; Rosenthal S. J.; Swain G. M.; Murphey-Corb M. A.; Ferrell R. E.; Andrews A. M. (2012) Differential serotonin transport is linked to the rh5-HTTLPR in peripheral blood cells. Transl. Psychiatry 2, e77. [DOI] [PMC free article] [PubMed] [Google Scholar]
- Lesch K.-P.; Bengel D.; Heils A.; Sabol S. Z.; Greenberg B. D.; Petri S.; Benjamin J.; Müller C. R.; Hamer D. H.; Murphy D. L. (1996) Association of anxiety-related traits with a polymorphism in the serotonin transporter gene regulatory region. Science 274, 1527–1531. [DOI] [PubMed] [Google Scholar]
- Mössner R.; Daniel S.; Albert D.; Heils A.; Okladnova O.; Schmitt A.; Lesch K.-P. (2000) Serotonin transporter function is modulated by brain-derived neurotrophic factor (BDNF) but not nerve growth factor (NGF). Neurochem. Int. 36, 197–202. [DOI] [PubMed] [Google Scholar]
- Prasad H. C.; Zhu C.-B.; McCauley J. L.; Samuvel D. J.; Ramamoorthy S.; Shelton R. C.; Hewlett W. A.; Sutcliffe J. S.; Blakely R. D. (2005) Human serotonin transporter variants display altered sensitivity to protein kinase G and p38 mitogen-activated protein kinase. Proc. Natl. Acad. Sci. U.S.A. 102, 11545–11550. [DOI] [PMC free article] [PubMed] [Google Scholar]
- Daws L. C.; Munn J. L.; Valdez M. F.; Frosto-Burke T.; Hensler J. G. (2007) Serotonin transporter function, but not expression, is dependent on brain-derived neurotrophic factor (BDNF): in vivo studies in BDNF-deficient mice. J. Neurochem. 101, 641–651. [DOI] [PubMed] [Google Scholar]
- Baganz N. L.; Horton R. E.; Calderon A. S.; Owens W. A.; Munn J. L.; Watts L. T.; Koldzic-Zivanovic N.; Jeske N. A.; Koek W.; Toney G. M.; Daws L. C. (2008) Organic cation transporter 3: Keeping the brake on extracellular serotonin in serotonin-transporter-deficient mice. Proc. Natl. Acad. Sci. U.S.A. 105, 18976–18981. [DOI] [PMC free article] [PubMed] [Google Scholar]
- Zhu C.-B.; Lindler K. M.; Owens A. W.; Daws L. C.; Blakely R. D.; Hewlett W. A. (2010) Interleukin-1 receptor activation by systemic lipopolysaccharide induces behavioral despair linked to MAPK regulation of CNS serotonin transporters. Neuropsychopharmacology 35, 2510–2520. [DOI] [PMC free article] [PubMed] [Google Scholar]
- Leuchter A.; Cook I.; Hamilton S.; Narr K.; Toga A.; Hunter A.; Faull K.; Whitelegge J.; Andrews A.; Loo J.; Way B.; Nelson S.; Horvath S.; Lebowitz B. (2010) Biomarkers to predict antidepressant response. Curr. Psychiatry Rep. 12, 553–562. [DOI] [PMC free article] [PubMed] [Google Scholar]
- O’Connell P. J.; Wang X.; Leon-Ponte M.; Griffiths C.; Pingle S. C.; Ahern G. P. (2006) A novel form of immune signaling revealed by transmission of the inflammatory mediator serotonin between dendritic cells and T cells. Blood 107, 1010–1017. [DOI] [PMC free article] [PubMed] [Google Scholar]
- Ahern G. P. (2011) 5-HT and the immune system. Curr. Opin. Pharmacol. 11, 29–33. [DOI] [PMC free article] [PubMed] [Google Scholar]
- Watts S. W.; Morrison S. F.; Davis R. P.; Barman S. M. (2012) Serotonin and blood pressure regulation. Pharmacol. Rev. 64, 359–388. [DOI] [PMC free article] [PubMed] [Google Scholar]
- Meredith E. J.; Holder M. J.; Chamba A.; Challa A.; Drake Lee A.; Bunce C. M.; Drayson M. T.; Pilkington G.; Blakely R. D.; Dyer M. J. S.; Barnes N. M.; Gordon J. (2005) The serotonin transporter (SLC6A4) is present in B-cell clones of diverse malignant origin: probing a potential antitumor target for psychotropics. FASEB J. 19, 1187–1189. [DOI] [PubMed] [Google Scholar]
- Chamba A.; Holder M. J.; Jarrett R. F.; Shield L.; Toellner K. M.; Drayson M. T.; Barnes N. M.; Gordon J. (2010) SLC6A4 expression and anti-proliferative responses to serotonin transporter ligands chlomipramine and fluoxetine in primary B-cell malignancies. Leuk. Res. 34, 1103–1106. [DOI] [PubMed] [Google Scholar]
- Lesch K.-P.; Wolozin B. L.; Murphy D. L.; Riederer P. (1993) Primary Structure of the Human Platelet Serotonin Uptake Site: Identity with the Brain Serotonin Transporter. J. Neurochem. 60, 2319–2322. [DOI] [PubMed] [Google Scholar]
- Ramamoorthy S.; Bauman A. L.; Moore K. R.; Han H.; Yang-Feng T.; Chang A. S.; Ganapathy V.; Blakely R. D. (1993) Antidepressant- and cocaine-sensitive human serotonin transporter: molecular cloning, expression, and chromosomal localization. Proc. Natl. Acad. Sci. U.S.A. 90, 2542–2546. [DOI] [PMC free article] [PubMed] [Google Scholar]
- Chen J. J.; Li Z.; Pan H.; Murphy D. L.; Tamir H.; Koepsell H.; Gershon M. D. (2001) Maintenance of serotonin in the intestinal mucosa and ganglia of mice that lack the high-affinity serotonin transporter: Abnormal intestinal motility and the expression of cation transporters. J. Neurosci. 21, 6348–6361. [DOI] [PMC free article] [PubMed] [Google Scholar]
- Mercado C. P.; Fusun K. (2010) Molecular mechanisms of SERT in platelets: Regulation of plasma serotonin levels. Mol. Interventions 10, 231–241. [DOI] [PMC free article] [PubMed] [Google Scholar]
- Frankhauser P.; Grimmer Y.; Bugert P.; Deuschle M.; Schmidt M.; Schloss P. (2006) Characterization of the neuronal dopamine transporter DAT in human blood platelets. Neurosci. Lett. 399, 197–201. [DOI] [PubMed] [Google Scholar]
- Rausch J. L.; Johnson M. E.; Li J.; Hutcheson J.; Carr B. M.; Corley K. M.; Gowans A. B.; Smith J. (2005) Serotonin transport kinetics correlated between human platelets and brain synaptosomes. Psychopharmacology 180, 391–398. [DOI] [PubMed] [Google Scholar]
- Yang G. B.; Qiu C. L.; Aye P.; Shao Y.; Lackner A. A. (2007) Expression of serotonin transporters by peripheral blood mononuclear cells of rhesus monkeys (Macaca mulatta). Cell. Immunol. 248, 69–76. [DOI] [PubMed] [Google Scholar]
- Buttarelli F. R.; Circella A.; Pellicano C.; Pontieri F. E. (2006) Dopamine transporter immunoreactivity in peripheral blood mononuclear cells in amyotrophic lateral sclerosis. Eur. J. Neurol. 13, 416–418. [DOI] [PubMed] [Google Scholar]
- Buttarelli F.; Circella A.; Pellicano C.; Tiple D.; Giovannelli M.; Colosimo C.; Pontieri F. (2009) Dopamine transporter immunoreactivity in peripheral blood lymphocytes in multiple system atrophy. J. Neural Transm. 116, 161–165. [DOI] [PubMed] [Google Scholar]
- Faraj B. A.; Olkowski Z. L.; Jackson R. T. (1994) Expression of a high-affinity serotonin transporter in human lymphocytes. Int. J. Immunopharmacol. 16, 561–567. [DOI] [PubMed] [Google Scholar]
- Cupello A.; Albano C.; Gatta E.; Scarrone S.; Villa E.; Zona G. (2009) Binding of paroxetine to the serotonin transporter in membranes from different cells, subcellular fractions and species. Neurochem. Res. 34, 255–259. [DOI] [PubMed] [Google Scholar]
- Rivera-Baltanas T.; Romay-Tallon R.; Dopeso-Reyes I. G.; Caruncho H. (2010) Serotonin transporter clustering in blood lymphocytes of reeler mice. Cardiovasc. Psychiatry Neurol. 2010. [DOI] [PMC free article] [PubMed] [Google Scholar]
- Roth M.; Obaidat A.; Hagenbuch B. (2012) OATPs, OATs and OCTs: the organic anion and cation transporters of the SLCO and SLC22A gene superfamilies. Br. J. Pharmacol. 165, 1260–1287. [DOI] [PMC free article] [PubMed] [Google Scholar]
- Ge S.; White J. G.; Haynes C. L. (2009) Quantal Release of Serotonin from Platelets. Anal. Chem. 81, 2935–2943. [DOI] [PubMed] [Google Scholar]
- Ge S.; Woo E.; White J. G.; Haynes C. L. (2011) Electrochemical measurement of endogenous serotonin release from human blood platelets. Anal. Chem. 83, 2598–2604. [DOI] [PMC free article] [PubMed] [Google Scholar]
- Wood M. D.; Broadhurst A. M.; Wyllie M. G. (1986) Examination of the relationship between the uptake system for 5-hydroxytryptamine and the high-affinity [3H]imipramine binding site—I Inhibition by drugs. Neuropharmacology 25, 519–525. [DOI] [PubMed] [Google Scholar]
- Hohmann S.; Schweinfurth N.; Lau T.; Deuschle M.; Lederbogen F.; Banaschewski T.; Schloss P. (2011) Differential expression of neuronal dopamine and serotonin transporters DAT and SERT in megakaryocytes and platelets generated from human MEG-01 megakaryoblasts. Cell Tissue Res. 346, 151–161. [DOI] [PubMed] [Google Scholar]
- Mata S.; Urbina M.; Manzano E.; Ortiz T.; Lima L. (2005) Noradrenaline transporter and its turnover rate are decreased in blood lymphocytes of patients with major depression. J. Neuroimmunol. 170, 134–140. [DOI] [PubMed] [Google Scholar]
- Daws L. C. (2009) Unfaithful neurotransmitter transporters: Focus on serotonin uptake and implications for antidepressant efficacy. Pharmacol. Ther. 121, 89–99. [DOI] [PMC free article] [PubMed] [Google Scholar]
- Bolan E. A.; Kivell B.; Jaligam V.; Oz M.; Jayanthi L. D.; Han Y.; Sen N.; Urizar E.; Gomes I.; Devi L. A.; Ramamoorthy S.; Javitch J. A.; Zapata A.; Shippenberg T. S. (2007) D2 receptors regulate dopamine transporter function via an extracellular signal-regulated kinases 1 and 2-dependent and phosphoinositide 3 kinase-independent mechanism. Mol. Pharmacol. 71, 1222–1232. [DOI] [PubMed] [Google Scholar]
- Meredith E. J.; Chamba A.; Holder M. J.; Barnes N. M.; Gordon J. (2005) Close encounters of the monoamine kind: immune cells betray their nervous disposition. Immunology 115, 289–295. [DOI] [PMC free article] [PubMed] [Google Scholar]
- Pellicano C.; Buttarelli F. R.; Circella A.; Tiple D.; Giovannelli M.; Benincasa D.; Colosimo C.; Pontieri F. E. (2007) Dopamine transporter immunoreactivity in peripheral blood lymphocytes discriminates Parkinson’s disease from essential tremor. J. Neural Transm. 114, 935–938. [DOI] [PubMed] [Google Scholar]
- Zhu H.; Mavandadi S.; Coskun A. F.; Yaglidere O.; Ozcan A. (2011) Optofluidic fluorescent imaging cytometry on a cell phone. Anal. Chem. 83, 6641–6647. [DOI] [PMC free article] [PubMed] [Google Scholar]
- Zhu H.; Yaglidere O.; Su T.-W.; Tseng D.; Ozcan A. (2011) Cost-effective and compact wide-field fluorescent imaging on a cell-phone. Lab Chip 11, 315–322. [DOI] [PMC free article] [PubMed] [Google Scholar]
- Leuchter A. F.; Cook I. A.; Marangell L. B.; Gilmer W. S.; Burgoyne K. S.; Howland R. H.; Trivedi M. H.; Zisook S.; Jain R.; McCracken J. T.; Fava M.; Iosifescu D.; Greenwald S. (2009) Comparative effectiveness of biomarkers and clinical indicators for predicting outcomes of SSRI treatment in Major Depressive Disorder: Results of the BRITE-MD study. Psychiatry Res. 169, 124–131. [DOI] [PubMed] [Google Scholar]
- Givan A. L. (2012) Flow Cytometry: First Principles, 3rd ed., Wiley-Blackwell, Hoboken, NJ. [Google Scholar]
Associated Data
This section collects any data citations, data availability statements, or supplementary materials included in this article.