

Abstract
Although the trophic actions of serotonin (5-HT) are well established, only few developmental defects have been reported in mouse strains with constitutive hyposerotonergia. We analyzed postnatal growth and cortical development in three different mutant mouse strains with constitutive reductions in central 5-HT levels. We compared two previously published mouse strains with severe (−95%) depletions of 5-HT, the tryptophan hydroxylase (Tph) 2–/– mouse line and VMAT2sert-cre mice, with a new strain, in which VMAT2 deletion is driven by Pet1 (VMAT2pet1-cre) in 5-HT raphe neurons leading to partial (−75%) reduction in brain 5-HT levels. We find that normal embryonic growth and postnatal growth retardation are common features of all these mouse strains. Postnatal growth retardation varied from mild to severe according to the extent of the brain 5-HT reduction and gender. Normal growth was reinstated in VMAT2sert-cre mice by reconstituting central 5-HT stores. Growth abnormalities could not be linked to altered food intake or temperature control. Morphological study of the cerebral cortex over postnatal development showed a delayed maturation of the upper cortical layers in the VMAT2sert-cre and Tph2–/– mice, but not in the VMAT2pet1-cre mice. No changes in layer-specific gene expression or morphological alterations of barrel cortex development were found. Overall, these observations sustain the notion that central 5-HT signaling is required for the preweaning growth spurt of mouse pups. Brain development appeared to be immune to severe central 5-HT depletion for its overall growth during prenatal life, whereas reduced brain growth and delayed cortical maturation development occurred during postnatal life. Reduced developmental 5-HT signaling during postnatal development might modulate the function and fine structure of neural circuits in ways that affect adult behavior.
Keywords: Cerebral cortex, development, somatic growth, knockout mice, vesicular monoamine transporter, tryptophan hydroxylase, cux1
The monoamine serotonin (5-hydroxytryptamine, 5-HT) plays an important role in a broad range of physiological processes working as an autacoid in the periphery and as a neurotransmitter in the brain. Among its established effects are trophic actions, ranging from modulation of cell proliferation and migration to differentiation.1,2 However, at present, the most striking effects of 5-HT on brain development have been demonstrated in conditions of increased 5-HT transmission consequent to a defective clearance of this amine. Increased 5-HT-receptor activation leads to altered migration,3,4 neural circuitry refinement,5−7 and maturation of dendritic arbors.8 Pharmacological depletion of 5-HT with agents such as the 5-HT synthesis inhibitor para-chlorophenylalanine (pCPA), or the neurotoxin 5,7-dihydroxytryptamine (5,7-DHT), administered during embryonic or postnatal development, were reported to have effects on the maturation of cortical neurons9,10 and to alter barrel cortex development,11,12 although this was not confirmed in other reports.5,13 However, such pharmacological treatments are difficult to interpret because they are generally not specific in that they affect both central and peripheral sources of 5-HT and can have unwanted side effects on other amines. Moreover, their effects can vary according to the developmental period.14 Thus, genetic models offer a new way to explore the consequences of reduced 5-HT on brain development in a more selective manner.
Differences in the peripheral and central 5-HT systems have allowed the design of animal models that lack 5-HT specifically in the brain. 5-HT synthesis is mediated by tryptophan hydroxylase (TPH), which exists as two isoenzymes in vertebrates, TPH1, which is responsible for the production of peripheral 5-HT, and TPH2, which synthesizes brain-derived 5-HT.15 The existence of two independent 5-HT systems is further supported by differences in specification and determination of the serotonergic phenotype during development, with Pet1 and Lmx1b16−18 acting as determinants of serotonergic raphe neurons in the central nervous system. 5-HT storage through the vesicular monoamine transporter (VMAT) also relies on different transporters in the brain (VMAT2) and the periphery (VMAT1).19
Specific lines of mice with genetic deletion of Lmx1b, Pet1, TPH1,2 and VMAT2 have been produced in recent years, but only a few developmental defects have been reported as yet.20 There are however, converging reports of hypotrophy in several of these mutants. For instance, embryonic hypotrophy was reported in the TPH1–/– line,21 major perinatal atrophy was found in VMAT2-knockout (VMAT2–/–) mice,22 and postnatal growth retardation was noted in the Tph2–/–, Lmx1bpet1-cre, and Pet1–/– mouse lines.23−27 Here, we conducted a systematic analysis of the growth phenotype of three different mouse strains that all share constitutive reductions in brain 5-HT levels but due to different mechanisms. In Tph2–/– mice, 5-HT is no longer synthesized in the raphe23 but is still normally produced in the periphery. In VMAT2sert-cre mice, where the VMAT2 gene is selectively abolished in all SERT-expressing cells, 5-HT is normally produced but cannot be stored in synaptic vesicles, causing a profound depletion of central 5-HT stores, a partial 5-HT depletion in the blood, but unchanged 5-HT levels in the gut.28 In VMAT2pet1-cre mice, a newly characterized model described in the present study, VMAT2 gene deletion was selectively targeted to raphe neurons using the ePet1Cre mouse line where Cre recombination occurs exclusively in brain raphe neurons,29 unlike the SERTCre strain.30,31 We find that postnatal growth retardation is common to all these three mouse strains, but varies according to the extent of the 5-HT reduction. Normal growth could be reinstated by inhibition of 5-HT degradation in VMAT2sert-cre mice, further supporting a causal role of central 5-HT release in sustaining normal body growth. Morphological analyses of the development of the cerebral cortex during postnatal life showed a delayed maturation of the upper cortical layers in VMAT2sert-cre and Tph2–/– mice, but not in the VMAT2pet1-cre mice. Delayed cortical maturation could be due to delayed maturation and small scale migration of the upper cortical layer neurons causing an increase in the density of neurons, whereas layer-specific gene expression or development of the barrel cortex was unchanged.
Results and Discussion
Somatic Growth Defects
VMAT2sert-cre Mouse Line
The VMAT2sert-cre mouse line has been previously characterized as having a uniform reduction of 5-HT in all brain regions (−95% reductions) in adults.28 To evaluate 5-HT in early postnatal life, 5-HT immunocytochemistry was performed on brains of P3 and P7 pups. This showed a complete absence of 5-HT-immunostaining in the forebrain and brainstem except in the raphe, where, unlike previous observations in the adult brain,28 low level 5-HT immunostaining could be observed in cell bodies. (Supporting Information Figure 1A,B). However, no 5-HT labeling was observed in raphe neuron dendrites or axons and no vesicular accumulation of 5-HT was visible in the cell bodies. In contrast, strong 5-HT staining was still visible in cells of the pineal gland (Supporting Information Figure 1C,D).
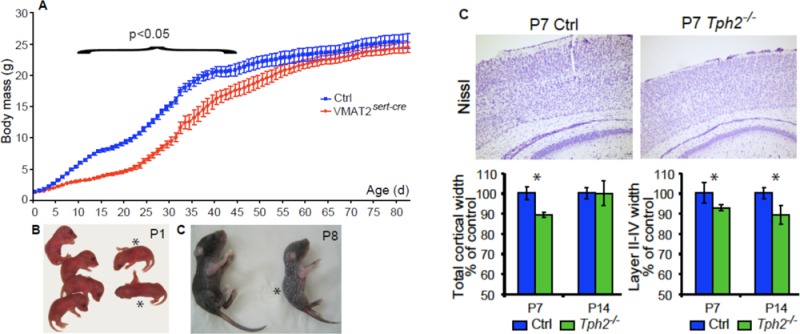
We compared the development of VMAT2sert-cre mice and control littermates born from female VMAT2lox/lox, crossed with VMAT2sert-cre or VMAT2lox/+/SERTcre/+ males. In this breeding scheme, mothers have normal serotonergic function, while embryos or pups are unable to store 5-HT. VMAT2sert-cre pups were born in normal Mendelian ratios, and were initially indistinguishable from control mice at birth and during the first two days of postnatal life (Figure 1A). However, starting at P2–P3, pups gained less weight than littermate controls, showing a clear growth retardation at P8 (Figure 1B). Growth curves conducted on several litters showed a maximal growth stunting between P15 and P30, when recombined VMAT2sert-cre pups showed more than a 50% reduction in size compared to control littermates (Figure 1C). A trend for the normalization of the growth curve was noted after weaning (after P25) (Figure 1C). A clear gender effect was also observed with more severe growth retardation in males than in females (Supporting Information Figure 2). Recovery of a normal body size was noted by two months of age in females whereas males were still 20% smaller than their WT littermates.
Figure 1.
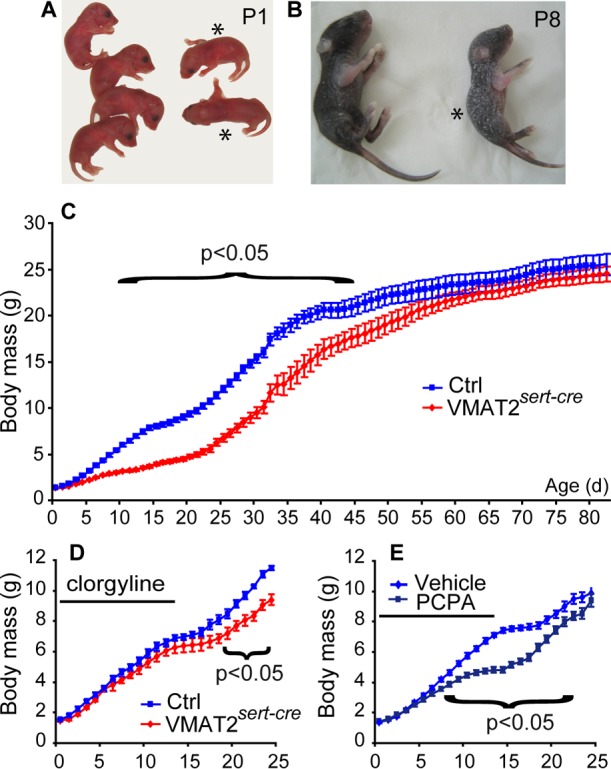
Growth phenotype of the VMAT2sert-cre mice. (A,B) Pictures of VMAT2sert-cre and control litters taken at P1 (A) and P8 (B). VMAT2sert-cre (asterisks) mice are undistinguishable from controls at P1 but growth defect becomes rapidly evident. The recombined mice are not only smaller but show dry skin and lack of adipose tissue. (C) Mean body mass curves from six litters of control (blue squares) and VMAT2sert-cre (red diamonds) pups. The growth of the VMAT2sert-cre mice becomes significantly different from that of control mice by P9, and remains different until P44 (ANOVA p < 0.05), then the VMAT2sert-cre mice progressively catch up the weight of the littermates. (D) Two mixed litters containing both control (blue squares) and VMAT2sert-cre (red diamonds) mice received clorgyline daily (10 mg/kg sc) from P1 to P14 (n = 4 of each group). The growth rate of the control and VMAT2sert-cre mice was not distinguishable during the whole duration of the treatment, but a difference reappeared 5 days after treatment discontinuation (ANOVA p < 0.05). (E) C57Bl/6 mice received daily subcutaneous injections of pCPA or saline, from P0 to 15 (n = 5 for saline and 7 for pCPA). PCPA injections caused a growth retardation that became significant from P8 on (ANOVA p < 0.05). After ending the pCPA administration, the body mass defect progressively recovered and the control and pCPA treated groups ceased to be different by P22.
Unlike previous observations in the full VMAT2–/– mice,22,32 no obvious feeding deficiency could be detected in VMAT2sert-cre mice: access to mother nipples and suckling did not differ between controls and VMAT2sert-cre mice. Milk pouches were of similar sizes during the preweaning period. The appetitive behavior of recombined mice toward diverse types of foods (palatable or standard chow) was similar as assessed by time to feed. The quantity of daily ingested food in adults has previously been found to be unchanged.28 However, other features of postnatal development appeared to be delayed, such as skin and hair growth (Figure 1C) and indices of sexual maturation.
To evaluate whether the growth defects of the VMAT2sert-cre were due to competition with WT littermates, different breeding schemes such as culling litter size or cross-breeding of mutants to mice of a Swiss background were attempted. However, observation of the corresponding mouse litters indicated that these procedures had no or minor corrective effects on growth.
To evaluate the causal role of depletion of 5-HT stores in the growth retardation phenotype, we administered a monoamine oxidase A inhibitor, which prevents the degradation of 5-HT and allows central stores of 5-HT to accumulate. We have previously shown that such treatment significantly increases 5-HT brain levels in adult VMAT2sert-cre mice, enabling 5-HT release possibly via nonvesicular mechanisms.28 Clorgyline administered daily (10 mg/kg/day) from P1 to P15, completely rescued the postnatal growth phenotype (Figure 1D). However decreased weight gain relapsed after the cessation of clorgyline treatment at P15 (Figure 1D). In converse experiments, where the 5-HT synthesis inhibitor pCPA was administered to control C57Bl/6 mice from P1 to P15, an altered growth phenotype was observed with a recovery of growth rate when pCPA was interrupted (Figure 1E).
VMAT2pet1-cre Mouse Line
Because both SERT and VMAT2 are transiently expressed in a number of glutamatergic neurons and peripheral organs during development,30 it is possible that some aspects of the phenotype observed in VMAT2sert-cre mice could be due to the deletion of VMAT2 in these cells during development. To evaluate this possibility, we carried out raphe-specific inactivation of the VMAT2 gene, using the ePet1-cre mouse line, where Cre is expressed exclusively in raphe neurons in the brain.29 VMAT2pet1-cre mice were born in normal Mendelian ratios and showed no obvious prenatal growth defect or increase in postnatal lethality in contrast to VMAT2sert-cre and Pet-1–/– neonates.24 In brain tissue homogenates, levels of 5-HT were reduced by 75% at all ages examined: E18 embryos, postnatal pups, and adults (Table 1). The reduction of brain 5-HT levels was uniform in the cortex, hippocampus, striatum, and brainstem (Table 1). No changes in brain dopamine levels were found (data not shown). The fact that the reductions in brain 5-HT levels was less than those in the VMAT2sert-cre mouse line suggested that the recombination of the VMAT2 gene in the raphe is less complete under the control of the Pet1 promoter compared to the Sert promoter. Indeed, 5-HT immunostaining showed that approximately 20% of the raphe neurons still contained strong 5-HT content with well-labeled dendrites and axons (Figure 2A). However, unlike what was noted in the Pet1–/– mice, in the VMAT2pet1-cremice33 the residual 5-HT labeled axons were uniformly distributed throughout the brain. This suggested that this pattern reflects a random incomplete recombination, rather than identifying a specific neuronal subtype within the raphe.34 Indeed, the efficiency of ePet1-Cre-induced recombination has been shown to vary according to the gene that is excised.35,36
Table 1. Brain Serotonin Levels in Developing and Adult VMAT2pet1-cre Micea.
| control | VMAT2pet1-Cre | % control | |
|---|---|---|---|
| striatum | 356 ± 2(n = 4) | 95 ± 1(n = 4) | 27%*** |
| hippocampus | 483 ± 1(n = 4) | 80 ± 1(n = 4) | 17%*** |
| cortex | 454 ± 6(n = 4) | 121 ± 2(n = 4) | 27%** |
| brain stem | 615 ± 9(n = 4) | 154 ± 5(n = 4) | 25%** |
| whole brain E18 | 157 ± 1(n = 5) | 42 ± 9(n = 2) | 27%** |
| whole brain P8 | 228 ± 2(n = 3) | 54 ± 4(n = 3) | 23%*** |
Values are expressed in ng/g tissue ± SEM. Analysis in brain regions was carried out in adult mice. For embryonic and postnatal mice, whole brains were dissected and homogenized at E18 and P8. **p < 0.01 and ***p < 0.001.
Figure 2.
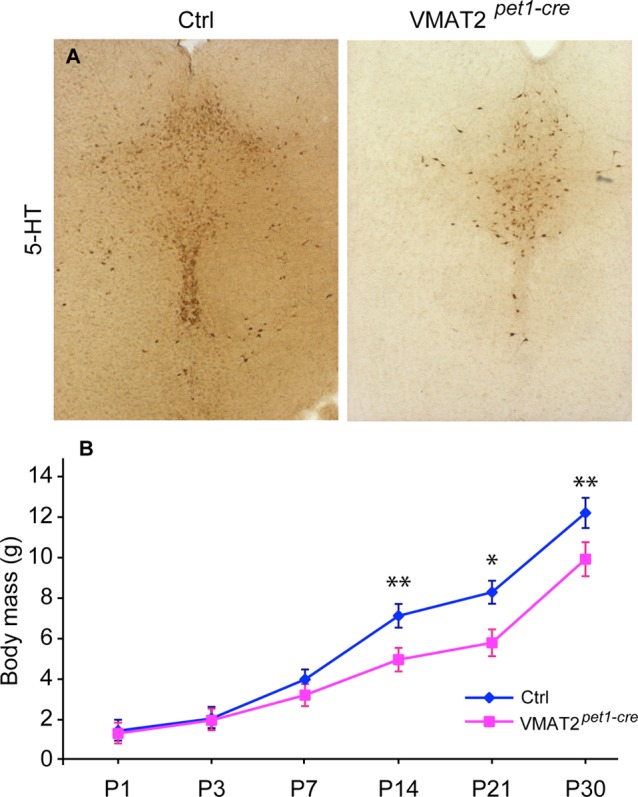
Growth phenotype of the VMAT2pet1-cre mice. (A) 5-HT immunostaining in the raphe of VMAT2pet1-cre and control mice, at P14. There is still a number of 5-HT positive neurons in the VMAT2pet1-cre mice. (B) The growth curve shows that there is a small reduction in body growth from P7 to P30 in the VMATpet1-cre mice compared to controls. Results are pooled from three different litters, n > 4 per age per genotype (*p < 0.05, **p < 0.001, two-way ANOVA).
Despite the lack of an overt growth phenotype, VMAT2pet1-cre mice showed a significant reduction in weight gain from P7 to P30 (Figure 2B). This growth retardation was fully compensated at adult stages when no differences in body weights were detected between adult VMAT2pet1-cre and littermate controls.
Tph2–/– Mouse Line
Tph2–/– mice on a mixed genetic background have been shown previously to lack brain-derived 5-HT (98% reductions in the adult brain), and to exhibit growth retardation during early postnatal life.23 Here, we evaluated whether this phenotype persists on an FVB/N background after 12 generations of backcrossing, and whether embryonic growth is also affected. Similar to a previous report,23Tph2–/– mice on an FVB/N background were born in normal Mendelian ratios and were indistinguishable from Tph2+/– littermates at birth. Analysis of late embryonic stages (E14 and E18) did not reveal skeletal, brain, body weight, or size abnormalities (Figure 3A,B). However, starting 3–4 days after birth, Tph2–/– pups were smaller in size, with decreased adipose tissue content and dry skin. This growth retardation worsened up to 4–5 weeks of age (Figure 3C) after which a normalization of the growth curve occurred.23 We showed previously that adult Tph2–/– mice exhibit alterations in body temperature control.23 To test whether altered thermoregulation plays a causal role in the observed growth abnormalities during early postnatal life, pregnant mothers were placed at an ambient temperature of 30 °C and maintained at this temperature for 2 weeks after delivery. However, increasing ambient temperature had no effect on the growth of either Tph2–/– or control pups (Figure 3E).
Figure 3.
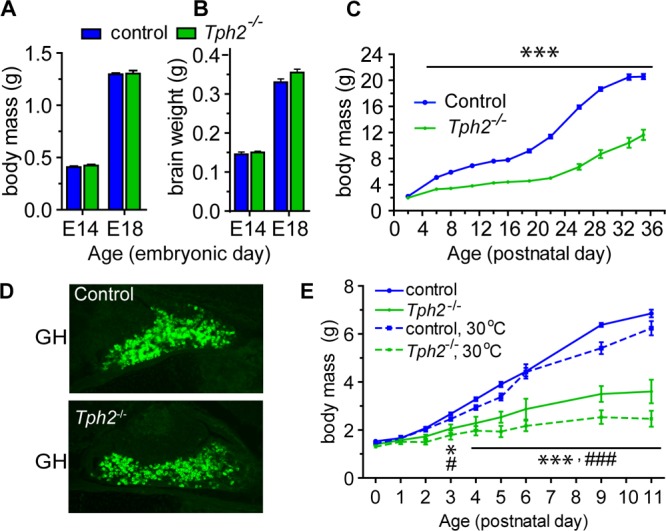
Growth retardation in the Tph2–/– mice. Embryonic growth shows no significant reduction in body mass (A) or brain weight (B) of Tph2–/– embryos compared to control littermates. E14 and E18 = embryonic days 14 and 18, respectively. (C) Postnatal growth curves of control (blue line) and Tph2–/– (green line) pups show a delay in body mass acquisition. The growth of the Tph2–/– mice becomes significantly different from that of control mice by P6 (***p < 0.001, two-way ANOVA). (D) Representative immunofluorescence images of growth hormone (GH) in the pituitary gland of 2-days old Tph2–/– and control mice. (E) Postnatal growth curves of Tph2–/– pups brought up at 30 °C degree (green dashed line) do not differ from the litters grown up at room temperature (green line) (*p < 0.05, ***p < 0.001 vs control mice raised at room temperature; #p < 0.05, ###p < 0.001 at 30 °C; two-way ANOVA).
To evaluate whether deregulation of the hypothalamic–pituitary–adrenal axis may be responsible for the observed growth phenotype, we performed gene expression profiling in the hypothalamus of newborn Tph2–/– mice. No marked alterations in the expression levels of hypothalamic transcripts were identified (data not shown). Moreover, examination of the pituitary glands in 2-day-old Tph2–/– mice revealed normal size and structure, and unaltered production of growth hormone (GH) (Figure 3D). However, the level of insulin-like growth factor 1 (IGF-1), a primary mediator of the effects of GH, was markedly decreased in the plasma of growth-retarded Tph2–/– animals at P35 (Table 2). These results suggest possible alterations in the activity of the somatotropic axis. However, indirect effects cannot be ruled out since a similar trend was observed in body weight reduction and decreased IGF-1 and leptin levels for wild type FVB/N mice brought up by mothers having reduced milk availability (Table 2). Therefore, it cannot be excluded that the effects on IGF-1 are a secondary rather than a primary cause of growth retardation.
Table 2. Metabolic Parameters in 35-Day-Old Tph2–/–, Control, and Malnourished Micea.
| BW (g) | IGF-1 (ng/mL) | leptin (pg/mL) | |
|---|---|---|---|
| control (n = 5) | 20.6 ± 0.4 | 839 ± 4 | 2930 ± 24 |
| Tph2–/–(n = 3) | 11.6 ± 1.2* | 212 ± 4** | 685 ± 38** |
| FVB/N (n = 6) | 22.0 ± 0.2 | 918 ± 4 | 6460 ± 840 |
| FVB/N malnutrition (n = 5) | 18.6 ± 0.4### | 349 ± 2### | 2430 ± 320## |
Values are expressed as mean ± SEM. *p < 0.05, **p < 0.01 Tph2–/– vs control. ##p < 0.01, ###p < 0.001 FVB/N malnutrition vs FVB/N.
Overall, the comparison of these three different models of life-long 5-HT depletion showed that delays in somatic growth are common features of these three hyposerotonergia mouse strains. However there is a clear gradation in the severity of the effects. In the VMAT2sert-cre and Tph2–/– mice where there is a massive >95% depletion in brain 5-HT, the growth curve alterations were almost identical with normal weight at birth and most pronounced growth stunting occurring during the first 3 postnatal weeks corresponding to the preweaning period. A protocol previously shown to increase brain 5-HT levels in VMAT2sert-cre mice and to normalize behavioral alterations28 was found here to normalize postnatal growth defects. However, there was a relapse in growth deficit on interruption of the treatment, suggesting a continued requirement for 5-HT at least until the weaning period commences. Indeed, in both strains, a normalization of the growth curve rates occurred after weaning. In the third mouse strain, VMAT2pet1-cre mice, which had a less pronounced depletion in 5-HT, a similar trend and temporal course of growth alterations were nevertheless observed, albeit to lesser degree. It is possible that such moderate transient growth retardation may exist in other hyposerotonergic mice, such as the R439H Tph2 knockin mice that have 80% decreases in 5-HT levels, although they were not reported to have growth abnormalities in adulthood.37 Altogether, these observations support a causal role for central rather than peripheral 5-HT depletion in determining growth retardation, as this is the common feature of the three genetic models. This is also supported by previous observations that showed growth retardation in Pet1–/– and Lmx1bpet1-cre mice, which have central 5-HT depletions due to defective development of raphe neurons.27,38
Despite the fact that all three mouse strains have life-long depletions of 5-HT, a striking common feature was the absence of visible alterations in their embryonic development, as reflected by the normal appearance and weight of embryos, and of pups at birth. This is unlike observations in mice born from Tph1–/– mothers that display altered embryonic growth suggesting the importance of maternal sources of 5-HT for normal embryonic development.21 It is thus likely that many different sources of 5-HT concur to maintain 5-HT-mediated signaling during embryonic life.14,20 Bonnin et al. provided evidence that a large part of embryonic 5-HT in the forebrain before E12 is derived from the placenta.39 Another possible explanation is that somatic growth relies on different trophic factors during embryonic and postnatal life, with embryonic growth being dependent on maternal and placental factors.40
The mechanisms involved in the delayed growth phenotype in hyposerotonergic mice remains to be elucidated as our current investigations failed to provide a straightforward explanation. The growth phenotype bears resemblance to the one caused by general malnutrition as it is associated with dry skin, lack of adipose tissue, reduction in organ size, and decreases in IGF-1 and leptin levels. However, despite their emaciated appearance, both the VMAT2sert-cre and the Tph2–/– mouse pups had filled milk pouches and appeared to suckle normally, suggesting that they had no feeding abnormalities. In the preweaning period, these mice appeared to be voraciously hungry when any food was introduced into the cage. This is unlike what has been previously observed in the constitutive VMAT2-KO mice for instance, who had clear feeding abnormalities at birth with empty milk pouches and weak suckling activity.22,32 In the latter mutants, a causal role of dopamine deficits was suggested as these mice have massive depletions of brain catecholamines, in addition to 5-HT depletions, and normal feeding was not corrected by increasing brain 5-HT levels.22 In both Tph2–/– and VMAT2sert-cre mice, procedures reducing competition among pups had beneficial effects on survival, but no visible effects on weight gain, suggesting that altered access to mothers’ nipples/milk was not a primary cause of growth alterations. Altogether this suggested that an intrinsic metabolic defect may occur in hyposerotonergic mice. Indeed, telemetric measurement indicated an impaired body temperature and altered respiratory control in Tph2–/–(23) and Pet1–/–(41) mice, which may be an indirect cause of growth alterations. However, attempts to enrich the diet or to maintain the pups in normothermia had no visible effects on the growth phenotype in the Tph2–/– mice.
A possibility to explain why decreased 5-HT causes an exclusive deficit in growth during the early postnatal period could involve the control of the somatotropic axis and growth hormone (GH) secretion. GH synthesis was not altered in Tph2–/– mice, however it is possible that secretion may be modified. Indeed, previous evidence indicated that 5-HT modulates GH release, either directly in the anterior pituitary gland (42) or indirectly via a hypothalamic control of GHRH and somatostatin (SST) secretion, which control GH release.43 GH serum levels are particularly elevated during the first postnatal weeks and 5-HT control of GH secretion appeared to be particularly marked during this period.44 This scheme could also help to explain the later normalization of the growth curve after weaning. SST is activated by 5-HT and represses GHRH, resulting in a net inhibition of GH release. This inhibitory 5-HT-SST circuit may become more important during postnatal life and could explain the compensation after weaning, since then the lack of 5-HT would derepress the secretion of GH.
Cortical Development in Hyposerotonergic Mice
To evaluate whether 5-HT depletion affects brain development, we conducted histological examination of postnatal brains in the three mouse strains. We focused on assessing cortical development because the cerebral cortex is one of the latest brain structures to mature. Moreover, clear indices of maturation, such as thickness of the cortical layers and cytoarchitectonic organization of the barrel cortex in the primary somatosensory cortex can readily be analyzed.
VMAT2sert-cre Mice
We measured body and brain weights from littermates at P3, P7, and P14; these brains were subsequently used for the histological analysis (Figure 4A,B). These data showed that there were no reductions in brain weights at P3, but a 17% reduction in brain weights occurred at P7 and P14 (Figure 4B). These reductions are less marked than body weight reductions (−40% at P7 and −70% at P14) (Figure 4A).
Figure 4.
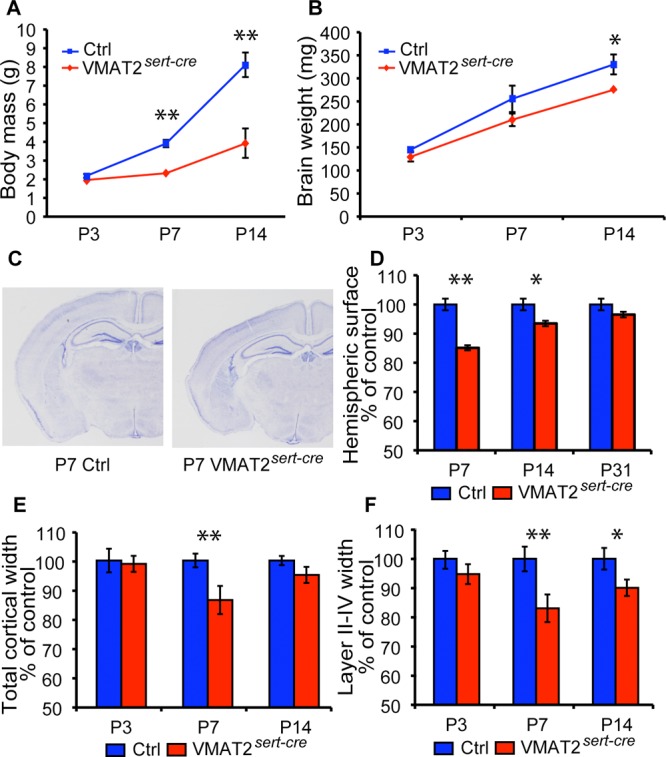
Brain growth and cortical maturation in VMAT2sert-cre mice. (A,B) Body mass and brain growth were compared in separate litters used for the histological analysis at P3, P7, and P14 (independent measures, two different litters per age). This shows that brain growth alterations are much milder than the decrease in body growth. (C,D) The size of a hemisphere was measured from coronal sections through the brain, at a level corresponding to the one showed on the micrographs (level 46 of the Paxinos atlas). This indicated a transient reduction in hemisphere areas at P7 (n = 3 controls and 4 VMAT2sert-cre) and P14 (n = 4 for each genotype) that was no longer significant at P30 (n = 3 controls and 6 VMAT2sert-cre). (E,F) The thickness of the cerebral cortex was measured in the somatosensory cortex. Values are expressed as % of control values. n = 4 for each age/genotype. Values are means ± SEM. (*p < 0.05, **p < 0.01, Student's t test).
Hemispheric size was evaluated at P3, P7, P14 and P31 from brain sections (Plate 46 of the Paxinos atlas45) (Figure 4C–F). At P3, no differences in brain size were observed, whereas at P7 and P14 a significant reduction in brain sizes was noted, which was normalized by P31 (Figure 4D).
Measures of total cortical width and the size of the supragranular layers II–IV were carried out on P3, P7, P14, and P31 brains. No differences were noted at P3 (Figure 4E), while at P7 a significant 13% reduction of cortical thickness was found. This defect in cortical growth at P7 could be essentially due to the later maturation of the supragranular cortical layers since a 17% reduction in the thickness of the upper cortical layers was found (Figure 4F), whereas layers V–VI showed more moderate reductions (11%). At P14, the reductions were less marked with a nonsignificant (5%) reduction in total cortical width, and a 10% reduction in the width of upper cortical neurons. At P31, no changes were noted in any measures of cortical width (not illustrated).
Neurons fated to populate the upper cortical layers continue migrating during the first postnatal week.46 To determine whether reduced cortical thickness at P7 could be due to delayed migration of layers II–III neurons, we performed Cux1 immunostaining, which selectively labels the upper cortical layer neurons47 and Ctip2 to label layers V–VI.48 No differences in the laminar position of Cux1-labeled (layers II–IV) and Ctip2-labeled neurons (layers V–VI) were noted in VMAT2sert-cre mice compared to control mouse brains (Figure 5). Measures of Cux1-labeled neurons on confocal sections at P7 showed a significantly increased density in layers II–IV (111%, n = 3 for VMAT2sert-cre and n = 4 for controls), mainly due to a 24% increase in the density of the most superficial neurons, the latest to mature, in an overall tendency for an increased density. (Figure 5E,F).
Figure 5.
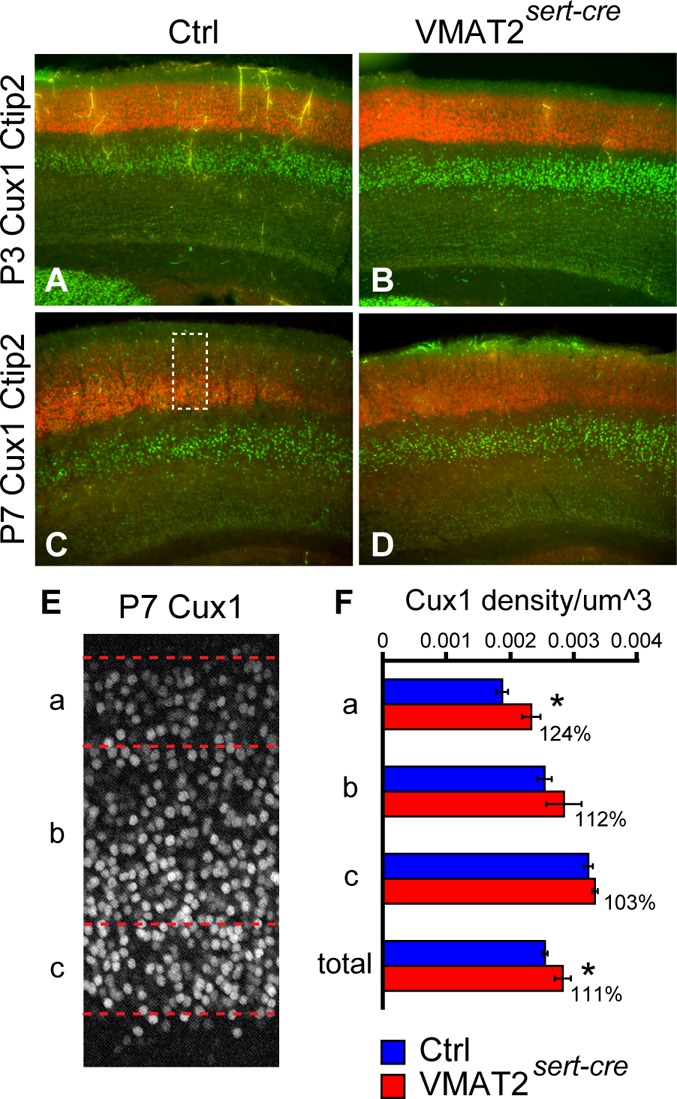
Layer specific markers in in VMAT2sert-cre mice show an increased compaction of layers II–III. (A–D) Layer-specific immunolabeling showed no change in the distribution of Ctip2, a marker of layer V neurons, and of Cux1, a marker of supragranular layers. Brain sections from littermates at P3 (A,B) and P7 (C,D) were processed in parallel and immunostained for Cux1 and Ctip2. (E,F) At P7, the cortical region containing Cux1 labeled neurons was outlined (e.g., dotted shape in C) and subdivided in three regions: the more superficial 100 μm (a), the deepest 100 μm (c), and the intermediate region (b). Cux1 neuronal density was calculated in these regions, and compared between control and VMAT2sert-cre P7 mice. The total density of Cux1 positive neurons was increased by 11% (p = 0.03), due to trend for an increased density in all regions, and particularly in the superficial region (a), where density was increased by 24% (p = 0.018).
We examined more specifically the barrel cortex whose organization is perturbed in conditions of increased 5-HT signaling.5 Somatosensory thalamocortical neurons transiently accumulate 5-HT during late embryonic and early postnatal life;14 in VMAT2sert-cre mice, no 5-HT was detectable in either thalamic neurons or their axons at P3, P7, or P10. However, thalamocortical axons showed an unchanged SERT expression compared to controls and formed normal patches that outline the whisker representation (Figure 6C,D). This normal topographic organization was also visible with other thalamocortical markers, such as vGlut2 or cytochrome oxidase (not shown). On the postsynaptic side, layer IV neurons formed normal barrel-like structures as visualized by Nissl staining or Cux1 immunostaining (Figure 6G,H). This organization, which involves a reorganization of neurons and their dendrites in layer IV, (49) was already visible by P5 in VMAT2sert-cre mice similar to littermate controls.
Figure 6.
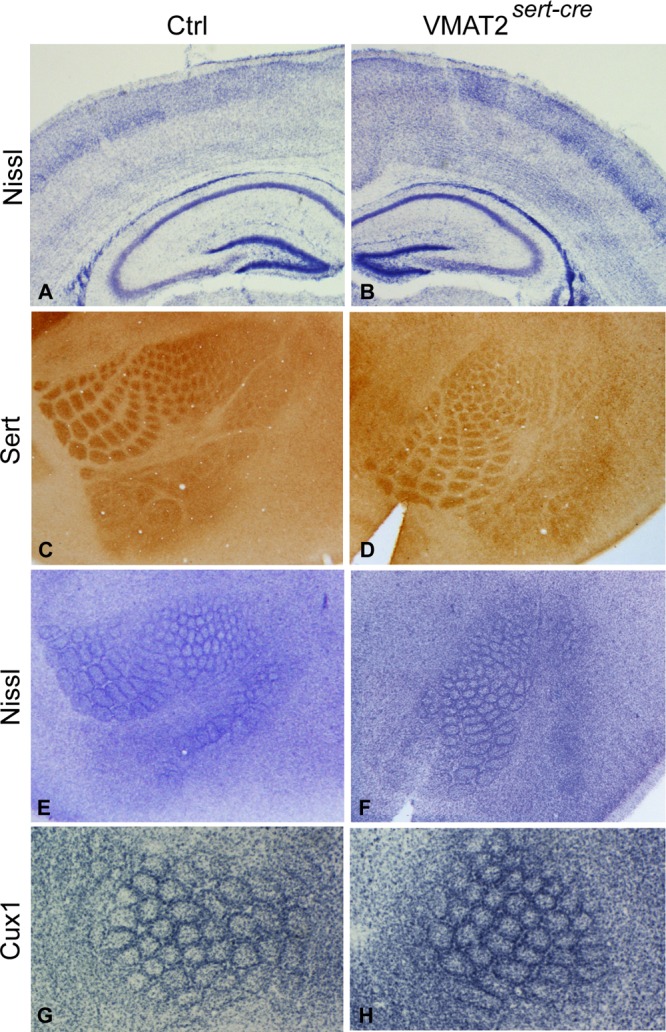
Barrel cortex in VMAT2sert-cre mice. (A,B) Coronal sections stained with Nissl from P7 control (A) and recombined (B) littermates. This shows the lack of cytoarchitectural defects in the cerebral cortex and hippocampus; a minor reduction in thickness of upper cortical layers exists in the recombined. (C,D) Flattened cortex of P10 control and VMAT2sert-cre sectioned through the somatosensory cortex and stained for SERT immunohistochemistry (C,D) showed well clustered thalamo-cortical afferents. Nissl staining (E,F) and Cux1 labeling (G,H) outlined the barrel walls in layer IV, similarly to observations in controls.
VMAT2 pet1-cre Mice
Measures of brain and cortical size were performed at P7 and P21 in VMAT2pet1-cre mice and littermate controls at time points where significant reductions in body weights were observed (Figure 2A). However, no significant effects on brain mass, thickness of the cerebral cortex or of the upper cortical layers were noted (Supporting Information Figure 3).
Tph2–/– Mice
Brain weight and cortical growth were assessed in Tph2–/– mice at P7 and P14 (Figure 7). Although no significant differences in brain weights were noted at P7, at P14 Tph2–/– brain weights were reduced by 26% compared to those in control littermates (Figure 7B). The thicknesses of the somatosensory cortex (S1) and of layers II–IV were significantly reduced by 11% and 7%, respectively, at P7 (Figure 7C). At P14, the reduction in cortical layer II–IV width was still prominent without changes in overall cortical thickness.
Figure 7.
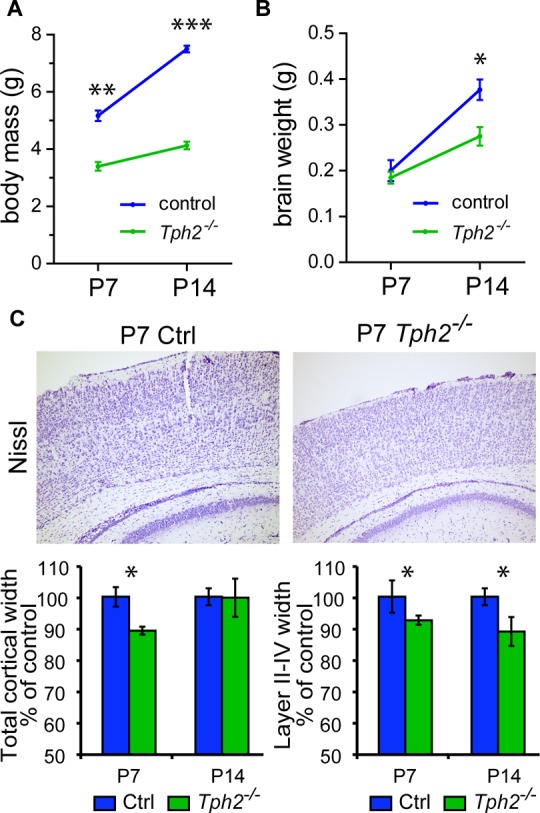
Brain growth and cortical layer maturation in Tph2–/– mice. (A) Body mass and (B) brain wight gain over the first two postnatal weeks in Tph2–/– mice. Student’s t test, *P < 0.05; n = 3 per genotype. (C) Representative Nissl staining and width measurements of the somatosensory cortex and cortical layers II–IV at P7 and P14, respectively. Cortical width was measured at the level indicated on the picture. Values are expressed as % of control. One-way ANOVA followed by Tukey’s post hoc test, *P < 0.05; n = 3 for each age/genotype. Values are means ± SEM.
Overall this characterization of cortical development in hyposerotonergic mice revealed a milder phenotype than what was anticipated from the severe somatic growth phenotype. In the VMAT2pet1-cre mice, which have 70% reductions in brain 5-HT levels, no changes in overall brain and cortical growth were noted. While in the two mouse strains with >95% 5-HT depletions (the VMAT2pet1-cre and Tph2–/– mice), the magnitude of somatic growth deficit was much greater than the brain growth deficit. This relative preservation of brain growth relative to somatic growth has been found repeatedly and is similar to observations in malnutrition.50−53 In the case of nutrient depletion, the relative preservation of brain growth to organ growth appears to be due to several mechanisms including a direct signaling of tyrosine kinases that is uncoupled from the mTOR pathway in the brain,54 or differential regulation of the IGF1 pathway in the brain.53 Thus, it appears that 5-HT would not be essential in such mechanisms preserving brain growth in the face of nutrient loss.
In terms of cortical development, the present observations suggest that the early phases of cortical development in embryonic life, such as neurogenesis and migration, are not modified by 5-HT depletion of central origin. As already discussed, it is possible that alternative embryonic sources of 5-HT, which are not targeted in the hyposerotonergic mutants, compensate for deficits in serotonin production and storage.20,39 Moreover, subtle alterations in neuronal migration or neurogenesis are likely to be missed by the present analysis which relies on global measures of cortical growth. Indeed, in previous studies where embryonic depletion of 5-HT was induced by pCPA administration, an altered migration of specific neuronal subtypes was observed, suggesting that some neuronal subtypes might be more sensitive to the effects of 5-HT depletion.10 Conversely, the current study showed that serotonin depletion in postnatal life has consistent effects as it affected the maturation of the upper cortical layers in both the VMAT2sert-cre and Tph2–/– mice, with an increased compaction of the upper cortical layers at P7. These observations are consistent with previous observations of a delayed laminar differentiation after lesions of the 5-HT pathways in neonatal rats.9 While it is difficult to disentangle a direct effect of 5-HT depletion on cortical growth from an indirect one, secondary to general growth retardation, the temporal course of both events suggests that they could be independently regulated. Indeed, overall hemispheric and cortical size normalized by P30, an age where there was still a significant growth retardation. The delay in cortical growth was most marked in the upper cortical layers which mature last during postnatal development. Protracted cell migration and dendrite maturation normally occurring during the first postnatal weeks, were both found to be modified by 5-HT depleting agents such pCPA administered during embryonic10 or 5,7-DHT in postnatal life.9,55 It will therefore be particularly interesting to analyze in greater detail the dendrite maturation of these neurons as they integrate into cortical circuits. However, it is noteworthy that despite the delayed growth of supragranular cortical layers, the maturation of layer IV neurons into barrel-like structures was not visibly altered or delayed in VMAT2sert-cre mice, confirming that 5-HT is not required for barrel patterning, in contrast with the deleterious effects of excess 5-HT on this developmental process.5,6,13,22 These results also indicate that previous observations of altered barrel development in VMAT2-KO22 or after neurotoxic lesions of 5-HT pathways9 result from other causes than lowered serotonin signaling.
Despite the lack of gross morphological defects in hyposerotonergic mice, it will be important to examine more closely neural circuit alterations that could mediate abnormal behavior in these mice. For instance, initially, studies indicated that a lack of 5-HT release had no visible effect on the development of raphe neurons nor their axonal arborization as shown in Tph2–/– mice23,25 and VMAT2sert-cre mice.28 However, more recent investigations indicated region-specific alterations in branching of raphe axons in the context of 5-HT depletion.26
Conclusion
The present study showed that selective 5-HT depletion in the brain, whether due to reduced synthesis or to lack of vesicular storage, has consistent effects on the postnatal growth spurt, while essentially sparing embryonic growth. Moreover, severe 5-HT depletion causes a mild temporary retardation in the development of the upper layers of the cerebral cortex, with increased compaction of these layers but no alterations in barrel cortex development. Based on previous investigations, one may speculate that this abnormality is mainly due to altered dendritic growth, warranting future in depth investigations of these mutants. Despite the normal cytoarchitecture of the brain in hyposerotonergic mice, it is likely that reduced 5-HT signaling modulates the structure and function of neural circuits in ways that may significantly affect the behavioral traits of these mice. Interestingly, a number of behavioral phenotypes, such as increased impulsivity and learning deficiencies that have been observed in hyposerotonergic mice are also found after growth retardation caused by malnutrition.50 It will therefore be of interest to determine whether common mechanisms underlie these alterations.
Methods
Animals
Procedures involving animals and their care were conducted in accordance with directives of the European Community (Council directive 86/609). Ethical principles and guidelines for care and use of laboratory animals (adopted by the French Agriculture and Forestry Ministry and the German local authorities) correspond to the standards prescribed by the American Physiological Society.
The conditional deletion of VMAT2 under the control of the 5-HT transporter promoter (SERT) has previously been described.28 Briefly, it was produced by crossing the VMAT2lox mouse line (generated in the Giros laboratory; full description in ref (28)) and the SERTcre mice (generated in the Hen Laboratory56), maintained on a pure C57Bl/6 background. It is referred to as the VMAT2sert-cre mouse line.
To circumvent issues related to transient SERT induced recombination in brain regions other than the raphe,31 a raphe-specific inactivation of the VMAT2 gene was produced here by crossing VMAT2lox mice with the Pet1cre mouse line (generated in the Deneris laboratory).29 As in the previous mouse line, VMAT2lox/lox:Petcre male mice were crossed to female VMAT2lox/lox to generate control and recombined mice from the same litters. The colony was maintained on a C57Bl/6 background.
The generation of Tph2-deficient (Tph2–/–) mice has been described in detail previously.23 In the present study, Tph2–/– mice were established on a FVB/N background (F12 generation backcross; Charles River, Germany). Analysis was performed in Tph2–/– and Tph2+/– littermates (referred as controls in this study), obtained from the cross of Tph2+/– females with Tph2–/– males.
All mice were maintained in individually ventilated (IVC) cages, 34 × 19 × 13 cm3 (Techniplast), at an ambient temperature of 22 °C, under a standard 12 h light/dark cycle with free access to standard chow and drinking water ad libitum. The Tph2-deficient mice were maintained at the animal facility of MDC (Berlin, Germany), while the VMAT2sert-cre and VMAT2Pet1-cre mice were raised in a conventional animal house at the Institut du Fer à Moulin (Paris, France). In addition to these lines, control C57Bl/6 mice purchased from Charles Rivers were used for pharmacological studies with pCPA.
Histological Analysis
Procedures differed slightly in the two associated laboratories that jointly did this analysis. Mice with conditional VMAT2 deletion were perfused transcardially at postnatal day (P)3, P7, P14, P21, and P30. Brain weight was measured after extraction. All brains were post fixed overnight in 4% paraformaldehyde, cryoprotected and serially sectioned. Frozen brains were cut on a freezing microtome to 60 μm thick sections. Alternate series were used for Nissl and cytochrome oxidase analysis, immunohistochemistry, and in situ hybridization. Immunostaining was done for 5-HT (1:50000, Sigma), rabbit anti-CDP/Cux1 (1:500, Santa-Cruz) to label cortical layers II–IV, and rat anti-Ctip2 (1:500, clone 25B6, Abcam) to label layers V–VI. Immunohistochemistry using fluorescent or horseradish peroxidase secondary antisera were performed as described.28 Low power images were collected on a stereomicroscope (Olympus), and high power images on an Olympus (Provis) BX51 microscope. For postprocessing of some images PHOTOSHOP (Adobe Systems, Santa Clara, CA) was used.
Mice with Tph2-deletion were deeply anesthetized with isoflurane (Forane, Abbott, Wiesbaden-Delkenheim, Germany) and decapitated. Brains were removed from the skulls, weighed, post fixed in 4% paraformaldehyde at 4 °C overnight, and cryoprotected in 30% sucrose. Sequential 14 μm coronal sections were cut on a cryostat (Leica CM3050S, Leica Microsystems, Wetzlar, Germany) and applied on glass slides. Sections were stained with cresyl violet for Nissl analysis. Three images and measurements were taken from both hemispheres of three animals for each genotype, and analysis of cortical thickness was performed using BII-Analysis (Keyence Microscope, BZ-9000 Series, Germany).
For the analysis of pituitary glands in 2-day-old Tph2-deficient mice, the same procedure was used as above but postfixation in 4% paraformaldehyde was done for 4 h followed by 2 h 30% sucrose. After a short wash in PBS, heads were embedded in Tissue-Tek O.C.T compound (Tissue-Tek, Sakura Finetek, Torrance, CA) and cryosectioned in 14 μm coronal sections. Sections were dried for 2 h at room temperature and then stored at −80 °C. For immunohistochemistry, tissues were washed in PBS followed by PBST, and blocked with 10% normal donkey serum (Jackson Immuno Research laboratories, West Grove, PA). Slides were incubated overnight at 4 °C with polyclonal rabbit antigrowth hormone (1:1000, Millipore Schwalbach/Ts., Germany). Anti-rabbit IgG secondary antibody conjugated with AlexaFluor488 (1:1000, Invitrogen, Darmstadt, Germany) was applied the next day. Fluorescence images were collected using a Leica DMI600B microscope and processed with Leica Application Suit software (version 4.3).
Growth Curves and Brain Morphology Analysis
Litters were examined daily to measure weight gain and behavioral changes. Drugs or saline were administered subcutaneously: clorgyline (10 mg/kg/day), pCPA (100 mg/kg/day). For the analysis of embryonic stages, animals were mated, and females were checked for the presence of vaginal plug on the next morning. Embryos were dissected on E14 and E18, and weighed (the day of plug was taken as day 0.5).
Sizes of brain areas and cortical layers size were measured on Nissl or immunostained cortical sections. To measure the surface of a hemisphere, the midline was drawn and the outer surface of the brain was outlined using ImageJ software, to calculate the hemisphere surface. Two to three sections were analyzed at the level of the Figure 46 of the Paxinos atlas45 to compute a mean for each case.
Cortical layer thickness was measured on higher power pictures of the somatosensory cerebral cortex (X1.2) stained with Nissl. The layer II–VI cortical distance was measured using ImageJ. The bottom of layer IV was clearly visible both on Nissl staining and immunohistochemistry pictures, since Cux1 expression is limited to layer II–IV, and the somatosensory cortex layer IV and V cytoarchitecture are clearly different on Nissl staining. The layer II–IV distance was measured and considered as “superficial layer”. Two measurements from each of the two hemispheres were done for each brain and averaged.
Confocal 2 μm thick sections through the primary somatosensory cortex were acquired on a Leica TCS (×16) microscope, keeping the same constants (laser power, pinhole) for acquisition of the 7 cases analyzed (n = 3 KO, n = 4 ctrl). All Cux1-labeled nuclei were counted within a 100 μm thick wide column spanning through the somatosensory cortex. All Cux1-labeled nuclei were counted within each of these columns using the cell counter ImageJ plug-in. Cux1 positive neurons volumetric density was calculated from these results.
IGF-1 and Leptin Measurements
IGF-1 and leptin levels were evaluated at postnatal day 35. Animals were anesthetized with ketamine (100 mg/kg) and xylazine (10 mg/kg) intraperitoneal (i.p.) injections. Blood was taken transcardially. Twenty-five microliters of serum were used for IGF-1 measurement using a commercially available EIA kit (DSL-10-29000, Diagnostic Systems Laboratories). Fifty microliters of serum was used for the leptin measurement using a commercially available Leptin Kit (R&D, Cat.N. MOB00, Abington, U.K.).
High-Performance Liquid Chromatography for the Analysis of Monoamines
Following decapitation, brains were removed from the skulls and the hippocampus, striatum, prefrontal cortex, and midbrain were rapidly isolated on ice. After weighing, the tissue was homogenized and deproteinized in 300 μL of 0.2 N perchloric acid solution (500 μL for the midbrain). The homogenate was centrifuged at 15 000 rpm for 30 min at 4 °C, and the supernatant was stored at −80 °C. Neurotransmitters analysis was performed by high-performance liquid chromatography (HPLC) with a coulometric detector, as previously described (Doly et al., 2008) with minor modifications. Briefly, samples were appropriately diluted and injected into an HPLC system that consisted of a pump linked to an automatic injector (ESA model 542 autosampler, Chelmsford, MA), a reverse-phase column (MD-150 × 2 C18; 3 μm, 150 × 2 mm; ESA, Chelmsford, MA), and a coulometric detector (Coulochem III; ESA, Chelmsford, MA) with a 5014B cell to quantify tissue levels of 5-hydroxytryptamine (5-HT) and dopamine (DA). The composition of the mobile phase was 0.1 M NaH2PO4, 0.1 mM Na2EDTA, 1.5 mM octyl sodium sulfate, 0.25 mM triethylamine, and 10% (v/v) methanol and 5% (v/v) acetonitrile, pH 2.9. The sensitivity of the assay was tested for each series of samples using external standards. The first electrode was set at −175 mV and the second electrode at +175 mV. The gain of the detector was set at 500 pA. The signal of the second electrode was used to quantify all compounds by comparison of the area under the peaks with the area of reference standards with specific HPLC software (Azur, version 4.6, Datalys, France). The flow rate was set at 0.7 mL/min.
Acknowledgments
We thank Xiaoxi Zhuang and René Hen for the SERTϖ–Cre mouse line. We thank Aude Muzerelle for technical help.
Glossary
Abbreviations
- VMAT2
vesicular monoamine transporter
- 5-HT
serotonin
- Tph
tryptophan hydroxylase
- SERT
serotonin transporter
- pCPA
para-chlorophenylalanine
- 5,7-DHT
5,7-dihydroxytryptamine.
Supporting Information Available
Additional figures as described in the text. This material is available free of charge via the Internet at http://pubs.acs.org.
Funding for this project was from Agence Nationale de la Recherche (ANR605-neur-046), Foundation Jerome Lejeune, from the European Commission (FP7-health-2007-A-201714), and from German Academic Exchange Service (DAAD) (A07/99669).
The authors declare no competing financial interest.
Author Contributions
▽ Equal contribution.
Supplementary Material
References
- Buznikov G. A.; Lambert H. W.; Lauder J. M. (2001) Serotonin and serotonin-like substances as regulators of early embryogenesis and morphogenesis. Cell Tissue Res. 305, 177–186. [DOI] [PubMed] [Google Scholar]
- Gaspar P.; Cases O.; Maroteaux L. (2003) The developmental role of serotonin: news from mouse molecular genetics. Nat. Rev. Neurosci. 4, 1002–1012. [DOI] [PubMed] [Google Scholar]
- Moiseiwitsch J. R.; Lauder J. M. (1995) Serotonin regulates mouse cranial neural crest migration. Proc. Natl. Acad. Sci. U.S.A. 92, 7182–7186. [DOI] [PMC free article] [PubMed] [Google Scholar]
- Riccio O.; Jacobshagen M.; Golding B.; Vutskits L.; Jabaudon D.; Hornung J. P.; Dayer A. G. (2011) Excess of serotonin affects neocortical pyramidal neuron migration. Transl. Psychiatry 1, e47. [DOI] [PMC free article] [PubMed] [Google Scholar]
- Cases O.; Vitalis T.; Seif I.; De Maeyer E.; Sotelo C.; Gaspar P. (1996) Lack of barrels in the somatosensory cortex of monoamine oxidase A-deficient mice: role of a serotonin excess during the critical period. Neuron 16, 297–307. [DOI] [PubMed] [Google Scholar]
- Salichon N.; Gaspar P.; Upton A. L.; Picaud S.; Hanoun N.; Hamon M.; De Maeyer E.; Murphy D. L.; Mossner R.; Lesch K. P.; Hen R.; Seif I. (2001) Excessive activation of serotonin (5-HT) 1B receptors disrupts the formation of sensory maps in monoamine oxidase a and 5-ht transporter knock-out mice. J. Neurosci. 21, 884–896. [DOI] [PMC free article] [PubMed] [Google Scholar]
- Simpson K. L.; Weaver K. J.; de Villers-Sidani E.; Lu J. Y.; Cai Z.; Pang Y.; Rodriguez-Porcel F.; Paul I. A.; Merzenich M.; Lin R. C. (2011) Perinatal antidepressant exposure alters cortical network function in rodents. Proc. Natl. Acad. Sci. U.S.A. 108, 18465–18470. [DOI] [PMC free article] [PubMed] [Google Scholar]
- Smit-Rigter L. A.; Noorlander C. W.; von Oerthel L.; Chameau P.; Smidt M. P.; van Hooft J. A. (2012) Prenatal fluoxetine exposure induces life-long serotonin 5-HT(3) receptor-dependent cortical abnormalities and anxiety-like behaviour. Neuropharmacology 62, 865–870. [DOI] [PubMed] [Google Scholar]
- Osterheld-Haas M. C.; Hornung J. P. (1996) Laminar development of the mouse barrel cortex: effects of neurotoxins against monoamines. Exp. Brain Res. 110, 183–195. [DOI] [PubMed] [Google Scholar]
- Vitalis T.; Cases O.; Passemard S.; Callebert J.; Parnavelas J. G. (2007) Embryonic depletion of serotonin affects cortical development. Eur. J. Neurosci. 26, 331–344. [DOI] [PubMed] [Google Scholar]
- Bennett-Clarke C. A.; Hankin M. H.; Leslie M. J.; Chiaia N. L.; Rhoades R. W. (1994) Patterning of the neocortical projections from the raphe nuclei in perinatal rats: investigation of potential organizational mechanisms. J. Comp. Neurol. 348, 277–290. [DOI] [PubMed] [Google Scholar]
- Blue M. E.; Erzurumlu R. S.; Jhaveri S. (1991) A comparison of pattern formation by thalamocortical and serotonergic afferents in the rat barrel field cortex. Cereb. Cortex 1, 380–389. [DOI] [PubMed] [Google Scholar]
- Persico A. M.; Altamura C.; Calia E.; Puglisi-Allegra S.; Ventura R.; Lucchese F.; Keller F. (2000) Serotonin depletion and barrel cortex development: impact of growth impairment vs. serotonin effects on thalamocortical endings. Cereb. Cortex 10, 181–191. [DOI] [PubMed] [Google Scholar]
- van Kleef E. S.; Gaspar P.; Bonnin A. (2012) Insights into the complex influence of 5-HT signaling on thalamocortical axonal system development. Eur. J. Neurosci. 35, 1563–1572. [DOI] [PMC free article] [PubMed] [Google Scholar]
- Walther D. J.; Bader M. (2003) A unique central tryptophan hydroxylase isoform. Biochem. Pharmacol. 66, 1673–1680. [DOI] [PubMed] [Google Scholar]
- Cheng L.; Chen C. L.; Luo P.; Tan M.; Qiu M.; Johnson R.; Ma Q. (2003) Lmx1b, Pet-1, and Nkx2.2 coordinately specify serotonergic neurotransmitter phenotype. J. Neurosci. 23, 9961–9967. [DOI] [PMC free article] [PubMed] [Google Scholar]
- Hendricks T.; Francis N.; Fyodorov D.; Deneris E. S. (1999) The ETS domain factor Pet-1 is an early and precise marker of central serotonin neurons and interacts with a conserved element in serotonergic genes. J. Neurosci. 19, 10348–10356. [DOI] [PMC free article] [PubMed] [Google Scholar]
- Kiyasova V.; Gaspar P. (2011) Development of raphe serotonin neurons from specification to guidance. Eur. J. Neurosci. 34, 1553–1562. [DOI] [PubMed] [Google Scholar]
- Erickson J. D.; Schafer M. K.; Bonner T. I.; Eiden L. E.; Weihe E. (1996) Distinct pharmacological properties and distribution in neurons and endocrine cells of two isoforms of the human vesicular monoamine transporter. Proc. Natl. Acad. Sci. U.S.A. 93, 5166–5171. [DOI] [PMC free article] [PubMed] [Google Scholar]
- Trowbridge S.; Narboux-Neme N.; Gaspar P. (2011) Genetic models of serotonin (5-HT) depletion: what do they tell us about the developmental role of 5-HT?. Anat Rec (Hoboken) 294, 1615–1623. [DOI] [PubMed] [Google Scholar]
- Cote F.; Fligny C.; Bayard E.; Launay J. M.; Gershon M. D.; Mallet J.; Vodjdani G. (2007) Maternal serotonin is crucial for murine embryonic development. Proc. Natl. Acad. Sci. U.S.A. 104, 329–334. [DOI] [PMC free article] [PubMed] [Google Scholar]
- Alvarez C.; Vitalis T.; Fon E. A.; Hanoun N.; Hamon M.; Seif I.; Edwards R.; Gaspar P.; Cases O. (2002) Effects of genetic depletion of monoamines on somatosensory cortical development. Neuroscience 115, 753–764. [DOI] [PubMed] [Google Scholar]
- Alenina N.; Kikic D.; Todiras M.; Mosienko V.; Qadri F.; Plehm R.; Boye P.; Vilianovitch L.; Sohr R.; Tenner K.; Hortnagl H.; Bader M. (2009) Growth retardation and altered autonomic control in mice lacking brain serotonin. Proc. Natl. Acad. Sci. U.S.A. 106, 10332–10337. [DOI] [PMC free article] [PubMed] [Google Scholar]
- Erickson J. T.; Shafer G.; Rossetti M. D.; Wilson C. G.; Deneris E. S. (2007) Arrest of 5HT neuron differentiation delays respiratory maturation and impairs neonatal homeostatic responses to environmental challenges. Respir. Physiol. Neurobiol. 159, 85–101. [DOI] [PMC free article] [PubMed] [Google Scholar]
- Gutknecht L.; Waider J.; Kraft S.; Kriegebaum C.; Holtmann B.; Reif A.; Schmitt A.; Lesch K. P. (2008) Deficiency of brain 5-HT synthesis but serotonergic neuron formation in Tph2 knockout mice. J. Neural Transm. 115, 1127–1132. [DOI] [PubMed] [Google Scholar]
- Migliarini S., Pacini G., Pelosi B., Lunardi G., and Pasqualetti M. (2012) Lack of brain serotonin affects postnatal development and serotonergic neuronal circuitry formation. Mol. Psychiatry, DOI: 10.1038/mp.2012.128. [DOI] [PubMed] [Google Scholar]
- Hodges M. R.; Wehner M.; Aungst J.; Smith J. C.; Richerson G. B. (2009) Transgenic mice lacking serotonin neurons have severe apnea and high mortality during development. J. Neurosci. 29, 10341–10349. [DOI] [PMC free article] [PubMed] [Google Scholar]
- Narboux-Neme N.; Sagne C.; Doly S.; Diaz S. L.; Martin C. B.; Angenard G.; Martres M. P.; Giros B.; Hamon M.; Lanfumey L.; Gaspar P.; Mongeau R. (2011) Severe serotonin depletion after conditional deletion of the vesicular monoamine transporter 2 gene in serotonin neurons: neural and behavioral consequences. Neuropsychopharmacology 36, 2538–2550. [DOI] [PMC free article] [PubMed] [Google Scholar]
- Scott M. M.; Krueger K. C.; Deneris E. S. (2005) A differentially autoregulated Pet-1 enhancer region is a critical target of the transcriptional cascade that governs serotonin neuron development. J. Neurosci. 25, 2628–2636. [DOI] [PMC free article] [PubMed] [Google Scholar]
- Lebrand C.; Cases O.; Wehrle R.; Blakely R. D.; Edwards R. H.; Gaspar P. (1998) Transient developmental expression of monoamine transporters in the rodent forebrain. J. Comp. Neurol. 401, 506–524. [PubMed] [Google Scholar]
- Narboux-Neme N.; Pavone L. M.; Avallone L.; Zhuang X.; Gaspar P. (2008) Serotonin transporter transgenic (SERTcre) mouse line reveals developmental targets of serotonin specific reuptake inhibitors (SSRIs). Neuropharmacology 55, 994–1005. [DOI] [PubMed] [Google Scholar]
- Fon E. A.; Pothos E. N.; Sun B. C.; Killeen N.; Sulzer D.; Edwards R. H. (1997) Vesicular transport regulates monoamine storage and release but is not essential for amphetamine action. Neuron 19, 1271–1283. [DOI] [PubMed] [Google Scholar]
- Kiyasova V.; Fernandez S. P.; Laine J.; Stankovski L.; Muzerelle A.; Doly S.; Gaspar P. (2011) A genetically defined morphologically and functionally unique subset of 5-HT neurons in the mouse raphe nuclei. J. Neurosci. 31, 2756–2768. [DOI] [PMC free article] [PubMed] [Google Scholar]
- Gaspar P.; Lillesaar C. (2012) Probing the diversity of serotonin neurons. Philos. Trans. R. Soc. London, Ser. B 367, 2382–2394. [DOI] [PMC free article] [PubMed] [Google Scholar]
- Fox S. R.; Deneris E. S. (2012) Engrailed is required in maturing serotonin neurons to regulate the cytoarchitecture and survival of the dorsal raphe nucleus. J. Neurosci. 32, 7832–7842. [DOI] [PMC free article] [PubMed] [Google Scholar]
- Liu C.; Maejima T.; Wyler S. C.; Casadesus G.; Herlitze S.; Deneris E. S. (2010) Pet-1 is required across different stages of life to regulate serotonergic function. Nat. Neurosci. 13, 1190–1198. [DOI] [PMC free article] [PubMed] [Google Scholar]
- Beaulieu J. M.; Zhang X.; Rodriguiz R. M.; Sotnikova T. D.; Cools M. J.; Wetsel W. C.; Gainetdinov R. R.; Caron M. G. (2008) Role of GSK3 beta in behavioral abnormalities induced by serotonin deficiency. Proc. Natl. Acad. Sci. U.S.A. 105, 1333–1338. [DOI] [PMC free article] [PubMed] [Google Scholar]
- Hendricks T. J.; Fyodorov D. V.; Wegman L. J.; Lelutiu N. B.; Pehek E. A.; Yamamoto B.; Silver J.; Weeber E. J.; Sweatt J. D.; Deneris E. S. (2003) Pet-1 ETS gene plays a critical role in 5-HT neuron development and is required for normal anxiety-like and aggressive behavior. Neuron 37, 233–247. [DOI] [PubMed] [Google Scholar]
- Bonnin A.; Goeden N.; Chen K.; Wilson M. L.; King J.; Shih J. C.; Blakely R. D.; Deneris E. S.; Levitt P. (2011) A transient placental source of serotonin for the fetal forebrain. Nature 472, 347–350. [DOI] [PMC free article] [PubMed] [Google Scholar]
- Sferruzzi-Perri A. N.; Owens J. A.; Pringle K. G.; Roberts C. T. (2011) The neglected role of insulin-like growth factors in the maternal circulation regulating fetal growth. J. Physiol. 589, 7–20. [DOI] [PMC free article] [PubMed] [Google Scholar]
- Hodges M. R.; Tattersall G. J.; Harris M. B.; McEvoy S. D.; Richerson D. N.; Deneris E. S.; Johnson R. L.; Chen Z. F.; Richerson G. B. (2008) Defects in breathing and thermoregulation in mice with near-complete absence of central serotonin neurons. J. Neurosci. 28, 2495–2505. [DOI] [PMC free article] [PubMed] [Google Scholar]
- Papageorgiou A.; Denef C. (2007) Stimulation of growth hormone release by 5-hydroxytryptamine (5-HT) in cultured rat anterior pituitary cell aggregates: evidence for mediation by 5-HT2B, 5-HT7, 5-HT1B, and ketanserin-sensitive receptors. Endocrinology 148, 4509–4522. [DOI] [PubMed] [Google Scholar]
- Smythe G. A.; Brandstater J. F.; Lazarus L. (1975) Serotoninergic control of rat growth hormone secretion. Neuroendocrinology 17, 245–257. [DOI] [PubMed] [Google Scholar]
- Stuart M.; Lazarus L.; Smythe G. A.; Moore S.; Sara V. (1976) Biogenic amine control of growth hormone secretion in the fetal and neonatal rat. Neuroendocrinology 22, 337–342. [DOI] [PubMed] [Google Scholar]
- Paxinos G. (2001) The mouse brain in stereotaxic coordinates, 2nd ed., Academic Press, San Diego. [Google Scholar]
- Angevine J. B. Jr.; Sidman R. L. (1961) Autoradiographic study of cell migration during histogenesis of cerebral cortex in the mouse. Nature 192, 766–768. [DOI] [PubMed] [Google Scholar]
- Ferrere A.; Vitalis T.; Gingras H.; Gaspar P.; Cases O. (2006) Expression of Cux-1 and Cux-2 in the developing somatosensory cortex of normal and barrel-defective mice. Anat. Rec., Part A 288, 158–165. [DOI] [PubMed] [Google Scholar]
- Arlotta P.; Molyneaux B. J.; Chen J.; Inoue J.; Kominami R.; Macklis J. D. (2005) Neuronal subtype-specific genes that control corticospinal motor neuron development in vivo. Neuron 45, 207–221. [DOI] [PubMed] [Google Scholar]
- Erzurumlu R. S.; Gaspar P. (2012) Development and critical period plasticity of the barrel cortex. Eur. J. Neurosci. 35, 1540–1553. [DOI] [PMC free article] [PubMed] [Google Scholar]
- Alamy M.; Bengelloun W. A. (2012) Malnutrition and brain development: an analysis of the effects of inadequate diet during different stages of life in rat. Neurosci. Biobehav. Rev. 36, 1463–1480. [DOI] [PubMed] [Google Scholar]
- Bedi K. S. (1991) Effects of undernutrition during early life on granule cell numbers in the rat dentate gyrus. J. Comp. Neurol. 311, 425–433. [DOI] [PubMed] [Google Scholar]
- Bedi K. S. (1994) Undernutrition of rats during early life does not affect the total number of cortical neurons. J. Comp. Neurol. 342, 596–602. [DOI] [PubMed] [Google Scholar]
- Calikoglu A.; Karayal A.; D’Ercole A. (2001) Nutritional regulation of IGF-I expression during brain development in mice. Pediatr. Res. 49, 197–202. [DOI] [PubMed] [Google Scholar]
- Cheng L. Y.; Bailey A. P.; Leevers S. J.; Ragan T. J.; Driscoll P. C.; Gould A. P. (2011) Anaplastic lymphoma kinase spares organ growth during nutrient restriction in Drosophila. Cell 146, 435–447. [DOI] [PubMed] [Google Scholar]
- Durig J.; Hornung J. P. (2000) Neonatal serotonin depletion affects developing and mature mouse cortical neurons. NeuroReport 11, 833–837. [DOI] [PubMed] [Google Scholar]
- Zhuang X.; Masson J.; Gingrich J. A.; Rayport S.; Hen R. (2005) Targeted gene expression in dopamine and serotonin neurons of the mouse brain. J. Neurosci. Methods 143, 27–32. [DOI] [PubMed] [Google Scholar]
Associated Data
This section collects any data citations, data availability statements, or supplementary materials included in this article.