

Abstract
Background
Few studies simultaneously investigated lipids and lipoprotein biomarkers as predictors of ischemic stroke. The value of these biomarkers as independent predictors of ischemic stroke remains controversial.
Methods
We conducted a prospective nested case-control study among postmenopausal women from the Women’s Health Initiative Observational Study to assess the relationship between fasting lipids (total cholesterol, LDL-C, HDL-C, and triglycerides), lipoproteins (LDL, HDL and VLDL particle number and size, IDL particle number, and lipoprotein [a]) and risk of ischemic stroke. Among women free of stroke at baseline, 774 ischemic stroke patients were matched according to age and race to controls using a 1:1 ratio.
Results
In bivariate analysis, baseline triglycerides (P<0.001), IDL particles (P<0.01), LDL particles (P<0.01), VLDL triglyceride (P<0.001), VLDL particles (P<0.01), VLDL size (P<0.001), LDL size (P=0.03), and total/HDL cholesterol ratio (P<0.01) were significantly higher among women with incident ischemic stroke, while levels of HDL-C (P<0.01) and HDL size (P<0.01) were lower. No significant baseline difference for total cholesterol (P=0.15), LDL-C (P=0.47), and lipoprotein (a) (P=0.11) was observed. In multivariable analysis, triglycerides, (OR for the highest vs lowest quartile, 1.56; 95% CI, 1.13-2.17, P for trend =0.02), VLDL size (OR 1.59, 95% CI, 1.10-2.28, P for trend =0.03) and IDL particle number (OR 1.46, 95% CI, 1.04-2.04, P for trend =0.02) were significantly associated with ischemic stroke.
Conclusion
Among a panel of lipid and lipoprotein biomarkers, baseline triglycerides, VLDL size and IDL particle number were significantly associated with incident ischemic stroke in postmenopausal women.
Keywords: Lipids, Lipoproteins, Ischemic Stroke, Women, Triglycerides
Dyslipidemia plays an essential role in the initiation and progression of atherosclerosis and its clinical consequences.1-3 An abundance of data supports the relationship between abnormal lipid and lipoprotein biomarkers and the development of atherosclerosis and ischemic heart disease.4-8 Standard lipid testing, supported by the National Cholesterol Education Program, the United States Preventative Services Task Force, and the American Heart Association/ American College of Cardiology, includes total cholesterol, HDL-C, and LDL-C.9-11 Several lipid and lipoprotein biomarkers have been proposed as potential risk factors for improved detection of subclinical disease.12-14 In particular, clinical interest has focused on emerging lipoprotein parameters such as LDL and HDL particle number and size, IDL particle number, and lipoprotein (a). Direct comparisons of the magnitude of predictive value associated with each of these parameters have been rare. Furthermore, it is controversial whether any of these biomarkers has independent prognostic value.
Studies evaluating the relationship between lipid biomarkers and the risk of stroke have reported varied associations.15-24 Much of the discrepancy may be based on differences in methodology, population studied and differences of endpoints analyzed. In a large evaluation of 45 observational studies15, total cholesterol was associated with stroke only in participants under 45 years of age. More recent reports have noted a small but significant association between established lipid biomarkers and risk of ischemic stroke.17, 20 Importantly, most studies used a combined endpoint of all stroke, either predominantly or exclusively enrolled men, and only evaluated established lipid biomarkers, including total cholesterol, HDL-C and LDL-C. A report from the Women’s Health Study20 demonstrated a significant association of total and LDL-C with future ischemic stroke, but triglycerides and lipoprotein biomarkers were not evaluated. Recent data suggest that triglycerides are independently associated with the risk of stroke.21 Since no prior study examined relations of all of these lipid and lipoprotein biomarkers with the risk of stroke in a single cohort, the relative usefulness of each biomarker is unknown.
We prospectively examined the association between lipid and lipoprotein biomarkers and the risk of ischemic stroke among postmenopausal women in a nested case-control analysis.
Methods
Study Participants
Study subjects were all participants in the Hormones and Biomarkers Predicting Stroke (HaBPS) Study, a prospective, case-control study of 972 ischemic stroke subjects and 972 matched control subjects nested within the Women’s Health Initiative Observational Study (WHI-OS). The design and methods of the WHI-OS have been described in detail previously.25, 26 Briefly, the WHI-OS, conducted in 40 clinical centers across the United States, was designed to examine the impact of a number of factors on many of the major causes of morbidity and mortality in postmenopausal women. Women eligible for the study were 50-79 years of age at baseline, were postmenopausal, had no medical conditions associated with a predicted survival of less than 3 years, and provided informed consent to be a part of the study, as approved by the institutional review boards. Women were enrolled into the WHI-OS from 1993 through 1998. The stroke cases and controls in the present study come from the 93,676 women enrolled in WHI-OS, with mean follow-up in controls of 7.9 years, standard deviation (SD)=1.3 years and range from 1.9 to 10.5 years.
Of the 93,676 participants in the WHI-OS, 10,458 were excluded from consideration for the HaBPS study: 9,831 did not meet the eligibility criteria of HaBPS which were no prior history of myocardial infarction (MI) or stroke and adequate blood sample available for the biomarker assays. In addition, 627 participants with a locally adjudicated ischemic stroke were not adjudicated by central adjudication at the time of this study and were therefore excluded as cases or controls. The first confirmed 972 ischemic stroke cases were identified from among the 82,591 remaining participants. Control selection was done in a time-forward manner, selecting one control for each case from the risk set at the time of the case’s event. Matching was performed on age at screening (+/- 2 years), race/ethnicity, date of study enrollment (+/-3 months), and follow-up time (control follow-up time>=case follow-up time). Race/ethnicity was matched exactly, and the continuous matching variables were selected based on a criterion to minimize an overall distance measure. Cases and controls were pulled from separate datasets, so cases could not be selected as controls.
Data Collection
All women enrolled in WHI-OS completed baseline visits to determine eligibility and collect data including questionnaires, physical examinations, biological specimens, and laboratory tests. During the first screening visit, a physical examination was performed by certified staff using standardized procedures. Questionnaires queried the women on lifestyle factors, medical history and personal habits. Women were asked to bring all their prescription medications in their original bottles to the baseline visit. The names, strengths and form of the medications were transcribed from the label into a pharmacy database: the Master Drug Data Base (MDDB: Medi-Span, Indianapolis, IN), and were then assigned a therapeutic drug class from the American Hospital Formulary Service. Fasting blood samples were collected following a standardized protocol. Samples were labeled, centrifuged, and frozen on site in -70C freezers and later shipped to the central WHI specimen repository (McKesson BioServices, Rockville MD) for long-term storage.
Laboratory analyses
The case and control samples were extracted from the specimen archive and sent to LipoScience, Inc (Raleigh, NC) for lipoprotein particle analysis using an automated nuclear magnetic resonance (NMR) spectroscopic assay.27 Particle concentrations of VLDL and LDL (including IDL) in nmol/L units and HDL in μmol/L units were determined by summing the concentrations of their respective subclasses, which were obtained from the measured amplitudes of the distinct lipid methyl group NMR signals they emit. Concentrations of IDL particles (diameter range 23-27 nm) were also provided, as were estimates of VLDL triglyceride (mg/dL) levels.27 Weighted-average VLDL, LDL, and HDL particle sizes were calculated by summing the diameter of each subclass multiplied by its relative mass percentage as estimated by the amplitude of its methyl NMR signal. Inter-assay reproducibility, determined from replicate analyses of plasma pools, is indicated by the following coefficients of variation: <2% for VLDL size, <0.5% for LDL and HDL size, <5% for VLDL triglyceride and VLDL, LDL, and HDL particle concentrations, and <15% for IDL particle concentration. Total cholesterol, HDL-C, and triglycerides were measured by standard enzymatic assays at Medical Research Laboratories (Highland Heights, KY). LDL-C was calculated using the Friedewald formula. All lipid and lipoprotein analyses were conducted in randomly ordered case-control pairs to minimize systematic bias and interassay variation.
Follow-up and Outcome Ascertainment
Study subjects were followed annually by mail or telephone to determine outcomes and overnight hospitalizations. Reports from participants or third party sources were also triggers for further investigation. Specific details of the illness and hospitalizations were obtained from medical records and laboratory results and other data were presented for adjudication locally by trained physician adjudicators who assigned a diagnosis according to standard criteria. All of the locally adjudicated strokes were sent for central adjudication by trained neurologists. Locally adjudicated cases not verified during central adjudication as being a stroke were excluded, thus only centrally adjudicated ischemic strokes were selected as outcomes. Ischemic stroke was defined as the rapid onset of a persistent neurologic deficit attributed to an obstruction lasting more than 24 hours without evidence for other causes, unless death supervened or there was a demonstrable lesion compatible with acute stroke on computed tomography (CT) or magnetic resonance imaging (MRI) scan. Only stroke events that required hospitalization were considered as a potential outcome. Strokes were classified as ischemic or hemorrhagic on review of reports of brain imaging studies. Ischemic stroke subtype was based on the TOAST (Trial of ORG 10172 in Acute Stroke Treatment) criteria.28 Transient ischemic attacks (TIA’s,) or hemorrhagic strokes were not included in the definition of stroke outcome.
Statistical Analyses
Univariate analyses were conducted to evaluate differences in covariates between matched cases and controls using McNemar’s Chi-Square test for categorical variables, paired t-tests for normally distributed continuous variables and Wilcoxon matched pairs signed rank test for non-normally distributed variables. Spearman correlations between lipid and lipoprotein biomarkers were calculated among the controls to determine the relationships and to assess for multi-collinearity. The relationship between lipid and lipoprotein biomarkers and risk of incident ischemic stroke was examined by using conditional logistic regression to account for the matching to estimate odds ratios (ORs) and 95% confidence intervals for quartiles of lipid biomarkers, with category cut-points defined according to the distribution of the controls with lipid values. Tests of linear trend across quartiles of lipid and lipoprotein biomarkers were conducted by assigning numeric values for each quartile and fitting this continuous variable in the model. Each lipid and lipoprotein biomarker was assessed independently in an adjusted model. Multivariable ORs were estimated from conditional logistic regression models,which accounted for the matching variables, and were additionally adjusted for several risk factors for ischemic stroke, including smoking status, body mass index, systolic blood pressure, use of anti-hypertensive medication, diabetes, and physical activity. Several analyses also adjusted for alcohol use, hormone therapy and education status as a marker of socioeconomic status. Adjusted models were based on case-control pairs for whom complete data were available on all covariates of interest. Investigation of the effect of hormone therapy on the association of lipid and lipoprotein biomarkers and stroke was pre-specified and accordingly, unconditional logistic regression analyses were performed separately among hormone users and non-users. All p-values were two-tailed and p-values below 0.05 were considered statistically significant. STATA/SE 10.0 was used for all analyses (StataCorp LP, College Station TX).
Results
Of the 972 matched pairs, there were 198 matched pairs that were excluded due to the case and/or control having used lipid lowering therapy at baseline. Baseline characteristics of the 774 matched pairs that were used in this analysis are shown in Table 1. Compared with controls, cases had higher BMI, more likely to be current smokers, hypertensive and diabetic. No significant difference was noted in hormone use and alcohol use. As expected, among the controls, the lipid and lipoprotein parameters were highly intercorrelated (Table 2).
Table 1.
Baseline characteristics of ischemic stroke cases and matched control subjects
| Control Subjects (n=774) | Case Subjects (n=774) | P value | |
|---|---|---|---|
| Age | 69 (65, 73) | 69 (65, 74) | NA |
| Race | NA | ||
| White | 86.8 | 86.8 | |
| African American | 8.0 | 8.0 | |
| Hispanic | 2.2 | 2.2 | |
| Other | 3.0 | 3.0 | |
| Body mass index | 26.0 (23.2, 29.7) | 26.8 (23.5, 30.3) | 0.03 |
| Smoking | <0.01 | ||
| Current | 3.8 | 8.2 | |
| Past | 41.6 | 39.6 | |
| Systolic blood pressure | <0.001 | ||
| ≤120 | 34.9 | 21.2 | |
| 120-140 | 38.2 | 38.3 | |
| >140 | 26.9 | 40.5 | |
| Diastolic blood pressure | 0.03 | ||
| < 90 | 95.2 | 92.6 | |
| ≥ 90 | 4.8 | 7.4 | |
| Use of any hypertensive medication | 32.4 | 55.3 | <0.001 |
| History of diabetes* | 7.6 | 16.2 | <0.001 |
| Education | 0.08 | ||
| Less than high school | 6.2 | 6.8 | |
| High school graduate | 16.2 | 18.3 | |
| Some college/post high school training | 37.8 | 41.5 | |
| College graduate | 39.8 | 33.4 | |
| Baseline Alcohol | 0.13 | ||
| Non-drinker | 28.8 | 32.8 | |
| 1-7 drinks per week | 59.1 | 53.8 | |
| ≥ 7 drinks per week | 12.2 | 13.4 | |
| Hormone Use | 38.2 | 40.3 | 0.40 |
| Type of hormone use | 0.31 | ||
| Estrogen alone | 62.5 | 68.6 | |
| Estrogen + progestin | 37.5 | 31.4 | |
| Exercise status (mets/wk) | 10.8 (3.5, 20.7) | 8.3 (2.5, 18.8) | <0.01 |
Values are given as median (interquartile range) or percentage
Diabetes was defined as being on treatment for diabetes or fasting glucose >126mg/dL
Table 2.
Spearman correlation coefficients between measured variables among controls
| Total Cholesterol | LDL Cholesterol | HDL Cholesterol | Triglycerides | Total Cholesterol/ HDL ratio | |
|---|---|---|---|---|---|
| HDL cholesterol (mg/dL) | 0.05 | -0.23* | 1 | -0.42* | -0.85* |
| HDL particle number (umol/L) | 0.09 | -0.22* | 0.59* | 0.15* | -0.46* |
| HDL size (nm) | -0.10 | -0.26* | 0.79* | -0.56* | -0.75* |
| IDL particle number (nmol/L) | 0.32* | 0.26* | -0.11 | 0.35* | 0.26* |
| LDL cholesterol (mg/dL) | 0.89* | 1 | -0.23* | 0.14* | 0.66* |
| LDL particle number (nmol/L) | 0.63* | 0.56* | -0.28* | 0.55* | 0.57* |
| LDL size (nm) | 0.04 | 0.09 | 0.37* | -0.48* | -0.30* |
| VLDL triglyceride (mg/dL) | 0.30* | 0.19* | -0.46* | 0.93* | 0.57* |
| VLDL particle number (nmol/L) | 0.43* | 0.39* | -0.47* | 0.75* | 0.64* |
| VLDL size (nm) | -0.04 | -0.21* | -0.16* | 0.61* | 0.13 |
| Lipoprotein (a) (mg/dL) | 0.12 | 0.15* | -0.01 | -0.05 | 0.07 |
| Smoking Status | -0.02 | -0.07 | 0.06 | 0.03 | -0.07 |
| BMI | 0.06 | 0.12 | -0.28* | 0.20* | 0.28* |
| Systolic BP | 0.01 | 0.02 | -0.07 | 0.05 | 0.08 |
| Anti-hypertensive medication use | -0.02 | -0.01 | 0.09 | -0.12 | -0.10 |
| Diabetes | -0.04 | -0.01 | -0.21* | 0.16* | 0.17* |
| Physical activity | -0.01 | -0.05 | 0.11 | -0.05 | -0.12 |
P<0.05
These p-values have been adjusted for multiple comparisons using bonferroni correction
In bivariate analyses (Table 3), cases had significantly higher median levels of triglycerides, IDL particles, LDL particles, LDL size, VLDL triglycerides, VLDL particles, and VLDL size. Additionally, median HDL-C levels and HDL size were significantly lower among controls compared to cases. Baseline levels of lipoprotein (a) were somewhat higher among the women with ischemic stroke than among control subjects, but these differences were not statistically significant. Similar results were demonstrated across quartiles and when comparing the fourth quartile of lipid biomarkers to the first quartile in unadjusted analyses (Table 4). Of all traditional lipid biomarkers, the level of triglycerides was the only one associated with future ischemic stroke; the unadjusted OR for the highest versus lowest quartile was 1.96 (95%CI, 1.46-2.10; P for trend <0.01).
Table 3.
Baseline lipid biomarkers in the study population
| # Case-Control Pairs | Control Subjects | Cases | P value | |
|---|---|---|---|---|
| Total cholesterol | 770 | 230.0 (204.0, 254.0) | 230.0 (207.0, 254.0) | 0.15 |
| Total cholesterol/HDL | 769 | 3.9 (3.1, 4.9) | 4.1 (3.3, 5.1) | <0.001 |
| Triglycerides | 770 | 140.0 (102.0, 189.0) | 155.5 (112.0, 217.0) | <0.001 |
| HDL cholesterol | 769 | 58.0 (48.0, 71.0) | 56.0 (46.0, 67.0) | <0.001 |
| HDL particle number | 729 | 31.7 (27.6, 36.3) | 31.8 (27.3, 35.6) | 0.15 |
| HDL size | 729 | 9.0 (8.6, 9.4) | 9.0 (8.6, 9.3) | <0.01 |
| IDL particle number | 729 | 58.0 (28.0, 96.0) | 67.0 (35.0, 106.0) | <0.01 |
| LDL cholesterol | 748 | 137.8 (113.9, 164.7) | 138.6 (116.7, 162.2) | 0.47 |
| LDL particle number | 729 | 1442.0 (1222.0, 1713.0) | 1511.0 (1283.0, 1798.0) | <0.01 |
| LDL size | 729 | 21.3 (20.8, 21.7) | 21.2 (20.7, 21.7) | 0.03 |
| VLDL triglyceride | 729 | 78.0 (50.0, 119.0) | 91.0 (56.0, 137.0) | <0.001 |
| VLDL particle number | 729 | 80.0 (57.0, 105.8) | 85.3 (60.9, 114.9) | <0.01 |
| VLDL size | 729 | 44.8 (40.4, 50.5) | 46.4 (41.8, 52.3) | <0.001 |
| Lipoprotein (a) | 739 | 10.0 (5.0, 26.0) | 10.0 (5.0, 31.0) | 0.11 |
Values are given as median (interquartile range)
Table 4.
Unadjusted and adjusted odds of developing future ischemic stroke according to quartile of lipid biomarkers at baseline
| Variable (Quartile cut-points) | Odds Ratio (95% Confidence interval) | ||||
|---|---|---|---|---|---|
| 1 | 2 | 3 | 4 | P for trend | |
| Total cholesterol (205.0, 230.0, 254.5) | |||||
| Unadjusted (case/control pairs=727) | 1.0 | 1.25 (0.93, 1.69) | 1.14 (0.85, 1.53) | 1.19 (0.89, 1.61) | 0.38 |
| Adjusted (case/control pairs=727) | 1.0 | 1.15 (0.84, 1.58) | 1.06 (0.77, 1.45) | 1.08 (0.78, 1.50) | 0.80 |
| Total cholesterol/HDL (3.1, 3.9, 5.0) | |||||
| Unadjusted (case/control pairs=726) | 1.0 | 1.26 (0.92, 1.71) | 1.39 (1.04, 1.87) | 1.54 (1.14, 2.10) | <0.01 |
| Adjusted (case/control pairs=726) | 1.0 | 1.21 (0.87, 1.68) | 1.20 (0.87, 1.65) | 1.17 (0.83, 1.66) | 0.40 |
| Triglycerides (104.0, 143.0, 192.0) | |||||
| Unadjusted (case/control pairs=727) | 1.0 | 1.19 (0.88, 1.62) | 1.45 (1.07, 1.96) | 1.93 (1.43, 2.60) | <0.001 |
| Adjusted (case/control pairs=727) | 1.0 | 1.19 (0.86, 1.64) | 1.34 (0.97, 1.85) | 1.56 (1.13, 2.17) | <0.01 |
| HDL cholesterol (48.0, 58.0, 70.0) | |||||
| Unadjusted (case/control pairs=726) | 1.0 | 0.90 (0.68, 1.18) | 0.75 (0.56, 1.00) | 0.65 (0.48, 0.88) | <0.01 |
| Adjusted (case/control pairs=726) | 1.0 | 0.99 (0.73, 1.32) | 0.95 (0.69, 1.29) | 0.82 (0.59, 1.16) | 0.28 |
| HDL particle number (27.8, 32.0, 36.6) | |||||
| Unadjusted (case/control pairs=686) | 1.0 | 0.94 (0.69, 1.30) | 1.09 (0.80, 1.48) | 0.84 (0.60, 1.18) | 0.54 |
| Adjusted (case/control pairs=686) | 1.0 | 0.97 (0.69, 1.38) | 1.19 (0.85, 1.67) | 0.90 (0.63, 1.30) | 0.88 |
| HDL size (8.6, 9.1, 9.4) | |||||
| Unadjusted (case/control pairs=686) | 1.0 | 0.83 (0.62, 1.11) | 0.86 (0.64, 1.15) | 0.65 (0.47, 0.89) | 0.02 |
| Adjusted (case/control pairs=686) | 1.0 | 1.00 (0.72, 1.37) | 1.14 (0.83, 1.58) | 0.95 (0.66, 1.36) | 0.95 |
| IDL particle number (30.0, 60.0, 101.0) | |||||
| Unadjusted (case/control pairs=686) | 1.0 | 1.18 (0.88, 1.58) | 1.38 (1.02, 1.87) | 1.55 (1.14, 2.10) | <0.01 |
| Adjusted (case/control pairs=686) | 1.0 | 1.12 (0.81, 1.53) | 1.33 (0.96, 1.85) | 1.46 (1.04, 2.04) | 0.02 |
| LDL cholesterol (114.0, 137.8, 164.4) | |||||
| Unadjusted (case/control pairs=706) | 1.0 | 1.08 (0.81, 1.45) | 1.11 (0.81, 1.50) | 1.03 (0.76, 1.41) | 0.82 |
| Adjusted (case/control pairs=706) | 1.0 | 1.09 (0.79, 1.49) | 1.15 (0.83, 1.61) | 0.94 (0.67, 1.32) | 0.84 |
| LDL particle number (1226.0, 1457.5, 1721.0) | |||||
| Unadjusted (case/control pairs=686) | 1.0 | 1.23 (0.90, 1.68) | 1.30 (0.95, 1.77) | 1.64 (1.20, 2.23) | <0.01 |
| Adjusted (case/control pairs=686) | 1.0 | 1.13 (0.81, 1.59) | 1.11 (0.79, 1.56) | 1.23 (0.88, 1.73) | 0.28 |
| LDL size (20.8, 21.3, 21.7) | |||||
| Unadjusted (case/control pairs=686) | 1.0 | 0.88 (0.66, 1.16) | 0.83 (0.62, 1.13) | 0.76 (0.56, 1.03) | 0.07 |
| Adjusted (case/control pairs=686) | 1.0 | 1.04 (0.76, 1.42) | 1.04 (0.75, 1.45) | 0.96 (0.70, 1.33) | 0.85 |
| VLDL triglyceride (51.0, 80.0, 122.0) | |||||
| Unadjusted (case/control pairs=686) | 1.0 | 0.96 (0.70, 1.32) | 1.25 (0.91, 1.72) | 1.60 (1.18, 2.17) | <0.001 |
| Adjusted (case/control pairs=686) | 1.0 | 0.95 (0.68, 1.32) | 1.14 (0.81, 1.61) | 1.28 (0.91, 1.79) | 0.09 |
| VLDL particle number (57.3, 81.8, 106.7) | |||||
| Unadjusted (case/control pairs=686) | 1.0 | 1.06 (0.79, 1.43) | 1.05 (0.77, 1.45) | 1.44 (1.07, 1.94) | 0.02 |
| Adjusted (case/control pairs=686) | 1.0 | 1.04 (0.76, 1.43) | 1.00 (0.71, 1.41) | 1.16 (0.84, 1.61) | 0.41 |
| VLDL size (40.4, 44.7, 50.8) | |||||
| Unadjusted (case/control pairs=686) | 1.0 | 1.44 (1.05, 1.98) | 1.55 (1.13, 2.11) | 2.04 (1.48, 2.82) | <0.001 |
| Adjusted (case/control pairs=686) | 1.0 | 1.34 (0.96, 1.89) | 1.26 (0.90, 1.77) | 1.59 (1.10, 2.28) | 0.03 |
| Lipoprotein (a) (5.0, 11.0, 27.0) | |||||
| Unadjusted (case/control pairs=700) | 1.0 | 0.99 (0.73,1.33) | 0.85 (0.63, 1.16) | 1.14 (0.85, 1.54) | 0.58 |
| Adjusted (case/control pairs=700) | 1.0 | 0.95 (0.69, 1.31) | 0.92 (0.66, 1.27) | 1.16 (0.84, 1.59) | 0.45 |
All unadjusted models conditioned on age and race
All adjusted models conditioned on age and race, and additionally adjusted for smoking status, body mass index, systolic blood pressure, use of anti-hypertensive medication, diabetes, and physical activity
Each row is a separate model with stroke as the outcome which included quartiles of that specific biomarker
Biomarker quartile cut-points were based on all available controls
When stratified by stroke subtype, lipid and lipoprotein biomarkers were most notably associated with ischemic stroke among subjects whose stroke etiology was from large artery atherosclerosis (Appendix Table 1). Comparing the 4th quartile to the 1st quartile was significant for triglycerides (OR 4.10, 95% CI 1.82-9.27), HDL-C (OR 0.29, 95% CI 0.14-0.63), LDL particle number (OR 3.55, 95% CI 1.63-7.73), VLDL- triglycerides (OR 5.38, 95% CI 2.17-13.3), VLDL particle number (OR 4.72, 95% CI 2.02-11.05), and lipoprotein (a) (OR 1.87, 95% CI 0.96-3.65.
In a multivariable model conditioned on age and race, and additionally adjusted for smoking status, body mass index, systolic blood pressure, use of anti-hypertensive medication, diabetes, and physical activity, the ORs of future ischemic stroke associated with each biomarker quartile are shown in Table 4. Women in the highest quartile of triglycerides had a 56% increase in the odds of ischemic stroke versus those in the lowest quartile. Other lipid biomarkers associated with the odds of ischemic stroke after multivariable adjustment included VLDL size (P for trend 0.03) and IDL particle number (P for trend 0.02). Standard lipid biomarkers at baseline including total cholesterol, HDL-C, LDL-C, and the total cholesterol/HDL cholesterol ratio were not significantly associated with future ischemic stroke. Results of all models did not differ substantially with or without adjustment for body mass index. Additional adjustment for alcohol use, hormone therapy use and education as a marker of socio-economic status did not substantially change the multivariable associations presented in table 4 (data not shown). Given the recognized relationship between diabetes and abnormal lipid and lipoprotein biomarkers, we repeated our analysis excluding subjects with diabetes (n=184). In this nondiabetic sample, there remained an increase in the adjusted odds of ischemic stroke for triglycerides (OR 1.59, P for trend <0.01), VLDL triglyceride (OR 1.32, P for trend =0.06), VLDL size (OR 1.51, P for trend 0.02) , and LDL particle number (OR 1.39, P for trend =0.04).
To explore whether triglyceride levels added independent information to standard based screening, we computed the unadjusted OR of developing ischemic stroke in analyses that stratified patients into groups based on median lipid values. As shown in Figure 1, the odds of developing ischemic stroke for triglyceride levels above the median (140mg/dl) versus below the median was 32% (OR 1.32, 95% CI 0.99-1.76) in women with LDL-C below the median and 52% (OR 1.52, 95% CI 1.14-2.03) in those equal to or above the median. Similarly, elevated triglyceride levels were associated with increased odds of stroke in women with HDL-C below the median (OR 1.38, 95% CI 1.02-1.87) and equal to or above the median (OR 1.34, 95% CI 0.99-1.79). To address the robustness of these findings, analyses were also performed using the total cholesterol/HDL-C ratio as the method of standard based screening (Figure 1).
Figure 1. Odds ratio of developing ischemic stroke among postmenopausal women according to baseline levels of triglycerides and established lipid biomarkers.
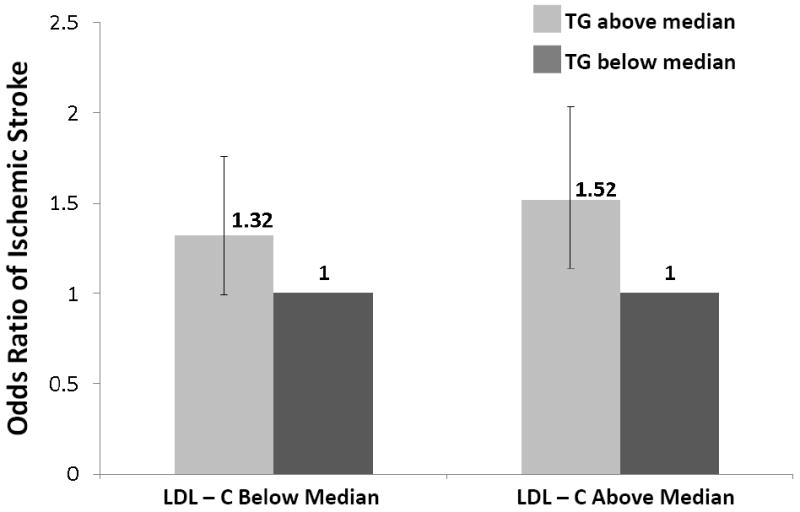
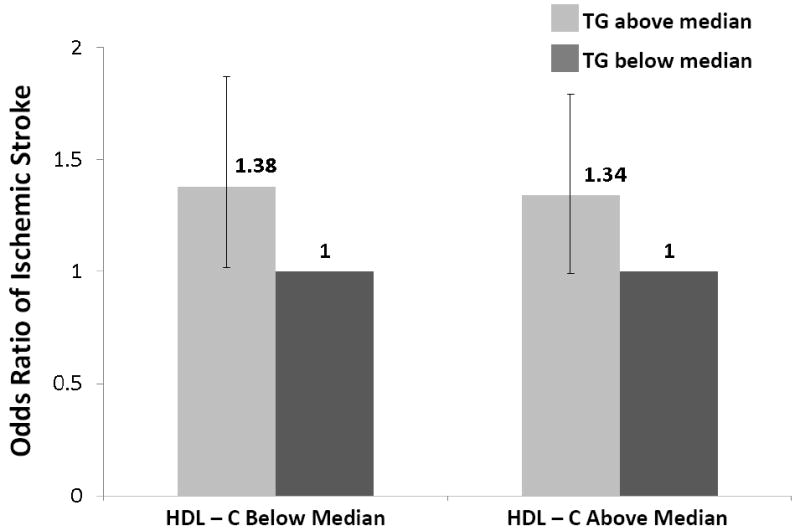
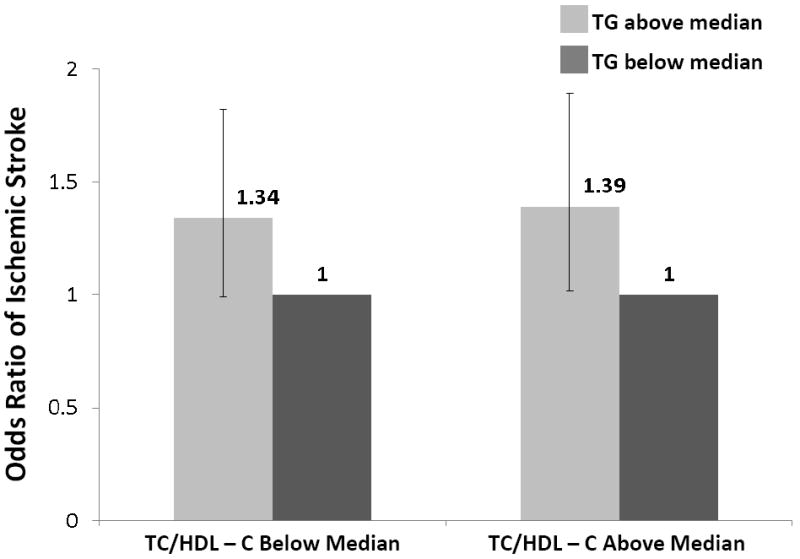
TG, triglycerides; LDL-C, low density lipoprotein cholesterol; HDL-C, high density lipoprotein cholesterol; TC, total cholesterol
All medians in above paragraph are based on data among controls (TG 140; LDL-C 138; HDL-C 58; TC/HDL-C 3.91)
Hormone Therapy
Although the interaction of hormone use and lipids was not significantly associated with the odds of ischemic stroke, the association of lipid biomarkers was generally stronger in the nonusers of hormone therapy (Appendix Table 2). In the multivariable adjusted model, the OR in the highest as compared with the lowest quartile of triglycerides was 1.77 in the nonusers (95% CI 1.20-2.62; P for trend <0.01) and 1.35 in the users of hormone therapy (95% CI 0.81-2.26; P for trend =0.27). Similarly, in nonusers of hormone therapy IDL particle number was associated with higher risk of ischemic stroke (OR 1.93, 95% CI 1.29-2.88; P for trend <0.01) and HDL-C with lower risk (OR 0.67, 95% CI 0.44-1.03; P for trend 0.09). Among users of hormone therapy, the corresponding OR was 0.94 for IDL particle number (95% CI 0.58-1.53; P for trend =0.96) and 1.04 for HDL-C (95% CI 0.63-1.72; P for trend =0.97).
Clinical Cutoff Points for Established Lipid Biomarkers
We further categorized the study participants on the basis of proposed cutoff points for established lipid biomarkers, which are defined in current guidelines for risk detection. For triglyceride levels, women with elevated levels (at least 150 mg/dL) were compared with those having levels less than 150 mg/dL. In unconditional logistic regression with adjustment for age and race, women with elevated levels of triglycerides had a 43% increased odds of ischemic stroke (OR 1.43, 95% CI 1.17-1.75). For LDL-C, women with high levels (≥130 mg/dL) or moderate levels (100-130 mg/dL) were compared to women with normal levels (<100 mg/dL). Compared to women with normal levels of LDL-C, those with high levels (OR 1.18, 95% CI 0.87-1.58) and moderate levels (OR 1.04, 95% CI 0.75-1.45) were at no significant increased odds of ischemic stroke. For HDL-C, women with low values (<50 mg/dL) were compared with those with values ≥50 mg/dL. In this analysis, women with low levels of HDL-C had an OR of ischemic stroke of approximately 1.24 (95% CI 1.00-1.54).
Discussion
In this prospective evaluation of lipid and lipoprotein biomarkers associated with incident ischemic stroke, baseline level of triglycerides was a significant biomarker among postmenopausal women. Other biomarkers at baseline, including VLDL triglyceride, VLDL particle number, VLDL size, LDL particle number, IDL particle number, HDL cholesterol, HDL size and the total cholesterol/HDL-C ratio were also associated with future ischemic stroke. Importantly, total cholesterol and LDL-C levels at baseline were not associated with ischemic stroke. For all markers, associations were markedly attenuated and – with the exception of triglycerides, VLDL size and IDL particle number – no longer significant after adjustment for cardiovascular risk factors. To the best of our knowledge, this is the first study to directly address the magnitude of established and novel lipid biomarkers associated with the development of ischemic stroke.
Lipid Biomarkers and Ischemic Stroke
In previous epidemiological studies that have evaluated lipid biomarkers for the prediction of stroke, the data are conflicting. In the original Framingham Study for the prediction of stroke, total serum cholesterol was not predictive, and therefore removed from the final model29. Several large meta-analyses have noted a significant association between total cholesterol and stroke in young women, a finding not replicated in older women.15, 18 A combined analysis of cohort studies noted a significant association between total cholesterol and stroke mortality in women younger than 55 years.18 Data from the Atherosclerosis Risk in Communities (ARIC) Study24 revealed weak and inconsistent associations between the risk of ischemic stroke and LDL-C, HDL-C, and triglycerides. In subgroup analysis according to sex, and consistent with the present study, women with triglyceride levels above the 87th percentile had a significant 2-fold greater adjusted risk for ischemic stroke than women in the lower quartile.24 Recent data from the Women’s Health Study found significant associations between the risk of ischemic stroke and established lipid biomarkers, including total cholesterol, LDL-C, and total cholesterol to HDL-C ratio.20 The conflicting data for lipid biomarkers and stroke may be partly explained by the heterogeneity of the stroke endpoint, over-controlling for potential biologic mediators, evaluating only a selected subset of lipid biomarkers, and differences in risk factor/stroke relationships between older and younger populations and between women and men.
The current study demonstrated significant associations between several novel and established lipid and lipoprotein biomarkers and risk of ischemic stroke. Our data are noteworthy for several reasons. First, our data suggest that lipid and lipoprotein abnormalities may play a larger role in the risk of ischemic stroke than traditional lipid testing indicates. Lipoprotein abnormalities are common findings in patients with cardiometabolic risk (e.g. smokers, overweight, physically inactive, hypertensive, metabolic syndrome).27 Consistently, the association between lipid and lipoprotein biomarkers and risk of stroke was markedly attenuated after adjustment for these clinical variables. Second, the traditional measure of LDL-related cardiovascular disease risk, LDL-C, was not associated with incident ischemic stroke. LDL particle number, in contrast, was associated with future ischemic stroke in unadjusted analyses and in adjusted analyses in nondiabetic individuals. The seeming incongruity of our LDL-C findings with randomized clinical trial data showing a benefit of statin treatment on stroke incidence (RR 0.83, P<0.001)30 may partly be explained by the known LDL particle-lowering effect of statins. In addition, statin therapy reduces both triglycerides and IDL concentrations, likely contributing further to the stroke reduction observed in statin trials.31 Other pharmacological effects of statin therapy such as improvement in endothelial function, promotion of atherosclerotic plaque stability, and modification of both inflammatory responses and thrombus formation may also be involved.30, 32, 33
Third, although we did not find a significant interaction between lipid or lipoprotein biomarkers and hormone therapy use, the association between several lipid and lipoprotein biomarkers and stroke were greater in the group not using hormone therapy. This data is consistent with the Women’s Health Study which found a significant interaction between total cholesterol and hormone use.20 In that study, the increased risk of stroke with increasing levels of total cholesterol was only seen in women who did not use hormone therapy.20 Finally, our study demonstrated that lipid and lipoprotein biomarkers may be important in the evolution of medical practice. Our findings raise the hypothesis that in addition to aiding in the prediction of ischemic stroke, changes in the levels of some of these factors through therapeutics or by lifestyle interventions may be beneficial in reducing the risk of stroke. In fact, subanalysis of 3 randomized double-blind trials suggest that among patients with increased triglyceride levels, a 20%to 40% reduction in triglyceride levels associates with a 30%to 40% risk reduction in ischemic heart disease.34-36
Triglyceride levels and Stroke
Increasing evidence suggests that triglyceride level is important in assessing risk of atherosclerotic events.37-42 Furthermore, data suggest that women have a greater risk of cardiovascular events associated with hypertriglyceridemia than men.40, 43 A meta-analysis of 17 epidemiological studies of more than 55,000 women and men demonstrated that triglyceride levels are associated with a 76% and 32% increased the risk of cardiovascular disease in women and men, respectively.43 More recently, a prospective Danish study found that triglyceride levels were more predictive of ischemic heart disease in women than men.40 Another Danish cohort study demonstrated a significant association between triglycerides and ischemic stroke, and this relationship was most pronounced among women.44 In the present study of postmenopausal women, we found that triglyceride level was an important predictor of ischemic stroke in postmenopausal women. Triglyceride level remained an independent predictor in those with low and elevated values of LDL-C, total cholesterol, HDL-C, and total cholesterol to HDL-C ratio.
Although the mechanisms by which triglycerides affect ischemic stroke are unclear, several possibilities have been suggested.41 Triglyceride-rich lipoproteins and elevated triglyceride levels appear to have a direct atherogenic effect, and high levels appear to be a marker of atherosclerotic and prothrombotic changes.45 Elevated triglyceride levels are associated with abnormalities in the clotting-fibrinolytic cascade, which has been linked to ischemic stroke.46 Most likely, the effects of triglycerides are multifactorial and other potential mechanisms remain to be elucidated.
Limitations
Several limitations exist when interpreting this study. The ascertainment of lipid and lipoprotein biomarkers was at a single time point at study entry. However, in a reproducibility study for plasma biomarkers, the correlation coefficient was excellent for plasma lipids and lipoproteins collected several years apart.47 Although women receiving lipid lowering medicine at baseline were excluded from this analysis, use of cholesterol lowering medicines may have changed over time. Nevertheless, these changes would most likely be nondifferential and would tend to bias the results to the null. Another limitation is that multiple analyses were performed in this study, and no adjustments for multiple comparisons were made. Finally, the present study was conducted among mostly Caucasian postmenopausal women, and thus the predictive value of lipid biomarkers in premenopausal women and men as well as other race/ethnicity groups remains unknown.
Conclusions
The current study was designed to assess the relationship between lipid and lipoprotein biomarkers and development of ischemic stroke. With that in mind, we demonstrated that several lipid and lipoprotein biomarkers at baseline were associated with ischemic stroke. Though most associations for lipid and lipoprotein biomarkers were attenuated after multivariable adjustment, high levels of IDL particle number and VLDL size may be associated with an increased risk and require confirmation in future studies. From a clinical standpoint, level of triglycerides was independently associated with incident ischemic stroke. This study supports the new guidelines from the American Heart Association and American Stroke Association on stroke prevention which recognizes triglycerides as a risk factor for stroke.42 Future studies should confirm our results and address the hypothesis whether lifestyle modification and/or pharmacologic therapy aimed at reducing triglycerides are warranted for reducing the risk of ischemic stroke.
Acknowledgments
Sources of Funding
The WHI program is funded by the National Heart, Lung, and Blood Institute, National Institutes of Health, U.S. Department of Health and Human Services through contracts N01WH22110, 24152, 32100-2, 32105-6, 32108-9, 32111-13, 32115, 32118-32119, 32122, 42107-26, 42129-32, and 44221. This study was supported by a grant from the National Institutes of Neurological Disorders and Stroke (R01NS042618). The content is solely the responsibility of the authors and does not necessarily represent the official views of the NINDS or the NIH.
Dr Berger was partially funded by an American Heart Association Fellow to Faculty Award (#0775074N).
Footnotes
Conflicts of Interest
Dr Howard is a consultant for Merck and Egg Nutrition Council, and has received research support (donation of drugs) from Pfizer, Merck, and Schering-Plough, and lectures for Schering-Plough. Dr Otvos is an employee and stockholder of Liposcience, Inc. Dr Eaton has received research support from Pfizer, Parexel, AstraZeneca, Auxilium, and Forest Pharmaceuticals; is on the Speakers Bureau for Pfizer and Merck-Shering Plough; and is a consultant for Pfizer, Merck-Shering Plough, Merck, and Johnson&Johnson. Drs Berger, McGinn, Kuller, Manson, Curb, Kaplan, Lynch, Rosenbaum, and Wassertheil-Smoller report no conflicts.
References
- 1.Roberts WC. Factors linking cholesterol to atherosclerotic plaques. Am J Cardiol. 1988;62:495–499. doi: 10.1016/0002-9149(88)90993-9. [DOI] [PubMed] [Google Scholar]
- 2.Ross R, Glomset JA. The pathogenesis of atherosclerosis (first of two parts) N Engl J Med. 1976;295:369–377. doi: 10.1056/NEJM197608122950707. [DOI] [PubMed] [Google Scholar]
- 3.Schwenke DC, Carew TE. Initiation of atherosclerotic lesions in cholesterol-fed rabbits. I. Focal increases in arterial LDL concentration precede development of fatty streak lesions. Arteriosclerosis. 1989;9:895–907. doi: 10.1161/01.atv.9.6.895. [DOI] [PubMed] [Google Scholar]
- 4.Bush TL, Fried LP, Barrett-Connor E. Cholesterol, lipoproteins, and coronary heart disease in women. Clin Chem. 1988;34:B60–70. [PubMed] [Google Scholar]
- 5.Coresh J, Kwiterovich PO., Jr Small, dense low-density lipoprotein particles and coronary heart disease risk: A clear association with uncertain implications. JAMA. 1996;276:914–915. [PubMed] [Google Scholar]
- 6.Kannel WB, Castelli WP, Gordon T, McNamara PM. Serum cholesterol, lipoproteins, and the risk of coronary heart disease. The Framingham study. Ann Intern Med. 1971;74:1–12. doi: 10.7326/0003-4819-74-1-1. [DOI] [PubMed] [Google Scholar]
- 7.Keys A, Menotti A, Aravanis C, Blackburn H, Djordevic BS, Buzina R, et al. The seven countries study: 2,289 deaths in 15 years. Prev Med. 1984;13:141–154. doi: 10.1016/0091-7435(84)90047-1. [DOI] [PubMed] [Google Scholar]
- 8.Rhoads GG, Gulbrandsen CL, Kagan A. Serum lipoproteins and coronary heart disease in a population study of Hawaii Japanese men. N Engl J Med. 1976;294:293–298. doi: 10.1056/NEJM197602052940601. [DOI] [PubMed] [Google Scholar]
- 9.Smith SC, Jr, Blair SN, Bonow RO, Brass LM, Cerqueira MD, Dracup K, et al. AHA/ACC Scientific Statement: AHA/ACC guidelines for preventing heart attack and death in patients with atherosclerotic cardiovascular disease: 2001 update: A statement for healthcare professionals from the American Heart Association and the American College of Cardiology. Circulation. 2001;104:1577–1579. doi: 10.1161/hc3801.097475. [DOI] [PubMed] [Google Scholar]
- 10.Pignone MP, Phillips CJ, Atkins D, Teutsch SM, Mulrow CD, Lohr KN. Screening and treating adults for lipid disorders. Am J Prev Med. 2001;20:77–89. doi: 10.1016/s0749-3797(01)00255-0. [DOI] [PubMed] [Google Scholar]
- 11.Mosca L, Banka CL, Benjamin EJ, Berra K, Bushnell C, Dolor RJ, et al. Evidence-based guidelines for cardiovascular disease prevention in women: 2007 update. Circulation. 2007;115:1481–1501. doi: 10.1161/CIRCULATIONAHA.107.181546. [DOI] [PubMed] [Google Scholar]
- 12.Austin MA, King MC, Vranizan KM, Krauss RM. Atherogenic lipoprotein phenotype. A proposed genetic marker for coronary heart disease risk. Circulation. 1990;82:495–506. doi: 10.1161/01.cir.82.2.495. [DOI] [PubMed] [Google Scholar]
- 13.Gardner CD, Fortmann SP, Krauss RM. Association of small low-density lipoprotein particles with the incidence of coronary artery disease in men and women. JAMA. 1996;276:875–881. [PubMed] [Google Scholar]
- 14.Bjornheden T, Babyi A, Bondjers G, Wiklund O. Accumulation of lipoprotein fractions and subfractions in the arterial wall, determined in an in vitro perfusion system. Atherosclerosis. 1996;123:43–56. doi: 10.1016/0021-9150(95)05770-6. [DOI] [PubMed] [Google Scholar]
- 15.Cholesterol, diastolic blood pressure, and stroke: 13,000 strokes in 450,000 people in 45 prospective cohorts. Prospective studies collaboration. Lancet. 1995;346:1647–1653. [PubMed] [Google Scholar]
- 16.Castelli WP, Anderson K, Wilson PW, Levy D. Lipids and risk of coronary heart disease. The Framingham Study. Ann Epidemiol. 1992;2:23–28. doi: 10.1016/1047-2797(92)90033-m. [DOI] [PubMed] [Google Scholar]
- 17.Everett BM, Kurth T, Buring JE, Ridker PM. The relative strength of C-reactive protein and lipid levels as determinants of ischemic stroke compared with coronary heart disease in women. J Am Coll Cardiol. 2006;48:2235–2242. doi: 10.1016/j.jacc.2006.09.030. [DOI] [PMC free article] [PubMed] [Google Scholar]
- 18.Horenstein RB, Smith DE, Mosca L. Cholesterol predicts stroke mortality in the Women’s Pooling Project. Stroke. 2002;33:1863–1868. doi: 10.1161/01.str.0000020093.67593.0b. [DOI] [PubMed] [Google Scholar]
- 19.Iso H, Jacobs DR, Jr, Wentworth D, Neaton JD, Cohen JD. Serum cholesterol levels and six-year mortality from stroke in 350,977 men screened for the multiple risk factor intervention trial. N Engl J Med. 1989;320:904–910. doi: 10.1056/NEJM198904063201405. [DOI] [PubMed] [Google Scholar]
- 20.Kurth T, Everett BM, Buring JE, Kase CS, Ridker PM, Gaziano JM. Lipid levels and the risk of ischemic stroke in women. Neurology. 2007;68:556–562. doi: 10.1212/01.wnl.0000254472.41810.0d. [DOI] [PMC free article] [PubMed] [Google Scholar]
- 21.Lindenstrom E, Boysen G, Nyboe J. Influence of total cholesterol, high density lipoprotein cholesterol, and triglycerides on risk of cerebrovascular disease: the Copenhagen City Heart Study. BMJ. 1994;309:11–15. doi: 10.1136/bmj.309.6946.11. [DOI] [PMC free article] [PubMed] [Google Scholar]
- 22.Piechowski-Jozwiak B, Bogousslavsky J. Cholesterol as a risk factor for stroke: the fugitive? Stroke. 2004;35:1523–1524. doi: 10.1161/01.STR.0000130460.09807.ec. [DOI] [PubMed] [Google Scholar]
- 23.Sacco RL, Benson RT, Kargman DE, Boden-Albala B, Tuck C, Lin IF, et al. High-density lipoprotein cholesterol and ischemic stroke in the elderly: the Northern Manhattan Stroke Study. JAMA. 2001;285:2729–2735. doi: 10.1001/jama.285.21.2729. [DOI] [PubMed] [Google Scholar]
- 24.Shahar E, Chambless LE, Rosamond WD, Boland LL, Ballantyne CM, McGovern PG, et al. Plasma lipid profile and incident ischemic stroke: the Atherosclerosis Risk in Communities (ARIC) study. Stroke. 2003;34:623–631. doi: 10.1161/01.STR.0000057812.51734.FF. [DOI] [PubMed] [Google Scholar]
- 25.Hays J, Hunt JR, Hubbell FA, Anderson GL, Limacher M, Allen C, et al. The Women’s Health Initiative recruitment methods and results. Ann Epidemiol. 2003;13:S18–77. doi: 10.1016/s1047-2797(03)00042-5. [DOI] [PubMed] [Google Scholar]
- 26.Langer RD, White E, Lewis CE, Kotchen JM, Hendrix SL, Trevisan M. The Women’s Health Initiative Observational Study: baseline characteristics of participants and reliability of baseline measures. Ann Epidemiol. 2003;13:S107–121. doi: 10.1016/s1047-2797(03)00047-4. [DOI] [PubMed] [Google Scholar]
- 27.Brunzell JD, Davidson M, Furberg CD, Goldberg RB, Howard BV, Stein JH, et al. Lipoprotein management in patients with cardiometabolic risk: consensus conference report from the American Diabetes Association and the American College of Cardiology Foundation. Journal of the American College of Cardiology. 2008;51:1512–1524. doi: 10.1016/j.jacc.2008.02.034. [DOI] [PubMed] [Google Scholar]
- 28.Adams HP, Jr, Bendixen BH, Kappelle LJ, Biller J, Love BB, Gordon DL, et al. Classification of subtype of acute ischemic stroke. Definitions for use in a multicenter clinical trial. TOAST. Trial of Org 10172 in Acute Stroke Treatment. Stroke. 1993;24:35–41. doi: 10.1161/01.str.24.1.35. [DOI] [PubMed] [Google Scholar]
- 29.Wolf PA, D’Agostino RB, Belanger AJ, Kannel WB. Probability of stroke: a risk profile from the Framingham Study. Stroke. 1991;22:312–318. doi: 10.1161/01.str.22.3.312. [DOI] [PubMed] [Google Scholar]
- 30.Rosenson RS, Tangney CC. Antiatherothrombotic properties of statins: implications for cardiovascular event reduction. JAMA. 1998;279:1643–1650. doi: 10.1001/jama.279.20.1643. [DOI] [PubMed] [Google Scholar]
- 31.Stein DT, Devaraj S, Balis D, Adams-Huet B, Jialal I. Effect of statin therapy on remnant lipoprotein cholesterol levels in patients with combined hyperlipidemia. Arterioscler Thromb Vasc Biol. 2001;21:2026–2031. doi: 10.1161/hq1201.100259. [DOI] [PubMed] [Google Scholar]
- 32.Maron DJ, Fazio S, Linton MF. Current perspectives on statins. Circulation. 2000;101:207–213. doi: 10.1161/01.cir.101.2.207. [DOI] [PubMed] [Google Scholar]
- 33.Vaughan CJ, Delanty N. Neuroprotective properties of statins in cerebral ischemia and stroke. Stroke. 1999;30:1969–1973. doi: 10.1161/01.str.30.9.1969. [DOI] [PubMed] [Google Scholar]
- 34.Secondary prevention by raising HDL cholesterol and reducing triglycerides in patients with coronary artery disease: the Bezafibrate Infarction Prevention (BIP) study. Circulation. 2000;102:21–27. doi: 10.1161/01.cir.102.1.21. [DOI] [PubMed] [Google Scholar]
- 35.Manninen V, Elo MO, Frick MH, Haapa K, Heinonen OP, Heinsalmi P, et al. Lipid alterations and decline in the incidence of coronary heart disease in the Helsinki Heart Study. JAMA. 1988;260:641–651. [PubMed] [Google Scholar]
- 36.Robins SJ, Collins D, Wittes JT, Papademetriou V, Deedwania PC, Schaefer EJ, et al. Relation of gemfibrozil treatment and lipid levels with major coronary events: VA-HIT: a randomized controlled trial. JAMA. 2001;285:1585–1591. doi: 10.1001/jama.285.12.1585. [DOI] [PubMed] [Google Scholar]
- 37.Austin MA, McKnight B, Edwards KL, Bradley CM, McNeely MJ, Psaty BM, et al. Cardiovascular disease mortality in familial forms of hypertriglyceridemia: A 20-year prospective study. Circulation. 2000;101:2777–2782. doi: 10.1161/01.cir.101.24.2777. [DOI] [PubMed] [Google Scholar]
- 38.Bansal S, Buring JE, Rifai N, Mora S, Sacks FM, Ridker PM. Fasting compared with nonfasting triglycerides and risk of cardiovascular events in women. JAMA. 2007;298:309–316. doi: 10.1001/jama.298.3.309. [DOI] [PubMed] [Google Scholar]
- 39.Gotto AM., Jr Triglyceride: the forgotten risk factor. Circulation. 1998;97:1027–1028. doi: 10.1161/01.cir.97.11.1027. [DOI] [PubMed] [Google Scholar]
- 40.Nordestgaard BG, Benn M, Schnohr P, Tybjaerg-Hansen A. Nonfasting triglycerides and risk of myocardial infarction, ischemic heart disease, and death in men and women. JAMA. 2007;298:299–308. doi: 10.1001/jama.298.3.299. [DOI] [PubMed] [Google Scholar]
- 41.Chapman MJ, Ginsberg HN, Amarenco P, Andreotti F, Boren J, Catapano AL, et al. Triglyceride-rich lipoproteins and high-density lipoprotein cholesterol in patients at high risk of cardiovascular disease: evidence and guidance for management. Eur Heart J. 2011 doi: 10.1093/eurheartj/ehr112. E pub ahead of print. [DOI] [PMC free article] [PubMed] [Google Scholar]
- 42.Goldstein LB, Bushnell CD, Adams RJ, Appel LJ, Braun LT, Chaturvedi S, et al. Guidelines for the primary prevention of stroke: a guideline for healthcare professionals from the American Heart Association/American Stroke Association. Stroke. 2011;42:517–584. doi: 10.1161/STR.0b013e3181fcb238. [DOI] [PubMed] [Google Scholar]
- 43.Hokanson JE, Austin MA. Plasma triglyceride level is a risk factor for cardiovascular disease independent of high-density lipoprotein cholesterol level: a meta-analysis of population-based prospective studies. J Cardiovasc Risk. 1996;3:213–219. [PubMed] [Google Scholar]
- 44.Freiberg JJ, Tybjaerg-Hansen A, Jensen JS, Nordestgaard BG. Nonfasting triglycerides and risk of ischemic stroke in the general population. JAMA. 2008;300:2142–2152. doi: 10.1001/jama.2008.621. [DOI] [PubMed] [Google Scholar]
- 45.Patsch JR, Miesenbock G, Hopferwieser T, Muhlberger V, Knapp E, Dunn JK, et al. Relation of triglyceride metabolism and coronary artery disease. Studies in the postprandial state. Arterioscler Thromb. 1992;12:1336–1345. doi: 10.1161/01.atv.12.11.1336. [DOI] [PubMed] [Google Scholar]
- 46.Grundy SM. Hypertriglyceridemia, atherogenic dyslipidemia, and the metabolic syndrome. Am J Cardiol. 1998;81:18B–25B. doi: 10.1016/s0002-9149(98)00033-2. [DOI] [PubMed] [Google Scholar]
- 47.Al-Delaimy WK, Jansen EH, Peeters PH, van der Laan JD, van Noord PA, Boshuizen HC, et al. Reliability of biomarkers of iron status, blood lipids, oxidative stress, vitamin D, C-reactive protein and fructosamine in two Dutch cohorts. Biomarkers. 2006;11:370–382. doi: 10.1080/13547500600799748. [DOI] [PubMed] [Google Scholar]