Abstract
Vocal production in songbirds requires the control of the respiratory system, the syrinx as sound source and the vocal tract as acoustic filter. Vocal tract movements consist of beak, tongue and hyoid movements which change the volume of the oropharyngeal-esophageal cavity (OEC), glottal movements and tracheal length changes. The respective contributions of each movement to filter properties are not completely understood, but the effects of this filtering are thought to be very important for acoustic communication in birds. One of the most striking movements of the upper vocal tract during vocal behavior in songbirds involves the OEC. This study measured the acoustic effect of OEC adjustments in zebra finches by comparing resonance acoustics between an utterance with OEC expansion (calls) and a similar utterance without OEC expansion (respiratory sounds induced by a bilateral syringeal denervation). X-ray cineradiography confirmed the presence of an OEC motor pattern during song and call production, and a custom-built Hall-effect collar system confirmed that OEC expansion movements were not present during respiratory sounds. The spectral emphasis during zebra finch call production ranging between 2.5 and 5 kHz was not present during respiratory sounds, indicating strongly that it can be attributed to the OEC expansion.
Keywords: vocal production, articulation, hyoid skeleton, formants, source-filter theory
Introduction
Vocal production of species-specific signals requires the coordinated control of the vocal organ and the respiratory system (e.g., Riede and Goller 2010a). Songbirds produce the primary sound by flow-induced tissue (labia) oscillations within the vocal organ, the syrinx (e.g., Goller and Larsen 1997; Larsen and Goller 2002; Fee 2002; Zollinger et al. 2008; Elemans et al. 2010; Riede and Goller 2010b). Before sound radiates from the beak, it transmits through a supra-syringeal air space. This upper vocal tract of songbirds consists of the tracheal tube, larynx, oropharyngeal-esophageal cavity (OEC) and beak. The passage through the vocal tract exposes the primary, source-generated sound to the resonance properties of the upper vocal tract and results in acoustic changes. Resonance acoustics of a songbird vocal tract is not fully understood but important for communication (e.g. Heinz et al.1981; Dooling 1992) and for the physics of sound production at the syrinx (Arneodo et al. 2011).
Resonance properties of the vocal tract are determined by its geometry, and during song most birds dynamically change this geometry and, thus, adjust resonance properties (e.g., Nowicki 1987; Hoese et al. 2000; Goller et al. 2004; Riede et al. 2006). Initially, the focus of studies was on the effect of beak movements on acoustic resonance (e.g., Westneat et al. 1993; Podos et al. 1995; Hoese et al. 2000; Goller et al. 2004), however inconsistent relations between beak movement and acoustic features in some species (e.g., Goller et al. 2004; Riede et al. 2006) and the conclusion from computer simulations that beak gape acoustics plays a small functional role in filtering (Fletcher et al. 2006) led the focus to the oropharyngeal and esophageal area. X-ray cinematography has revealed that OEC size undergoes dramatic and consistent changes during singing (Riede et al. 2006; Riede and Suthers 2009; Ohms et al. 2010; Riede and Goller 2010a). OEC size is regulated through movements of the hyoid skeleton (Homberger and Meyer 1986; Riede et al. 2006; Riede and Suthers 2009; Prince et al. 2011). Northern cardinals (Cardinalis cardinalis) and white-throated sparrows (Zonotrichia albicollis) increase the volume of the OEC at low fundamental frequencies and reduce OEC volume for syllables with high fundamental frequencies. The birds maintain an inverse relationship between OEC volume and fundamental frequency (Riede et al. 2006; Riede and Suthers 2009). Furthermore, a computer simulation including all major cavities of the upper vocal tract predicts that OEC size introduces a single major resonance whose frequency is shifted as OEC volume is adjusted, whereas other resonance peaks derive from the tracheal cavity (Fletcher et al. 2006). Evidence of a functional relationship between OEC expansion and certain spectral peaks in the spontaneously behaving bird was missing.
The manipulation of OEC movements in vocalizing birds is difficult because these structures, in particular the nearby larynx, play a crucial role in respiration. Frequency sweeps broadcast through the upper vocal tract of dead zebra finches (Taeniopygia guttata) demonstrated the existence of resonances, which could be shifted by manipulating OEC size (Ohms et al. 2010). It remains unclear, whether the resonance peaks observed in the dead bird are present in the live bird. We here investigate the role of OEC size in shaping acoustic characteristics of zebra finch vocalizations by comparing the spectral characteristics of calls and respiratory sounds. Calls demonstrate a stereotypic OEC expansion while respiratory sounds are produced without OEC expansion. First, we present x-ray data for zebra finch vocalization confirming the tight link between OEC movement and sound production. We also tested a custom-built Hall-effect collar system as an alternative, time-efficient and flexible recording procedure for monitoring OEC movements. Secondly, we compared the resonance acoustics in calls and respiratory sounds and tested for effects of variable lung pressure on spectral properties. Third, we further explored the strong indication of a major OEC resonance in the range between 2.5 and 5 kHz, by studying calls produced in heliox and by using a computational approach.
The vocal tract acoustics of zebra finches is distinctive. In contrast to species with tonal songs, adjustment of upper vocal tract structures in the zebra finch are linked to regulation of harmonic emphasis, rather than tracking of the fundamental frequency of song syllables (Williams et al. 1990; Goller et al. 2004; Ohms et al. 2010). Because calls and most song syllables of zebra finches are characterized by low fundamental frequency and rich harmonic spectrum, the analysis of resonance characteristics is facilitated for at least two reasons. First, sounds with low, relatively constant fundamental frequency but rich upper harmonic content are ideally suited for observing modulation of resonance characteristics. In birds with more tonal song syllables (northern cardinal or the white-throated sparrow), whose fundamental frequency is rapidly modulated, resonance peaks change simultaneously and are therefore more difficult to separate. Second, the fundamental frequency of zebra finch song syllables and calls is typically low (between 450 and 1000 Hz), and resonance peaks of the upper vocal tract are expected between 2500 and 5000 Hz. This band of resonance frequencies will therefore affect multiple harmonics, unlike in northern cardinals or white-throated sparrows where the fundamental frequency is adjusted to a single resonance peak and effects on neighboring harmonics are difficult to detect.
Methods
Experiments were performed on fourteen adult male zebra finches. All birds were more than 120 days old. Animals were separately housed in small cages (32 cm × 24 cm × 25 cm). Zebra finches produce various call types (Zann 1996). Distance calls and tet calls are considered in this study.
Cineradiography and video analysis
We performed x-ray analysis in order to test and extend previous analyses on songbirds (Riede et al. 2006, Riede & Suthers 2009), specifically zebra finches (Ohms et al. 2010). Because in previous work only song was analyzed, we focus on calls to avoid methodological problems. X-ray videos were collected successfully from six males. Digital biplanar x-ray imaging was performed at 1,000 frames/sec (50 kV, 100 mA; Neurostar, Siemens, Munich, Germany). Calls were recorded from each bird as it sang spontaneously in the X-ray beam while sitting in a cage on a single perch. The machine was adjusted so that the bird's head was about 10 cm in front of one image screen (dorso-ventral view) and about 10 cm in front of the other image screen (latero-lateral view).
Sound was recorded by a small omnidirectional electret microphone (Radio Shack 33–3013; frequency response between 70 and 16000 Hz) inserted into the recording chamber onto PC (sampling frequency 44.1 kHz). Sound and video recordings were successfully synchronized in 43 out of 58 sequences using an acoustic marker coinciding with the last recorded video frame.
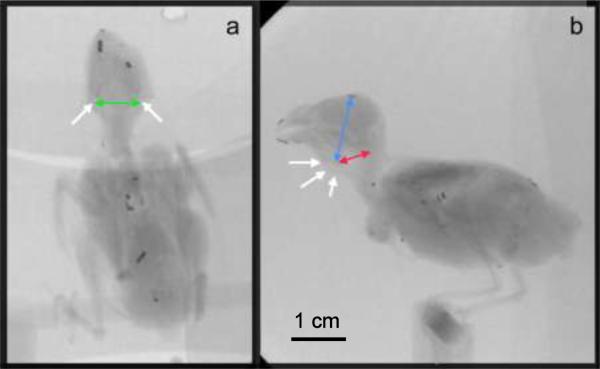
Video analysis was performed with MaxTraq v2.12b (Innovision Systems, Inc.). Distances were computed from the coordinates of 3 points in the latero-lateral image, and from 2 points in the dorso-ventral image. Coordinates were placed either manually or automatically (Fig. 1). The changing shape of the OEC, due to movement of the hyoid apparatus during call production, was analyzed from successive x-ray images taken simultaneously from latero-lateral and dorso-ventral views of the bird. Movement of the hyoid apparatus, and of the larynx to which it is attached, were quantified in each frame of the x-ray movie during call production by measuring two distances in the latero-lateral (LV and LH) and one in the dorso-ventral view (Cornua). LV is the distance between the larynx (basihyoid) and the mid-point of the second vertebra. LH is the distance between the larynx and the dorsal edge of the beak-skull transition. `Cornua' refers to the distance between the most ventral point of the cornua of the hyoid apparatus. Distances were computed from the coordinates of two points selected manually in each frame. Beak gape, the distance between the tip of the maxilla and mandible, was measured from the X-ray image using two metal markers attached to upper and lower beak (Fig. 1).
Figure 1.
Dorso-ventral (a) and latero-lateral (b) x-ray images of a zebra finch with superimposed arrows to indicate the measurements taken for quantifying OEC movement. Green arrow, distance between cornuae; red arrow indicates distance between the larynx (basihyoid) and the mid-point of the second vertebra, LV; blue arrow indicates distance between the larynx and the dorsal edge of the beak-skull transition, LH; white arrows in a point to the most ventral point of the left and right cornua of the hyoid apparatus, and to the larynx in b. Metal markers were attached to the tips of upper and lower beak, which allowed the automated tracing of beak movements. The images show a number of additional metal markers used for a different study.
A reference cuboid (20 × 12 × 12 cm) with metal spheres inserted at 1 cm distance and positioned at the sagittal and horizontal levels of the bird allowed accurate calibration of distance measurements. The grid was recorded before and after each session. In order to estimate how much the larynx and cornua move during calling, the maximum displacement was calculated. The maximum displacement was calculated relative to a baseline during quiet respiration. The baseline was averaged over 100 frames before or after a call production. The length of each distance during call production was calculated by averaging over 10 frames during the middle of the call.
A custom-designed Hall-effect collar system
Recording upper vocal tract movement in an x-ray machine is quite involved, we therefore additionally developed and tested a technique for measuring OEC dynamics continuously in birds that reside in their experimental cage. A custom-built collar system was employed for investigating OEC movement before and during the following nerve cut experiments.
Birds (n=3) were deprived of food and water for 1 h before surgery, and were anesthetized with isoflurane. The collar system consists of a magneto-sensitive transducer that is attached to a ring (Fig. 2). The collar system uses a Hall-effect transducer (Newark; # 65K5149) that is mounted in front of the bird's throat via a ring. A small piece of rare earth magnet was sutured to the skin a few millimeters below the beak along the midline. The ring was mounted on the skull of the bird with dental cement, such that the transducer was located several millimeters in the front of the throat. Adjustment of the volume of the OEC results in movement of the magnet piece relative to the transducer, inducing a change in the output voltage. Because of variation in distance between magnet and sensor, the output voltage signal was specific to each individual's setup and was not comparable between birds. This did not undermine the study, however, because the goal was to test upper vocal tract movements before and after syringeal denervation.
Figure 2.
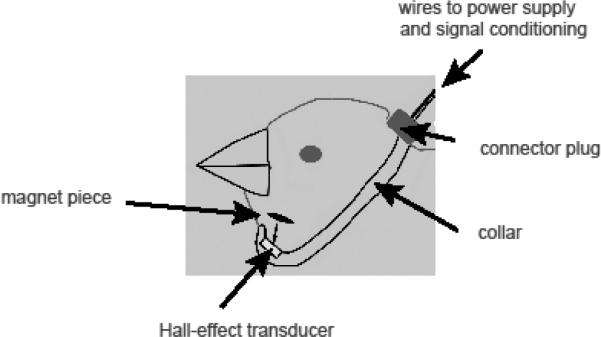
Schematic of the custom-built collar system consisting of a Hall-effect transducer mounted on a non-magnetic ring. The ring was attached on the back of the head. A small piece of rare earth magnet was mounted on the skin above the larynx. If OEC was enlarged, the magnet moved towards the transducer and thereby caused a voltage change, which reflects the change in distance between the magnet piece and the Hall-effect transducer.
The recording of upper vocal tract movements was combined with air sac pressure measurements and acoustic recording. Subsyringeal air sac pressure was measured in the anterior thoracic air sac. An elastic belt with a Velcro tab on the back was placed around the thorax of each experimental bird. A small hole was made in the abdominal wall into the left posterior thoracic air sac, and the tip of a flexible cannula (Silastic tubing; 1.65 mm o.d., 6 cm length) was inserted into this hole. The cannula was sutured to the rib cage. The cannula insertion site was sealed with tissue adhesive (Nexaband) to prevent leakage of air. The free end of the tube was connected to a piezoresistive pressure transducer (MSI, Model 1451), which was mounted on the Velcro tab.
Tracheosyringeal nerve transections
We recorded sound production before and after bilateral denervation of the syringeal muscles to assess how OEC expansion contributes to resonance properties of vocalizations. Bilateral denervation of the syringeal muscles results in sound production during normal breathing when the bird takes deep breaths (respiratory sounds). The collar system demonstrated that respiratory sounds are produced with no OEC expansion but normal calls are produced with large OEC expansion. Therefore differences in resonance peaks between respiratory sounds and calls should result from sound production with and without OEC expansion, while at the same time ruling out active control of frequency characteristics by the syringeal muscles. The fundamental frequency of respiratory sounds does not differ from that of calls after nerve cuts (Riede et al. 2010).
After recording calls in the intact bird syringeal muscles were denervated by bilateral tracheosyringeal nerve resection. Using isoflurane anesthetic, a skin incision was made in the ventral neck. On each side a 1 cm-long piece of the tracheosyringeal nerve was excised in seven birds, three of which were also equipped with a collar system.
Calls and respiratory sounds were recorded with a condenser microphone (AT8356; Audiotechnica, Stow, OH, USA) placed in front of the cage. Vocalizations and respiratory sounds were recorded using Avisoft Recorder software (www.avisoft.de), with a 44.1 kHz sampling frequency. Acoustic measurements were performed using sound analysis software (PRAAT, version 4.1; www.praat.org). Sound files were down-sampled to 22.1 kHz and band-pass filtered between 0.2 and 10 kHz. The spectral energy of calls and respiratory sounds was estimated by first calculating an FFT spectrum (PRAAT function “To spectrum”). The 0 dB value occurs when the measured intensity is equal to the reference level (0.02 mPa). The distance between bird and microphone was relatively constant, allowing for within-bird comparisons. Then the envelope of the spectrum was estimated with PRAAT function “LPC smoothing”, which uses a linear predictive coding procedure (LPC, autocorrelation method). Four to five spectral peaks were expected between 0 and 10 kHz. A pre-emphasis frequency of 50 Hz was selected. The smoothed spectrum was overlaid on the original FFT spectrum for visual confirmation that the LPC envelope represents a reasonable estimate of the spectral energy. The spectral envelopes were averaged for several utterances.
Predicting resonances with Fletcher's model of a songbird vocal tract (Fletcher et al. 2006)
Based on morphological data and in vivo imaging data (Riede et al. 2006), Fletcher et al. (2006) developed a computational model that presented the basic features of the vocal tract of a songbird. The model has effectively reproduced upper vocal tract filter characteristics in northern cardinals (Cardinalis cardinalis) (Fletcher et al. 2006) and in white-throated sparrows (Zonotrichia albicollis) (Riede and Suthers 2009). Here we use this model with anatomical measures from zebra finches, (a) in order to test the computer model in a third species, and (b) to validate experimental results. The following anatomical parameters are implemented: tracheal length, tracheal diameter, width of the glottis, OEC volume, beak gape.
While tracheal length (35 mm), tracheal diameter (2 mm), glottal constriction (2mm) and acoustic loading produced by beak gape, are kept constant in this model, the volume of the OEC was varied (0.5 ml, 1 ml and 2 ml). The OEC is actively enlarged or collapsed with the help of the hyoid skeleton and respective musculature. The maximum size of the OEC is estimated from cast impressions. Maximal glottis opening is estimated from manual ab- and adduction maneuvers in a freshly killed bird. Maximum glottal width is similar to the tracheal diameter. Estimates of the magnitude of beak gape were taken from an earlier study (Goller et al. 2004).
Results
To determine the acoustic effect of OEC expansion, we performed 3 types of experiments. First, descriptive experiments established that call production is associated with OEC expansion, that respiratory sound production after nerve cuts is associated with no OEC expansion, and that a Hall-effect collar system can reliably track OEC movement in both utterances. Secondly, control measurements tested for the influence of air sac pressure on resonance acoustics, and heliox experiments confirmed that the suspected spectral peaks are resonance frequencies. Thirdly, a computer model of the songbird's vocal tract was tested and used to evaluate current findings.
Tracking vocal tract movements by cineradiography
Song production was accompanied by a dynamic and stereotyped pattern of OEC expansion (Fig. 3A). Whereas the quantification of OEC expansion shows clearly that it is dynamically adjusted during song, x-ray recordings present significant challenges to measuring absolute changes in OEC volume. Zebra finches perform a courtship dance while singing directed song (e.g., Zann 1996; Williams 2001), and the movements associated with this dance cause head position to change. These movements lead to changes in observation angles throughout the song. Each movement of head and neck leads to small changes in the baseline for each of the three distances. For example, between syllables 6 and 9 (Fig. 3A) the bird moved the head slightly from the left side to the right side, causing a shift in the baseline. Although the amplitude of each OEC expansion is approximately similar with repetitions of the song syllable, it is not clear to what extent head position contributes to the observed variation between repetitions of the song motif. Because of the uncertain influence of head position, we focused our analyses on calls. The short duration of calls and the lack of a stereotyped association with head movements minimized the possible interference of head movements with the measurements.
Figure 3.
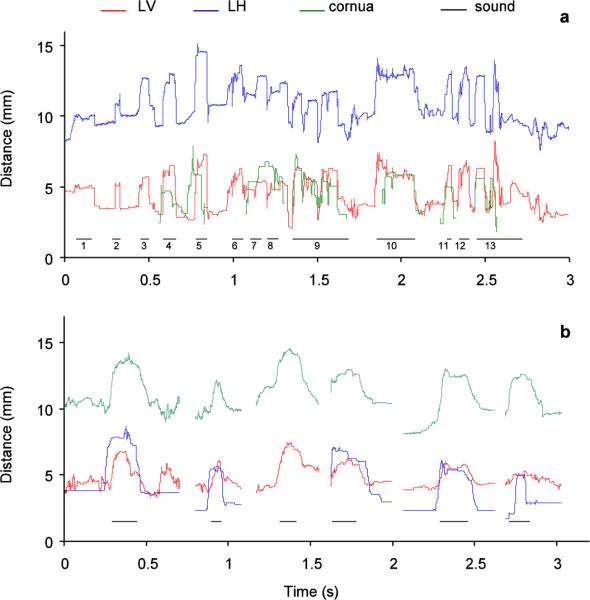
a: The song from a male zebra finch is accompanied by an increase of the oropharyngeal-esophageal cavity (OEC; measured distances color coded as indicated in Fig. 1). The song consists of seven syllables (7 through 13) and is preceded by introductory notes (1 through 6). b: calls (1 call from each of six male zebra finches) are also accompanied by coordinated movements of the larynx and hyoid cornua that increase the volume of the OEC. The horizontal lines indicate the duration of the vocalization.
During call production, movements of the larynx and the hyoid apparatus were similar in all males. The onset of each call was consistently accompanied by a prominent increase in OEC volume (Fig. 3B). This increase was effected by movement of the larynx away from the vertebral column and skull (distances labeled LV, LH) and a lateral displacement of the cornua (Fig. 3B). The laryngeal movement also resulted in a downward displacement of the trachea.
For the two identified call types, tet call and distance call (DC), OEC geometry was not significantly different as indicated by the three distance measurements (Table 1). The rather large variability is only to a small extent due to head movements but rather reflects individual differences (Table 1). The louder DC was accompanied by larger beak gape (paired t-test comparing means, t=−2.5, P=0.043).
Table 1.
Hyoid displacement measured as three distances, beak gape and caudal displacement of the trachea during call production. LV, distance between larynx and second vertebrae; LH, distance between larynx and the dorsal edge of the beak-skull transition. `Cornua' refers to the distance between the most ventral points of the left and right cornua of the hyoid apparatus (see Fig. 1).
| Bird | Call type/duration (ms) | LV (mm) | LH (mm) | Cornua (mm) | Beak (mm) | Trachea (mm) |
|---|---|---|---|---|---|---|
| 1 | tet | 2.3±0.8 | 2.5±0.8 | 4.3±1 | 0.3±0.3 | 1.8±0.8 |
| <100 | N=10 | N=10 | N=10 | N=12 | N=8 | |
|
| ||||||
| DC | 2.4 | 3.4 | 4.0 | 0.6 | 1.3 | |
| 180 | N=1 | N=1 | N=1 | N=1 | N=1 | |
|
| ||||||
| 2 | tet | 1.4±0.7 | 2.2±0.8 | 2.4 | 0.3±0.1 | 1.8±0.6 |
| <100 | N=7 | N=7 | N=1 | N=7 | N=3 | |
|
| ||||||
| 4 | tet | 2.2 | 3.3 | 3.8 | 0.1 | 1.1 |
| <100 | N=2 | N=2 | N=1 | N=2 | N=2 | |
|
| ||||||
| DC | 1.3±0.5 | 3.0±0.6 | 3.7 | 0.8±0.5 | 1.3 | |
| 140–180 | N=6 | N=6 | N=2 | N=6 | N=2 | |
|
| ||||||
| 5 | tet | 1.9±0.8 | 3.1±1.7 | 3.5 | 0.8±0.4 | 1.5±0.1 |
| <100 | N=4 | N=4 | N=2 | N=4 | N=3 | |
|
| ||||||
| DC | 1.7±0.8 | 3.4±1.0 | 4.4 | 0.8±0.6 | 1.6±0.4 | |
| 140–180 | N=7 | N=7 | N=2 | N=7 | N=7 | |
|
| ||||||
| 6 | tet | 1.1 | 2.1 | 2.3 | 0.3 | 1.3 |
| <100 | N=2 | N=2 | N=1 | N=2 | N=1 | |
|
| ||||||
| DC | 1.2 | 2.5 | 3.2 | 0.9 | 1.3 | |
| 140 | N=2 | N=2 | N=1 | N=2 | N=2 | |
In tet calls and the DC the larynx was moved very rapidly to its new position during the call, but because of the longer duration of the DC, different temporal patterns of OEC expansion followed this initial movement in the two call types (Fig. 3B). In both cases, laryngeal movement ranged from 1 to 2.3 mm in the ventral direction (LV), and the larynx was lowered by 2 to 4.4 mm (LH) (Table 1). The lateral movement of each hyoid cornua was on average 1 to 2 mm, assuming that the left and right cornua moved symmetrically (increase of the distance between left and right cornua was 2 to 4 mm) (Table 1). In all six males, the beak was opened less than 1 mm during these two call types (Table 1).
Tracking vocal tract movements with a Hall-effect collar system
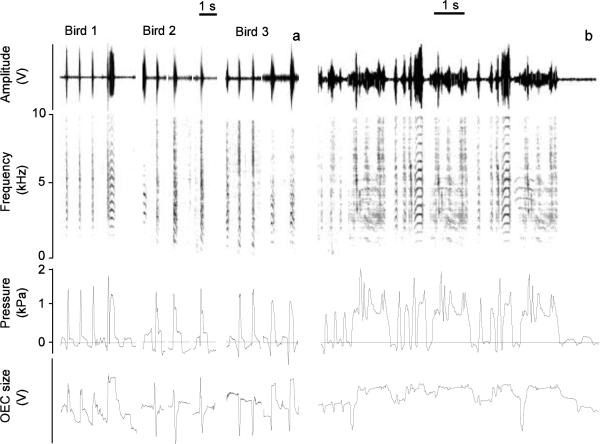
The collar system provided a voltage signature of the stereotypic expansion of OEC associated with call and song production. Figure 4 shows examples of OEC movements tracked with the collar system during the production of different call types from three males and song from one male. The voltage signature of OEC expansion was different between males as slight differences in mounting the collar system and magnet changed the spacing between Hall-effect sensor and magnet. However, within each male, a clear difference in voltage signature between call types confirmed the results from the x-ray recordings. OEC expansion patterns were fairly stereotyped within call types, and DCs were accompanied by greater expansion that was maintained for the longer duration as compared to tet calls (Fig. 4). The dynamic OEC adjustments during song, as seen in the x-ray analysis (Fig. 3A), were also confirmed by the magnetic recordings. Each syllable was accompanied by a characteristic and stereotyped pattern, and resting position is not always fully restored between syllables during which mini-breaths are taken. The collar system suggests the OEC is partially expanded throughout most of the song with differentiated movement for different syllables (Fig. 4B).
Figure 4.
The collar system can trace increases of the OEC during call (a) and song (b) production. Sound is depicted as time waveform (top panel, Amplitude, relative change in output voltage of microphone signal) and spectrographically (second panel). Subsyringeal air sac pressure (panel 3; horizontal line indicates ambient pressure) and OEC signals (panel 4; relative change in output voltage of Hall effect transducer) indicate that different call types are accompanied by different OEC signals. For example, birds 1 and 3 start with three short calls, followed by one and two, respectively, distance calls.
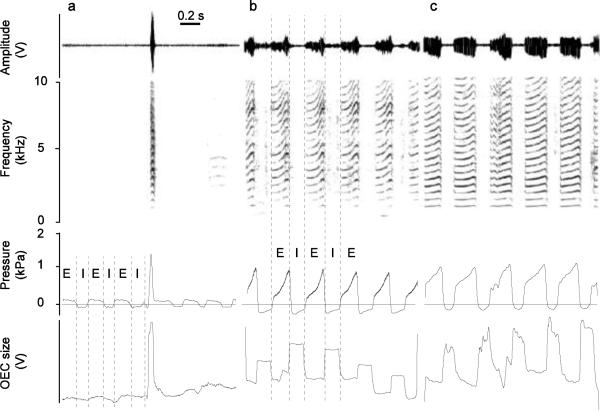
The main purpose of the use of the collar system in this study was to verify whether or not OEC movement patterns are different between respiratory sounds elicited by a bilateral ts-nerve transection and normal call production. Before nerve transection almost no hyoid movement was observed during quiet respiration in the x-rayed birds or the bird equipped with Hall effect transducer (Fig. 5A). After ts-nerve cuts, two out of the three zebra finches fitted with the collar system produced respiratory sounds, and in both OEC size was not increased for these sounds (Fig. 5B,C, 6). The most prominent hyoid movement caused an OEC expansion during inspiration (Fig. 5B,C). However, if calls were produced in addition to the respiratory sounds, a distinct OEC expansion occurred, and this expansion was much larger than during respiratory sound production and also larger than the one observed during the inspirations (Fig. 6 A–C). The difference between a small (or collapsed) OEC during respiratory sounds and a large OEC expansion during DC production allowed us to compare the effect of OEC size on the spectral composition of harmonic stack syllables.
Figure 5.
The collar system can also trace differences in hyoid movement before (a) and after (b, c) nerve transection. Sound is depicted as time waveform (Amplitude, top panel) and spectrographically (second panel). Subsyringeal air sac pressure (panel 3) and the Hall effect sensor signal (panel 4) indicate that before nerve transection there is almost no hyoid movement during quiet respiration. Only a small shift in baseline associated with overall body movements can be noticed over 6 respiratory cycles in the Hall effect signal. At the beginning of the fourth expiratory phase, the bird produces a tet call, which is associated with a large Hall effect signal deflection indicating a prominent OEC expansion. b. Respiratory sounds from the same zebra finch indicate that nerve transection causes more OEC expansion during quiet breathing, but the main expansion occurs during inspiration. OEC size is smallest during expiration when sound is produced. The relative scale for OEC expansion is the same for a and b, indicating larger OEC expansion during sound production than during inspiratory expansion. c. The respiratory sounds of another zebra finch are also generated during expiration, and OEC expansion occurs during inspiration. Comparison of scale for OEC expansion between the birds (a, b and c) is not possible as explained in the main text. Panels as in Figure 4. I, inspiratory phase; E, expiratory phase; units as in figure 4.
Figure 6.
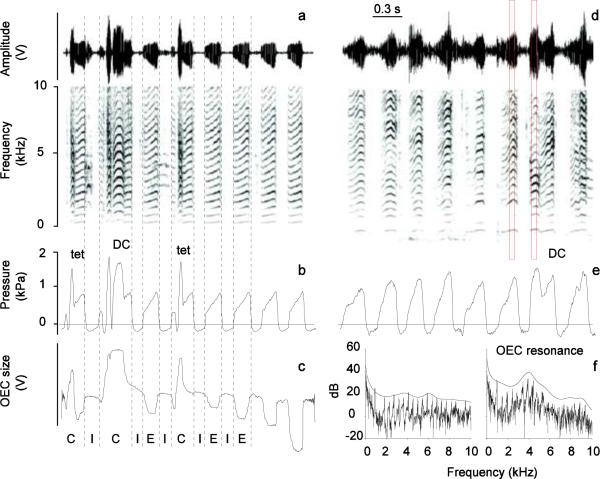
Spectrograms of distance calls (DC) and short calls (tet) embedded in a series of respiratory sounds contrast the resonance pattern of the two sound types. Time waveform and spectrogram of the microphone signal (a and d), subsyringeal air sac pressure (b and e) and OEC size measured with the Hall effect collar system (c) of respiratory sounds and calls from male zebra finch 7 (a,b,c) and 9 (d,e). The Hall effect sensor signal shows that the OEC size is the largest during call production, it is enlarged during inspiration and smallest during expiration/respiratory sound production. f: Power spectra of two 50 ms segments (left: respiratory sound; right: DC; red boxes in d) overlaid by a smoothed envelope curve, indicating the OEC resonance peak. I, inspiratory phase; E, expiratory phase; C, call; units as in figure 4.
The acoustic effect of OEC size adjustments
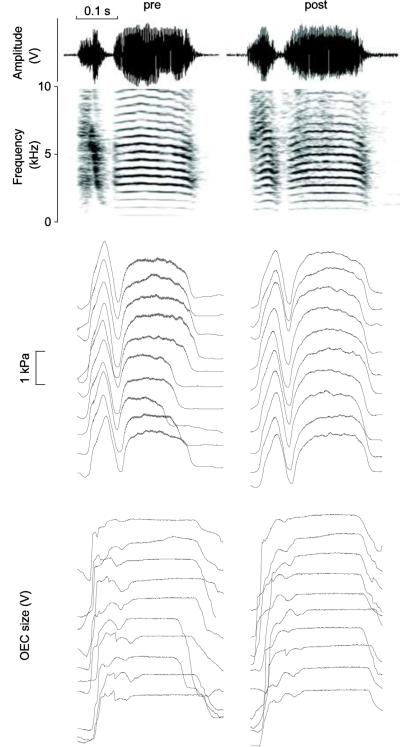
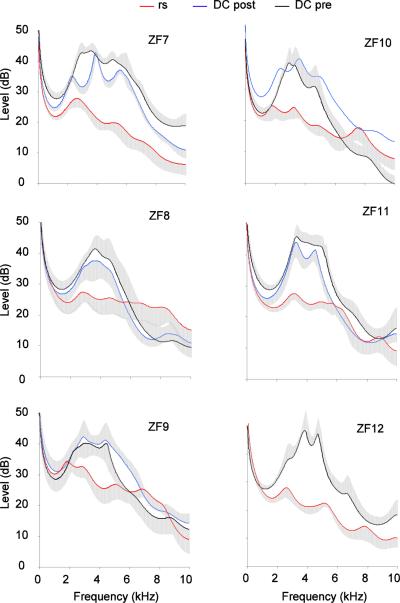
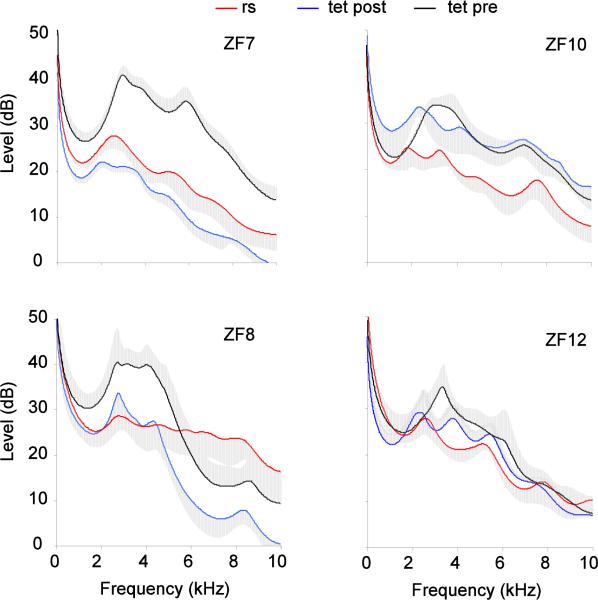
Denervation of the syringeal muscles did not cause a major change in hyoid movements during calls (Fig. 7). Before and after denervation of the syrinx, the range of elevated resonance spanned approximately between 2 and 5 kHz (Fig. 6, 8). In some cases an additional peak occurred near 8 kHz. This range of elevated resonance was more pronounced for DC than for the shorter tet calls (Fig. 8). In contrast, respiratory sounds did not show a marked resonance peak between 2 and 5 kHz as is characteristic for calls (Fig. 6F), despite their rich harmonic structure with low fundamental frequency and its similarity to calls after denervation (e.g., Riede et al. 2010). Spectrographic display of calls within a series of respiratory sounds (Fig. 6A,D) already indicates that a clear difference in harmonic emphasis existed between respiratory sounds and calls. This difference occurred consistently, leading to non-overlapping variation ranges in the resonance plots. Figure 8 shows average LPC curves (standard errors of amplitude as grey area) for ten sounds.
Figure 7.
Spectrograms of two distance calls from the same male zebra finch before and after denervation of the syringeal muscles. Time waveform and spectrogram (top two panels), subsyringeal air sac pressure patterns from ten calls (third panel) and Hall effect signal reflecting the OEC expansion patterns during ten calls (fourth panel). These traces indicate that air sac pressure and OEC patterns of DC did not change after the denervation of the syringeal muscles; units as in figure 4.
This important difference in resonance cannot be explained by the effects of denervation of the syrinx on oscillation behavior of the labia, which generates an altered source spectrum. Although small changes to the harmonic spectrum of DCs and tet calls resulted from the denervation (Fig. 8A,B), the robust difference in harmonic emphasis between respiratory sounds and calls cannot be explained by these changes.
Figure 8a.
Spectral envelopes of 50 ms segments of respiratory sounds (rs) and distance calls (DC) before and after denervation of the syringeal muscles in six male zebra finches. Each trace represents the mean (line) and standard errors (grey area) of traces from ten sounds, except for ZF 10 where only one DC was available after the nerve transection.
Figure 8b.
Spectral envelopes of 50 ms segments of respiratory sounds (rs) and tet calls before and after denervation of the syringeal muscles in four of the six male zebra finches for which data are illustrated in Figure 8a. Each trace represents means (line) and standard errors (grey area) from traces of ten sounds.
No effect of air sac pressure on resonances and a heliox test
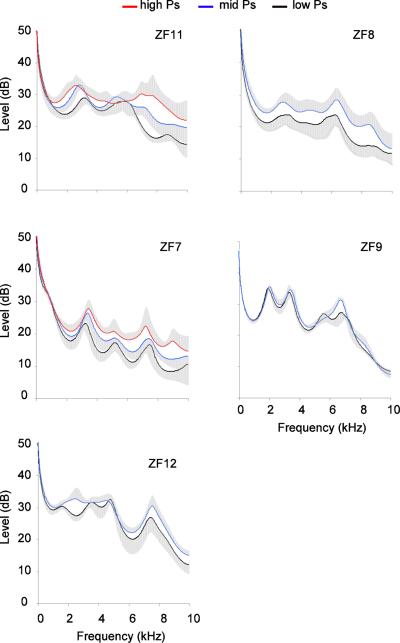
As can be readily seen from examples (Fig. 6), respiratory sounds were generated with variable air sac pressure amplitude, often lower than calls. The highest pressure values for respiratory sounds approached those for tet calls (Fig. 6). To test to what degree air sac pressure may account for the observed differences in resonance between calls and respiratory sounds, we compared spectra of respiratory sounds that were generated with different air sac pressure values. Spectral envelopes of respiratory sounds produced with low (0.5 to 0.75 kPa), middle (0.76–0.9 kPa) and high (> 1 kPa) peak air sac pressure were calculated. Although respiratory sounds tended to become louder with increased air sac pressure, this difference did not result in a substantial change in the range of observed resonances nor their relative prominence (Fig. 9).
Figure 9.
Spectral envelopes of 50 ms segments of respiratory sounds produced with low (0.5 to 0.75 kPa), middle (0.76–0.9 kPa) and high (> 1 kPa) peak air sac pressure. Each trace represents means (line) and standard errors (grey area) from traces of ten sounds.
As a further test that the occurrence of a prominent resonance range during calls is the product of upper vocal tract filtering and does not reflect a difference in sound generating mechanisms at the level of the sound source, we compared DCs of birds that breathed either normal air or a helium-oxygen mixture. A clear shift in the resonance range to higher frequencies was observed (Fig. 10). This shift is consistent with the predictions of resonance in a light gas with increased sound velocity (Nowicki 1987). These data also provide confirmation that the technique of displaying resonance properties is suitable for exploring and illustrating resonance differences.
Figure 10.
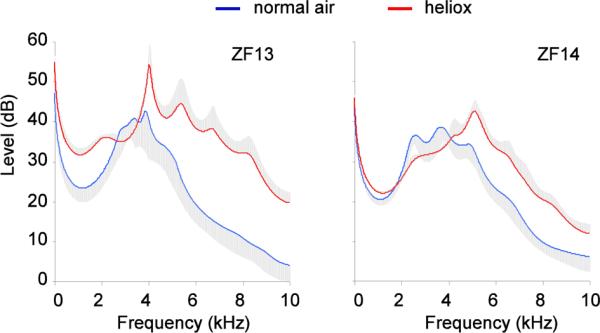
Spectral envelopes of 50 ms segments of distance calls produced in normal air and in a mixture of oxygen and helium (heliox). A clear upward shift in the frequency range of enhanced resonance occurred in heliox, as predicted by the higher sound velocity in the lighter gas. Each trace represents means (line) and standard errors (grey area) from traces of ten sounds.
Predicting resonances with Fletcher's computational model of the songbird's vocal tract
Finally, we tested how well the experimental evidence fits our theoretical understanding of the multi-faceted upper vocal tract filtering mechanisms. To do so, we injected the OEC with dental impression medium and arrived at an estimate of its extended maximum volume of 2 ml. We used this volume estimate as the upper value and calculated resonance peaks for the OEC volumes of 0.5, 1 and 2 ml, while holding tracheal length and diameter constant. Resonance peaks at 2.5 and 7.5 kHz are attributed to resonance properties of the trachea. More importantly for this study, the model predicts that the major resonance peak shifts between 2.8 and 5.5 kHz as OEC volume decreases (Fig. 11), confirming our experimental results.
Figure 11.
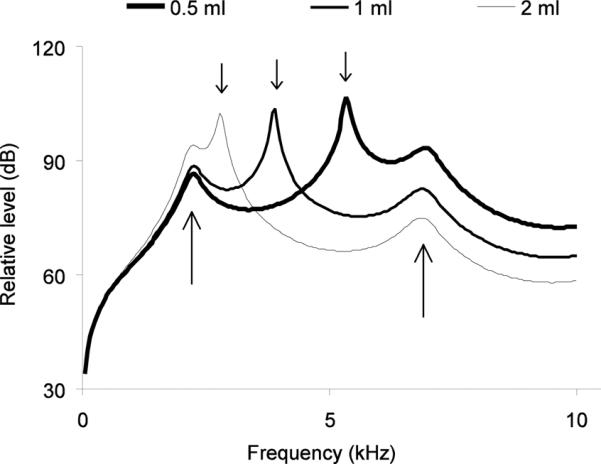
Relative radiated power level as a function of frequency, for a constant input volume flow at the syrinx, with a OEC volume of 0.5, 1 or 2 ml and constant values for beak gap. The location of the variable OEC resonance peak depends on OEC volume (small black arrows on top). In the range up to 10 kHz, there are two tracheal resonances near 2.5 kHz and 7 kHz (indicated by two long arrows). Fletcher et al. (2006) suggested that if the tracheal resonance and the OEC resonance coincide, there will be a summation effect. OEC size in zebra finches measured by injecting cadavers with dental cast reaches a maximum of about 1.5 ml. This volume suggests an OEC resonance around 5 kHz, which is comparable with the first resonance peak in distance calls (Fig. 8).
Discussion
Upper vocal tract movements are an intricate part of the complex motor activity that produces vocal behavior. As in other species, song in the zebra finch is accompanied by rapid dynamic adjustments of OEC volume and beak gape (e.g., Riede et al. 2006; Riede and Suthers 2009; Ohms et al. 2010; this study). Unlike the other investigated species with tonal song syllables, the rich harmonic content of zebra finch syllables, combined with the highly dynamic nature of upper vocal tract movements, makes it difficult to establish the precise relationship between these movements and correlated acoustic effects. Furthermore, head movements associated with song result in measurement errors of OEC movements from x-ray images, adding a further complication to assessing the precise role of the OEC in upper vocal tract filtering.
Correlations between OEC movement and harmonic spectra suggest that during zebra finch song, adjustments in the volume of the OEC alter the resonance properties and therefore modulate the harmonic emphasis in spectrally rich syllables (Ohms et al. 2010; this study, Fig. 4). Direct tests of this hypothesis are not easy to perform, because (a) laryngeal movements are also important in ensuring airway patency, restricting possible manipulations of OEC movements during song, and (b) anatomy tightly links beak, OEC, larynx and trachea mechanically. Playback of sound through the upper vocal tract in dead birds can show resonance effects (Ohms et al. 2010). The controlled manipulation of beak, OEC, larynx and trachea, however, is more complicated. It is unlikely that pulling on the hyoid skeleton can reproduce the natural movements, and conclusions must, therefore, be drawn very carefully. For example, a peak at 1 kHz in the playback experiment does not occur in the intact, spontaneously vocalizing zebra finch.
Spectral differences between calls and respiratory sounds show an OEC resonance
The paradigm employed here uses involuntary sound generation without manipulating the vocal tract. These involuntary sounds are best compared to calls, because they are of similar duration and share similar fundamental frequency after denervation of the syrinx. As during song, distinct and stereotyped OEC expansion accompanies tet calls and DCs, but during respiratory sounds such movements are absent. The use of calls also eliminates, to a large degree, the potentially confounding effects of beak movements. Beak gape was small for both call types (< 1 mm) and for respiratory sounds and in both cases was substantially less than typical peak values (several mm) during song (Williams 2001; Goller et al. 2004; Ohms et al. 2010).
The difference between respiratory sounds and both call types suggests that the movement of the OEC is responsible for generating resonance peaks in the frequency range 2.5–5 kHz. To verify this interpretation, it is important to ascertain that the experimental manipulation did not cause a source-generated shift in harmonic structure. Two possible alternative explanations could be eliminated in this study. (1) Because denervation causes a drop in the fundamental frequency of calls and frequency control is exerted by pressure alone, it might be possible that the harmonic content of vocalizations changes. The small difference in the range of elevated resonance between the calls before and after the denervation strongly indicates, however, that source-generated changes in harmonic structure are small compared to those effected by the resonance peak attributable to the OEC movement. (2) The subsyringeal air sac pressure driving airflow across the sound generating labia can affect their vibratory characteristics by influencing labial tension and amplitude of movement, a phenomenon well described for vocal fold oscillation (Titze 1989). In zebra finches the effect of an increased lung pressure on fundamental frequency is about 35 Hz/kPa (Riede et al. 2010). It is therefore important to establish that pressure differences between respiratory sounds and calls cannot also explain the observed differences in resonance levels. This possibility can be excluded, because the level of driving pressure during respiratory sounds did not have a major effect on the range of resonance frequencies. Because the relative level of the resonance peaks was affected, it is not possible to quantify the exact level of resonance enhancement that is caused by OEC adjustment during the calls. If the level of resonance enhancement achieved by OEC movements is not independent of the driving pressure, differences between respiratory sounds and calls might contribute to the absolute level of resonance enhancement during calls. Furthermore, because recording conditions are not standardized, variability in the bird's position relative to the microphone also makes quantification of the resonance gain difficult.
We therefore conclude that the acoustic effects of the OEC expansion include the establishment and shifting of resonance peaks in the range between 2.5–5 kHz. Because beak movements are small during calls and respiratory sounds, and the OEC movement differs strikingly between the two, we attribute the observed range of resonance between 2.5–5 kHz to the adjustment in OEC volume that accompanies calls and song. For calls, this range is set for the entire duration of the short vocalization. During song, the dynamic change in OEC volume during single, long-duration syllables must cause an adjustment of the peak resonance frequency.
This conclusion is consistent with the results from simulation approaches. Using estimates for the dimensions of upper vocal tract structures, the Fletcher model (Fletcher et al. 2006) predicts resonance peaks contributed by the OEC in the frequency range 2.8–5.5 kHz, which is in good correspondence with the measured resonance peaks during calls. Similarly, when the effects of OEC adjustment are included as Helmholtz resonance into the upper vocal tract filtering mechanisms of a sound production model, the reproduction of harmonic emphases of zebra finch song improved substantially (Sitt et al. 2010; Perl et al. 2011). The range of resonances predicted by these models also confirms that some of the resonances observed in the playback experiment (Ohms et al. 2010) are likely to be an artifact of the experimental manipulation and do not reflect filter properties of the intact, spontaneously vocalizing zebra finch.
Effects of OEC resonance shifts and its motor coordination
Although it was not a goal of this experiment to test whether or not the change in auditory feedback following denervation was accompanied by a change in upper vocal tract movements, the recordings indicate that such compensation did not occur. The OEC movements, as measured with the collar system, did not change markedly for calls and song during the short period recording (1–4 days).
The dynamic adjustments of upper vocal tract filter characteristics in the zebra finch are important in generating harmonic emphases similar to formant frequencies in human speech. This study shows that OEC volume contributes strong resonance peaks in the frequency range 2.5–5 kHz. It is still unclear to what degree the other components of upper vocal tract movements (beak, larynx and trachea) interact with the OEC in shaping resonance changes, but significant interactions are suggested by the experiment in cadavers (Ohms et al. 2010). It is also possible that specific tuning of the OEC and the other components of the upper vocal tract generates nonlinear source-filter interactions (Zollinger et al. 2008, 2011; Arneodo et al. 2011; Elemans et al. 2010). This possibility is likely to be more important during song with its more dynamic upper vocal tract movements than are present during call production.
Little is known about the motor coordination of the various upper vocal tract movements, in regard to functional connections, while the neural substrate for such coordination could be the ventromedial part of the parvocellular part of reticular formation (RPvcm), which is the pre-motor nucleus for upper vocal tract structures (Wild and Krützfeldt 2011). It is not clear whether movements of the different components, such as beak and OEC, are functionally linked during either their activity in ensuring airway patency during silent breathing or during vocal behavior. In addition, upper vocal tract movements must also be coordinated with the motor systems of primary sound production, especially respiratory movements. The most likely neuroanatomical link between respiratory pattern generating networks and upper vocal tract structures are RPvcm neurons, which extend dendrites into respiratory-vocal pre-motor nuclei (retroambigual and parambigual nucleus). RPvcm receives input from the lateral arcopallium (Wild and Farabaugh 1996; Dubbeldam et al. 1997; Wild and Krützfeldt 2011), but no direct input from the arcopallial song motor control nucleus RA (robust nucleus of the arcopallium). The nerve cut experiments show that during deep breathing, OEC movements occur during inspiration, whereas during vocal behavior the OEC movements are larger and occur during expiration. This switch in temporal coordination of OEC movements with respiratory phase is interesting in regard to how central vocal control affects the more basal synchronization between movements for pressure generation and upper respiratory structures. In addition to the temporal coordination, it is possible that linked control also extends to synchronized amplitude adjustments. For example, a link between beak gape and respiratory effort was suggested for DCs (Goller et al. 2004), but it is not known whether similar linked amplitude control exists for adjustments of the OEC volume.
In conclusion, we provide a first experimental test of the hypothesis that volume changes associated with OEC movements affect the resonance properties of the upper vocal tract and conclude that these movements can shift resonance peaks in the frequency range between 2.5 and 5 kHz in the zebra finch. Because of the low fundamental frequency of zebra finch vocalizations this shift in resonance is expressed in different emphasis of upper harmonic content. Further tests of this hypothesis should involve other species with more tonal vocalizations, for which it was hypothesized that OEC volume is adjusted to match the resonance peak frequency to the fundamental frequency of song syllables.
Acknowledgement
This study was funded by National Institutes of Health Grants DC04390 and DC06876. For their help with the x-ray recordings, we thank R. Petersohn and R. Salzer. Joe Leaman helped with the image analysis. Thanks to Neville Fletcher for his permission to use the model.
Experiments were approved and conducted in accordance with the Animal Welfare Regulations of the state of Thuringa, Germany (Reg.No. 02-021/07) and the IACUC of the University of Utah.
References
- Arneodo EM, Perl YS, Mindlin GB. Acoustic signatures of sound source-tract coupling. Phys Rev E. 2011;83 doi: 10.1103/PhysRevE.83.041920. art. no. 041920. [DOI] [PMC free article] [PubMed] [Google Scholar]
- Dooling RJ. Perception of speech sounds by birds. Adv Biosci. 1992;83:407–413. [Google Scholar]
- Dubbeldam JL, den Boer-Visser AM, Bout RG. Organization and efferent connections of the archistriatum of the mallard, Anas platyrhynchos L.: an anterograde and retrograde tracing study. J Comp Neurol. 1997;388:632–657. doi: 10.1002/(sici)1096-9861(19971201)388:4<632::aid-cne10>3.0.co;2-n. [DOI] [PubMed] [Google Scholar]
- Elemans C, Laje R, Mindlin G, Goller F. Smooth operator: avoidance of subharmonic bifurcations through mechanical mechanisms simplifies song motor control in adult zebra finches. J Neurosci. 2010;30:13246–13253. doi: 10.1523/JNEUROSCI.1130-10.2010. [DOI] [PMC free article] [PubMed] [Google Scholar]
- Fletcher N, Riede T, Suthers RA. Model for vocalization by a bird with distensible vocal cavity and open beak. J Acoust Soc Am. 2006;119:1005–1011. doi: 10.1121/1.2159434. [DOI] [PubMed] [Google Scholar]
- Homberger DG, Meyers RA. Morphology of the lingual apparatus of the domestic chicken, Gallus gallus, with special attention to the structure of the fasciae. Am J Anat. 1989;186:217–257. doi: 10.1002/aja.1001860302. [DOI] [PubMed] [Google Scholar]
- Goller F, Larsen ON. A new mechanism of sound generation in songbirds. Proc Natl Acad Sci USA. 1997;94:14787–14791. doi: 10.1073/pnas.94.26.14787. [DOI] [PMC free article] [PubMed] [Google Scholar]
- Goller F, Mallinckrodt MJ, Torti SD. Beak gape dynamics during song in the zebra finch. J Neurobiol. 2004;59:289–303. doi: 10.1002/neu.10327. [DOI] [PubMed] [Google Scholar]
- Heinz RD, Sachs MB, Sinnott M. Discrimination of steady-state vowels by blackbirds and pigeons. J Acoust Soc Am. 1981;70:699–706. [Google Scholar]
- Hoese WJ, Podos J, Boetticher NC, Nowicki S. Vocal tract function in birdsong production: experimental manipulation of beak movements. J Exp Biol. 2000;203:1845–1855. doi: 10.1242/jeb.203.12.1845. [DOI] [PubMed] [Google Scholar]
- Larsen ON, Goller F. Direct observation of syringeal muscle function in songbirds and a parrot. J Exp Biol. 2002;205:25–35. doi: 10.1242/jeb.205.1.25. [DOI] [PubMed] [Google Scholar]
- Nowicki S. Vocal tract resonances in oscine bird sound production: evidence from birdsongs in a helium atmosphere. Nature. 1987;325:53–55. doi: 10.1038/325053a0. [DOI] [PubMed] [Google Scholar]
- Ohms V, Snelderwaard PC, ten Cate C, Beckers GJL. Vocal tract articulation in zebra finches. PLoS One. 2010;5:e11923. doi: 10.1371/journal.pone.0011923. [DOI] [PMC free article] [PubMed] [Google Scholar]
- Perl YS, Arneodo EM, Amador A, Goller F, Mindlin GB. Reconstruction of physiological instructions from zebra finch song. Phys Rev E. xx:001900. doi: 10.1103/PhysRevE.84.051909. in press. [DOI] [PMC free article] [PubMed] [Google Scholar]
- Podos J, Sherer JK, Peters S, Nowicki S. Ontogeny of vocal-tract movements during song production in song sparrows. Anim Behav. 1995;50:1287–1296. [Google Scholar]
- Prince B, Riede T, Goller F. Sexual dimorphism and bilateral asymmetry of syrinx and vocal tract in the European Starling (Sturnus vulgaris) J Morph. 2011;272:1527–1536. doi: 10.1002/jmor.11007. [DOI] [PMC free article] [PubMed] [Google Scholar]
- Riede T, Fisher JH, Goller F. Sexual dimorphism of the sound generating labia and the cartilaginous framework in the syrinx of zebra finches. PLoS One. 2010;5:e11368. doi: 10.1371/journal.pone.0011368. [DOI] [PMC free article] [PubMed] [Google Scholar]
- Riede T, Goller F. Peripheral mechanisms for vocal production in birds - differences and similarities to human speech and singing. Brain Lang. 2010a;115:69–80. doi: 10.1016/j.bandl.2009.11.003. [DOI] [PMC free article] [PubMed] [Google Scholar]
- Riede T, Goller F. Functional morphology of the sound generating labia in the syrinx of two songbird species. J Anat. 2010b;216:23–36. doi: 10.1111/j.1469-7580.2009.01161.x. [DOI] [PMC free article] [PubMed] [Google Scholar]
- Riede T, Suthers RA. Vocal tract motor patterns and resonance during constant frequency song: the white-throated sparrow. J Comp Physiol A. 2009;195:183–192. doi: 10.1007/s00359-008-0397-0. [DOI] [PMC free article] [PubMed] [Google Scholar]
- Riede T, Suthers RA, Fletcher N, Blevins W. Songbirds tune their vocal tract to the fundamental frequency of their song. Proc Nat Acad Sci. 2006;103:5543–5548. doi: 10.1073/pnas.0601262103. [DOI] [PMC free article] [PubMed] [Google Scholar]
- Sitt JD, Arneodo EM, Goller F, Mindlin GB. Physiologically driven avian vocal synthesizer. Phys Rev E. 2010;81(3) doi: 10.1103/PhysRevE.81.031927. art. no. 031927. [DOI] [PubMed] [Google Scholar]
- Titze IR. On the relation between subglottal pressure and fundamental frequency in phonation. J Acoust Soc Am. 1989;85:901–906. doi: 10.1121/1.397562. [DOI] [PubMed] [Google Scholar]
- Westneat MW, Long J, John H, Hoese W, Nowicki S. Kinematics of birdsong: functional correlation of cranial movements and acoustic features in sparrows. J Exp Biol. 1993;182:147–171. doi: 10.1242/jeb.182.1.147. [DOI] [PubMed] [Google Scholar]
- Wild JM, Farabaugh SM. Organization of afferent and efferent projections of the nucleus basalis prosencephali in a passerine, Taeniopygia guttata. J Comp Neurol. 1996;365:306–328. doi: 10.1002/(SICI)1096-9861(19960205)365:2<306::AID-CNE8>3.0.CO;2-9. [DOI] [PubMed] [Google Scholar]
- Wild JM, Krützfeldt NEO. Trigeminal and telencephalic projections to jaw and other upper vocal tract premotor neurons in songbirds: sensorimotor circuitry for beak movements during singing. J Comp Neurol. 2011 doi: 10.1002/cne.22752. DOI 10.1002/cne.22752. [DOI] [PMC free article] [PubMed] [Google Scholar]
- Williams H. Choreography of song, dance and beak movements in the zebra finch (Taeniopygia guttata) J Exp Biol. 2001;204:3497–3506. doi: 10.1242/jeb.204.20.3497. [DOI] [PubMed] [Google Scholar]
- Williams H, Cynx J, Nottebohm F. Timbre control in zebra finch (Taenopygia guttata) song syllables. J Comp Psychol. 1990;103:366–380. doi: 10.1037/0735-7036.103.4.366. [DOI] [PubMed] [Google Scholar]
- Zann RA. In: Zebra finch: A synthesis of field and laboratory studies. Bamford Michael., editor. Oxford University Press; 1996. [Google Scholar]
- Zollinger SA, Riede T, Suthers RA. Two-voice complexity from a single side of the syrinx in northern mockingbird Mimus polyglottos vocalizations. J Exp Biol. 2008;211:1978–1991. doi: 10.1242/jeb.014092. [DOI] [PMC free article] [PubMed] [Google Scholar]
- Zollinger SA, Goller F, Brumm H. Metabolic and respiratory costs of increasing song amplitude in zebra finches. PLoS ONE. 2011;6(9):e23198. doi: 10.1371/journal.pone.0023198. [DOI] [PMC free article] [PubMed] [Google Scholar]


