

Abstract
Purpose
The diagnosis of pancreatic cystic lesions has increased dramatically. Most are benign, whereas some, such as intraductal papillary mucinous neoplasms (IPMN), represent precursors of pancreatic adenocarcinoma. Therapeutic stratification of IPMNs is challenging without precise information on dysplasia grade and presence of invasion. We assessed the diagnostic benefit of using miRNAs as biomarkers in pancreatic cyst fluid, focusing on IPMNs because of their frequency and malignant potential.
Experimental Design
RNA was extracted from 55 microdissected formalin-fixed, paraffin-embedded (FFPE) IPMN specimens, and 65 cyst fluid specimens aspirated following surgical resection. Expression of 750 miRNAs was evaluated with TaqMan miRNA Arrays using 22 FFPE and 15 cyst fluid specimens. Differential expression of selected miRNA candidates was validated in 33 FFPE and 50 cyst fluid specimens using TaqMan miRNA Assays.
Results
We identified 26 and 37 candidate miRNAs that distinguish low-grade from high-grade IPMNs using FFPE and cyst fluid specimens, respectively. A subset of 18 miRNAs, selected from FFPE and cyst fluid data, separated high-grade IPMNs from low-grade IPMNs, serous cystadenomas (SCA) and uncommon cysts, such as solid pseudopapillary neoplasms (SPN) and cystic pancreatic neuroendocrine tumors (PanNET). A logistic regression model using nine miRNAs allowed prediction of cyst pathology implying resection (high-grade IPMNs, PanNETs, and SPNs) versus conservative management (low-grade IPMNs, SCAs), with a sensitivity of 89%, a specificity of 100%, and area under the curve of 1.
Conclusions
We found candidate miRNAs that helped identify patients with high-grade IPMN and exclude nonmucinous cysts. These classifiers will require validation in a prospective setting to ultimately confirm their clinical usefulness.
Introduction
The past 2 decades have witnessed a dramatic increase in the diagnoses of pancreatic cysts, largely owing to a widespread use of high-resolution imaging (1). Fortunately, a majority of pancreatic cysts are benign, do not cause any symptoms, and may thus be managed conservatively. However, in case of a suspected precancerous or malignant cystic lesion of the pancreas, the individual decision for or against surgery is much more of a challenge. Undoubtedly, valid and cost-effective biomarkers are urgently needed to help answer 2 fundamental questions: (i) does a detected cyst have malignant potential or is it entirely benign? (ii) does a suspected precancerous cyst need to be resected because of possible malignant transformation during a patient’s lifetime?
Intraductal papillary mucinous neoplasm (IPMN) is the most common cystic precursor lesion of pancreatic ductal adenocarcinoma (PDAC), and expectedly, its diagnosis has risen concomitant with increasing use of abdominal imaging. In spite of a comprehensive pathologic and molecular characterization paralleled by a growing awareness of this entity, the clinical management of IPMNs still requires substantial refinement. As one major drawback, it is currently not possible to predict the grade of dysplasia within the lining epithelium of an IPMN without resection and precise histopathologic examination. The preoperative prediction of dysplasia has a direct impact on subsequent management, as IPMNs with low-grade dysplasia (LGD) can potentially be managed conservatively, whereas those with high-grade dysplasia (HGD) would require surgical intervention due to the high probability of synchronous or metachronous invasive neoplasia. To resolve this dilemma, consensus guidelines proposed by an American Pancreatic Association (APA) consortium during a meeting held in Sendai in 2004 (aka “Sendai guidelines”) enabled a more systematic management of IPMNs based primarily on clinical and radiologic features that might predict the presence of underlying HGD or cancer, thus mandating surgery (2). The proposed criteria, although currently the only widely used “standard” for clinical management of IPMNs, have substantial limitations and more accurate means are needed for a tailor-made treatment of pancreatic cysts.
A recent study from our institution by Wu and colleagues has identified a novel and unexpected pathway for the development of IPMNs (3). Using massively parallel DNA sequencing, which included a selection of 169 genes commonly altered in human cancers, it was found that, apart from the expected high rate of KRAS mutations, approximately two-thirds of IPMNs harbored mutations in the GNAS gene at codon 201. None of the other pancreatic cystic entities analyzed [serous cystadenoma (SCA) or mucinous cystic neoplasms (MCN)] harbored a GNAS mutation. Notably, the presence of either GNAS or KRAS mutations was observed in as many as 96% of cyst fluid samples obtained from IPMNs. The authors hypothesized that assessing KRAS and GNAS mutations in cyst fluid specimens collected through EUS-FNA may be informative of the presence or absence of an IPMN with unprecedented accuracy. In spite of this novel opportunity to practically diagnose IPMNs without invasive surgery, it is still impossible to predict the grade of dysplasia or presence of malignancy, nor the biologic behavior of a correctly diagnosed IPMN. This is because GNAS mutations, with high prevalence even in IPMNs with LGD, are presumed to be an initiating or “early” genetic aberration in IPMN pathogenesis, rather than a marker of histologic progression. Thus, there is an urgent need for identifying cyst fluid biomarkers that would be predictive of HGD or invasion, thus stratifying patients for surgery.
miRNAs, another promising class of biomarkers for PDAC, are small (19–24 nucleotides), single-stranded RNA molecules that regulate gene expression (4). Multiple studies have shown differential expression of miRNAs between normal and malignant tissues, and their association with cancer development, diagnosis, and assessment of prognosis (5). miRNAs have been shown to directly function as oncogenes or tumor suppressors (6–9), and aberrant miRNA expression is frequently seen in leukemia (10) and cancers of the lung (11), breast (12), stomach (13), prostate (14), and colon (15), among others. Not surprisingly, aberrant miRNA expression is also observed in PDAC and its precursor lesions, which has generated enthusiasm about their application as potential biomarkers in clinical samples (16, 17). Asuragen pioneered this research field by launching the first miRNA-based laboratory-developed test (LDT), miRInform Pancreas formalin-fixed, paraffin-embedded (FFPE). This LDT is intended to aid the diagnosis of PDAC in FFPE specimens by means of a unique “signature” consisting of miR-196a and miR-217, permitting differentiation of PDAC from chronic pancreatitis. Clinical validation of this 2-miRNA classifier in accordance with Clinical Laboratory Improvement Amendments of 1988 (CLIA) and College of American Pathologists (CAP) regulations provided a sensitivity of 95.2% and a specificity of 94.9% (18, 19). This validation was a key step in the development of a less-invasive miRNA-based test using pancreatic FNAs, for which final pathology is not always available and/or more difficult to obtain. Asuragen has since developed a 7-miRNA signature for use in combination with cytology on FNAs of solid pancreatic lesions to improve false negative rate and resolve inconclusive FNA cytology (manuscript in preparation).
Having established the feasibility of using miRNAs as diagnostic analytes for pancreatic cancer, we hypothesized that IPMNs should show altered miRNA expression profiles that can be detected in the pool of nucleic acids shed into pancreatic cyst fluid. A pilot study using 5 preselected miRNAs in 40 pancreatic cyst fluid specimens confirmed the diagnostic potential of miRNAs and encouraged us to carry out a comprehensive and unbiased miRNA profiling study (20). We and others have shown that miRNAs are stable in different specimen types, including biofluids (16, 19, 21), and that they can be recovered and amplified from these sources. In this study, we show that expression patterns of selected miRNAs in cyst fluid may indicate the grade of dysplasia of an IPMN, thus facilitating therapeutic stratification and, further, may be predictive for other rare cystic lesions that require outright surgical resection [e.g., cystic pancreatic neuroendocrine tumors (cystic PanNET) and solid pseudopapillary tumors (SPN)]. Following validation in a larger cohort, these biomarkers are likely to facilitate improved management of pancreatic cysts.
Materials and Methods
Patients and biospecimens
Details on patients and biospecimens integrated in our study can be found in Supplementary Information, whereas precise diagnostic information is collated in Supplementary Table S1 (FFPE samples) and Supplementary Table S2 (cyst fluid samples). The process of microdissection of an IPMN specimen is illustrated in Supplementary Fig. S1. In summary, we selected 22 FFPE IPMN specimens for unbiased high-throughput miRNA expression profiling (“FFPE tissue study 1” or “FTS1”) and 33 additional archival IPMNs for “tissue” biomarker validation (“FFPE tissue study 2” or “FTS2”). Similarly, we selected 15 cyst fluid specimens for high-throughput miRNA expression profiling (“Cyst fluid study 1” or “CFS1”) and additional 50 cyst fluid samples for “cyst fluid” biomarker validation (“Cyst fluid study 2” or “CFS2”). It should be noted that some specimens were excluded from bioinformatics analyses, based on the insufficient RNA yield to profile all candidates, failure to amplify more than 10% of miRNAs, low recovery of miRNA fraction, and others (for details refer to Supplementary Information, Supplementary Table S1 and S2, and Supplementary Fig. S2).
miRNA expression analyses in FFPE tissue and cyst fluid specimens
High-throughput miRNA expression analyses
Candidate miRNAs that distinguish between high-risk lesions (high-grade IPMNs) and low-risk lesions (low-grade IPMNs, SCAs) were identified with a high-throughput expression platform, using a panel of 10 low-grade IPMN and 12 high-grade IPMN FFPE specimens (FTS 1; Supplementary Table S1, Supplementary Fig. S2), and an independent set of cyst fluid specimens consisting of 4 SCAs, 3 low-grade IPMNs, and 4 high-grade IPMNs (CFS1; Supplementary Table S2, Supplementary Fig. S2). Expression of 750 mature miRNAs (Pool A and B) and 377 mature miRNAs (Pool A) was examined for FTS1 and CFS1, respectively. Briefly, 10 ng of total RNA from each FFPE and cyst fluid specimen was added into the Megaplex RT reaction followed by expression analysis using the TaqMan MicroRNA Arrays (Applied Biosystems), as per the manufacturer’s protocol. Additional details are provided in Supplementary Information.
Singleplex qRT-PCR verification of miRNA candidates
Expression levels of 26 and 37 candidate miRNAs identified in the high-throughput FTS1 and CFS1 studies, respectively, were validated by singleplex quantitative reverse transcriptase PCR (qRT-PCR) in the same FFPE and cyst fluid specimens, provided that sufficient RNA yield was present, or average amplification indicated sufficient miRNA recovery (Supplementary Table S1 and S2, Supplementary Fig. S2). Briefly, 10 ng total RNA was used per reverse transcription reaction (30 minutes, 16°C; 30 minutes, 42°C; 5 minutes, 85°C; hold at 4°C). Positive tissue QC and no-template control (NTC, nuclease-free water) samples were used to control for reagent performance and contamination. PCR was run on the 7900HT instrument as follows: 10 minutes at 95°C; 45 cycles of 15 seconds at 95°C and 30 seconds at 60°C.
Bioinformatics analyses
A novel biomarker discovery approach aiming to identify differentially expressed pairs of miRNAs (“DiffPairs”) was used in this study. A DiffPair was generated via subtraction of raw expression of one miRNA from another to generate a self-normalizing biomarker. Evaluating biomarkers as DiffPairs is convenient, as it can potentially uncover 2 anticorrelated miRNAs that in combination have significant power at separating experimental groups of interest (18).
FFPE tissue study
miRNA candidates from the TaqMan MicroRNA Array platform were selected on the basis of strong Ct estimates (≤30), statistical tests for differential expression [t-test and Wilcox test, false discovery rate (FDR) < 0.05] and prior indication of their role in pancreatic cancer from literature. Expression of these candidates was verified using singleplex qRT-PCR in the original 22 samples (FTS1) and in an additional set of 23 out of 33 FTS2 specimens (for excluded specimens and reasons for exclusion see Supplementary Table S1, Supplementary Fig. S2). Potential batch effects were ruled out before the analysis. miRNAs with average Ct of 35 or greater across all samples were considered to be nonspecifically amplified and therefore were excluded from the final data analysis (22). This resulted in identification of 30 DiffPairs comprising 13 miRNAs (Table 1) for further evaluation in cyst fluid specimens. A more detailed description of this analysis can be found in Supplementary Information.
Table 1.
Thirty DiffPairs composed of 13 miRNAs identified from FTS1 and FTS2 specimens selected for further investigation in cyst fluid specimens
| Biomarker | Mean: LG | SD: LG | Mean: HG | SD: HG | P (t-test) | FDR P (t-test) | FDR P (rank product) |
|---|---|---|---|---|---|---|---|
| Diff(miR-106b, miR-99a) | 2.27 | 0.7 | −0.8 | 2.01 | 0.00042 | 0.035 | 0.0032 |
| Diff(miR-210, miR-99a) | 1.75 | 1.02 | −1.25 | 2 | 0.00062 | 0.035 | 0.0000 |
| Diff(miR-93, miR-99a) | −0,11 | 0.53 | −3.11 | 2.07 | 0.00068 | 0.035 | 0.0020 |
| Diff(miR-17, miR-99a) | 0.95 | 0.65 | −2.04 | 2.13 | 0.00099 | 0.035 | 0.0034 |
| Diff(miR-20b, miR-99a) | 7.19 | 0.54 | 3.78 | 2.53 | 0.00141 | 0.035 | 0.0000 |
| Diff(miR-100, miR-106b) | −2,46 | 0.67 | 0.41 | 2.13 | 0.00150 | 0.035 | 0.0163 |
| Diff(miR-106b, miR-150) | 2.79 | 0.69 | 0.03 | 2.1 | 0.00190 | 0.035 | 0.0058 |
| Diff(miR-100, miR-210) | −1,94 | 1.07 | 0.86 | 2.12 | 0.00217 | 0.035 | 0.0072 |
| Diff(miR-100, miR-93) | −0,08 | 0.61 | 2.72 | 2.18 | 0.00226 | 0.035 | 0.0137 |
| Diff(miR-150, miR-17) | −1,47 | 0.67 | 1.21 | 2.13 | 0.00273 | 0.035 | 0.0202 |
| Diff(miR-150, miR-93) | −0,41 | 0.56 | 2.29 | 2.15 | 0.00275 | 0.035 | 0.0169 |
| Diff(let-7c, miR-106b) | −1,26 | 0.72 | 1.31 | 2.04 | 0.00283 | 0.035 | 0.0402 |
| Diff(miR-20b, miR-342-3p) | 5.17 | 0.33 | 2.6 | 2.09 | 0.00304 | 0.035 | 0.0395 |
| Diff(miR-106b, miR-125b) | 4.72 | 0.77 | 1.92 | 2.25 | 0.00309 | 0.035 | 0.0033 |
| Diff(miR-100, miR-17) | −1.14 | 0.69 | 1.64 | 2.25 | 0.00313 | 0.035 | 0.0168 |
| Diff(miR-150, miR-210) | −2.27 | 0.96 | 0.43 | 2.17 | 0.00339 | 0.035 | 0.0177 |
| Diff(miR-100, miR-20b) | −7.37 | 0.66 | −4.18 | 2.62 | 0.00344 | 0.035 | 0.0000 |
| Diff(miR-660, miR-99a) | 3.03 | 0.84 | 0.28 | 2.25 | 0.00376 | 0.035 | 0.0027 |
| Diff(let-7c, miR-93) | 1.12 | 0.73 | 3.62 | 2.09 | 0.00429 | 0.036 | 0.0276 |
| Diff(miR-125b, miR-210) | −4,2 | 1.1 | −1.47 | 2.26 | 0.00441 | 0.036 | 0.0087 |
| Diff(miR-210, miR-342-3p) | −0.26 | 0.8 | −2.44 | 1.81 | 0.00447 | 0.036 | 0.0497 |
| Diff(let-7c, miR-210) | −0.75 | 1.09 | 1.76 | 2.1 | 0.00496 | 0.036 | 0.0144 |
| Diff(miR-125b, miR-93) | −2.34 | 0.77 | 0.39 | 2.33 | 0.00499 | 0.036 | 0.0175 |
| Diff(miR-125b, miR-17) | −3.4 | 0.72 | −0.68 | 2.39 | 0.00609 | 0.041 | 0.0172 |
| Diff(miR-125b, miR-20b) | −9.64 | 0.78 | −6.5 | 2.76 | 0.00616 | 0.041 | 0.0000 |
| Diff(let-7c, miR-17) | 0.05 | 0.76 | 2.54 | 2.2 | 0.00657 | 0.042 | 0.0440 |
| Diff(let-7c, miR-20b) | −6.18 | 0.83 | −3.28 | 2.58 | 0.00675 | 0.042 | 0.0080 |
| Diff(miR-106b, miR-30a-3p) | −0.68 | 1.25 | −3.15 | 2.26 | 0.00822 | 0.045 | 0.0255 |
| Diff(miR-20b, miR-30a-3p) | 4.24 | 0.71 | 1.44 | 2.61 | 0.00907 | 0.044 | 0.0035 |
| Diff(miR-100, miR-660) | −3.21 | 0.89 | −0.68 | 2.37 | 0.00976 | 0.045 | 0.0131 |
Abbreviations: HG, high-grade; LG, low-grade.
Cyst fluid study
Biomarker candidates for cyst fluid specimens were identified through the manual selection and statistical testing for differential expression of individual miRNAs and DiffPair biomarkers, as described in Supplementary Information using 4 SCA, 3 low-grade IPMN, and 4 high-grade IPMN specimens (for excluded specimens see Supplementary Fig. S2 and Supplementary Table S1). Only miRNAs with P values less than 0.01 and DiffPairs with FDR-adjusted P values less than 0.05 were considered for candidate verification and were combined with the top miRNA candidates identified during the FTS1 and FTS2 studies (Supplementary Fig. S2). Analysis of the resulting 37 miRNAs (Table 2) yielded a shortlist of 18 miRNA candidates (Table 3) that comprised 27 top DiffPairs. Expression of these 18 miRNAs together with miR-21 was analyzed in an independent set of 49 out of 50 CFS2 specimens composed of 20 SCAs, 2 low-grade IPMNs, 11 intermediate-grade IPMNs, 6 high-grade IPMNs, 5 PanNETs, and 5 SPNs. The excluded specimen, CFS1-8, an intermediate-grade IPMN, was removed because of insufficient miRNA recovery (Supplementary Fig. S2). miR-21 was included because previous experiments suggested its potential role in pancreatic carcinogenesis (23). See Supplementary Information for more details.
Table 2.
Origination of the 37 miRNA cyst fluid candidates (CFS1) selected for further singleplex qRT-PCR verification
| miRNA | FFPE | Cyst fluid DiffPair | Cyst fluid individual | Manual selection | Reduced miRNA set |
|---|---|---|---|---|---|
| let-7b | X | ||||
| let-7c | X | X | X | ||
| miR-100 | X | ||||
| miR-106b | X | X | X | ||
| miR-125b | X | ||||
| miR-142-3p | X | X | X | ||
| miR-150 | X | ||||
| miR-15b | X | ||||
| miR-17 | X | ||||
| miR-185 | X | X | |||
| miR-18a | X | ||||
| miR-195 | X | X | |||
| miR-197 | X | ||||
| miR-199a-3p | X | ||||
| miR-20b | X | ||||
| miR-210 | X | ||||
| miR-223 | X | ||||
| miR-24 | X | X | |||
| miR-28 | X (28-5p) | X (28-5p) | |||
| miR-301 | X (301a) | ||||
| miR-30a-3p | X | ||||
| miR-30b | X | ||||
| miR-328 | X | ||||
| miR-331 | X (331-3p) | X (331-3p) | X (331-3p) | ||
| miR-342-3p | X | X | X | ||
| miR-34a | X | X | |||
| miR-455 | X (455-5p) | ||||
| miR-489 | X | ||||
| miR-532-3p | X | ||||
| miR-590-5p | X | ||||
| miR-597 | X | X | X | ||
| miR-642 | X | X | |||
| miR-660 | X | ||||
| miR-92a | X | ||||
| miR-93 | X | X | X | ||
| miR-99a | X | X | |||
| miR-99b | X | X |
Table 3.
Top 27 DiffPairs identified as significant (t-test FDR P value < 0.05) from the CFS1 singleplex qRT-PCR data set
| Biomarker | Mean: LG/SCA | SD: LG/SCA | Mean: HG | SD: HG | P (t-Test) | FDR P |
|---|---|---|---|---|---|---|
| Diff(miR-106b, miR-642) | −3.87 | 0.15 | −6.66 | 0.2 | 1.10E-06 | 0.00058 |
| Diff(miR-24, miR-331) | −2.81 | 0.95 | −5.55 | 0.5 | 6.96E-05 | 0.01837 |
| Diff(let-7b, miR-18a) | −8.98 | 0.57 | −5.61 | 0.66 | 2.64E-04 | 0.03702 |
| Diff(miR-15b, miR-99b) | −0.91 | 1.32 | −5.15 | 0.87 | 2.80E-04 | 0.03702 |
| Diff(miR-92a, miR-93) | −2.02 | 0.42 | −0.69 | 0.03 | 5.76E-04 | 0.03711 |
| Diff(miR-142-3p, miR-99b) | 0.96 | 1.52 | −5.85 | 1.42 | 6.16E-04 | 0.03711 |
| Diff(let-7b, miR-93) | −3.92 | 0.62 | −1.24 | 0.67 | 6.31E-04 | 0.03711 |
| Diff(let-7b, miR-15b) | −5.52 | 0.75 | −2.78 | 0.71 | 6.84E-04 | 0.03711 |
| Diff(miR-106b, miR-331) | −0.65 | 0.9 | −3.85 | 0.84 | 6.85E-04 | 0.03711 |
| Diff(let-7b, miR-106b) | −5.77 | 0.89 | −3.07 | 0.53 | 9.59E-04 | 0.03711 |
| Diff(miR-142-3p, miR-342-3p) | 0.54 | 1.9 | −3.92 | 1.17 | 1.00E-03 | 0.03711 |
| Diff(miR-106b, miR-30a-3p) | −0.79 | 0.4 | −4.71 | 0.86 | 1.06E-03 | 0.03711 |
| Diff(miR-15b, miR-34a) | 1.25 | 1.01 | −1.2 | 0.35 | 1.10E-03 | 0.03711 |
| Diff(miR-34a, miR-93) | 0.75 | 1.18 | 2.74 | 0.48 | 1.23E-03 | 0.03711 |
| Diff(miR-15b, miR-331) | −0.74 | 1.17 | −4.13 | 0.75 | 1.28E-03 | 0.03711 |
| Diff(miR-15b, miR-30a-3p) | −0.75 | 0.66 | −4.99 | 1.09 | 1.31E-03 | 0.03711 |
| Diff(miR-142-3p, miR-30a-3p) | 0.83 | 1.54 | −5.68 | 1.7 | 1.32E-03 | 0.03711 |
| Diff(miR-142-3p, miR-331) | 0.18 | 1.79 | −4.83 | 1.48 | 1.32E-03 | 0.03711 |
| Diff(miR-15b, miR-532-3p) | −1.45 | 0.87 | −3.94 | 0.54 | 1.34E-03 | 0.03711 |
| Diff(miR-99b, miR-93) | 2.51 | 1.25 | 6.69 | 1.26 | 1.60E-03 | 0.04129 |
| Diff(miR-142-3p, miR-328) | −0.33 | 1.46 | −6.42 | 1.68 | 1.66E-03 | 0.04129 |
| Diff(miR-24, miR-99b) | −2.84 | 1.63 | −6.57 | 0.45 | 1.72E-03 | 0.04129 |
| Diff(let-7c, miR-18a) | −3.08 | 0.67 | −0.58 | 0.33 | 1.92E-03 | 0.04303 |
| Diff(miR-18a, miR-532-3p) | 1.4 | 0.45 | −1.12 | 0.73 | 2.02E-03 | 0.04303 |
| Diff(miR-223, miR-99b) | −0.65 | 2.43 | −9.25 | 2.69 | 2.04E-03 | 0.04303 |
| Diff(let-7c, miR-93) | 1.73 | 0.55 | 3.79 | 0.63 | 2.19E-03 | 0.04373 |
| Diff(miR-642, miR-93) | 5.35 | 0.9 | 8.49 | 0.83 | 2.24E-03 | 0.04373 |
Abbreviations: HG, high-grade; LG, low-grade.
Logistic regression model to guide resection
The singleplex qRT-PCR expression data for the 18 cyst fluid miRNAs (Table 3) and miR-21, generated from 9 CFS1 specimens with sufficient RNA and 49 CFS2 specimens, were merged together and then split into training and test sets as described in Supplementary Information and Supplementary Table S2. No samples used in the miRNA candidate generation set (CFS1) were included in the test set for establishing model performance. For the purposes of this study, cystic lesions for which surgery is usually the treatment of choice (high-grade IPMN, cystic PanNET, and SPN) were defined as “high risk,” whereas those potentially managed conservatively (low-grade IPMN, SCA) were defined as “low risk.” The 20 DiffPairs most differentially expressed between low-risk and higher risk specimens in the merged training cyst fluid data set were used as predictors for an L1-penalized logistic model. More information about this model development can be found in Supplementary Information.
Results
The study overview is illustrated in Fig. 1. A detailed experimental design, including the number of specimens included and the reasons for specimen exclusion, is summarized in Supplementary Fig. S2.
Figure 1.
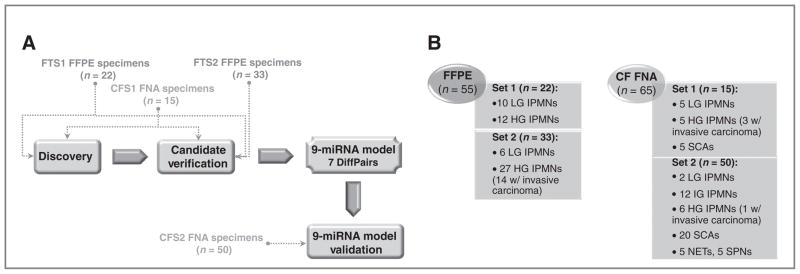
Overview of the study design for miRNA candidate discovery, miRNA model development, and validation (A) using FFPE tissue and cyst fluid FNA specimen sets, described in B. CF, cyst fluid; CFS, cystic fluid study; FTS, FFPE tissue study; HG, high-grade; HT, high-throughput; IG, intermediate-grade; LG, low-grade.
miRNA biomarkers in microdissected FFPE specimens
Because total RNA yield extracted from microdissected FTS1 specimens was as low as 245 ng (Supplementary Table S1), we used multiplex RT and cDNA preamplification to facilitate expression of 750 mature miRNAs and to preserve RNA material for downstream biomarker verification. The bioinformatics data analysis generated 26 differentially expressed miRNA candidates, including miR-100, miR-106b, miR-125b, miR-139-5p, miR-145, miR-150, miR-151-3p, miR-17, miR-196a, miR-200a, miR-200b, miR-20b, miR-210, miR-214, miR-217, miR-26a, miR-28-5p, miR-30a-3p, miR-30e-3p, miR-342-3p, miR-34a, miR-375, miR-660, miR-93, miR-99a, and let-7c (Supplementary Information). Clear separation between low-grade and high-grade IPMN groups was achieved, as shown in Fig. 2A.
Figure 2.

FFPE and cyst fluid specimen separation according to diagnoses. Two principal component analyses of restricted mean center normalized Megaplex qRT-PCR data separating samples according to diagnoses for both FTS1 (A) and CFS1 (B) specimen sets. HG, high-grade; LG, low-grade.
Verification of the differential expression of these candidates was carried out in the original FTS1 set and in an independent set composed of 3 low-grade IPMNs, 9 high-grade IPMNs, and 11 high-grade IPMNs with associated invasive carcinoma (FTS2). The remaining 10 samples from FTS2 were excluded from further analysis based on overall low miRNA signal or an insufficient amount of RNA to interrogate expression of 26 miRNAs (Supplementary Table S1 and Supplementary Fig. S2). miRNA candidate ranking of the combined FTS1 and FTS2 biomarker verification data yielded 30 DiffPairs composed of 13 miRNAs for further investigation (Table 1 and Table 2).
Cyst fluid specimens
RNA yield in pancreatic cyst fluid specimens
Pancreatic cyst fluid specimens with expected lower cellular content, such as SCAs, low-grade and intermediate-grade IPMNs, yielded on average 96 ng (range: 8.7–474 ng), 284 ng (range: 13.7–1,320 ng), and 312 ng cyst fluid (range: 11.6–1,456 ng) per 50 μL cyst fluid, respectively (Supplementary Table S2). Specimens from all remaining diagnostic groups (high-grade IPMNs ± invasive carcinoma, Pan-NETs, and SPNs) yielded RNA in excess of 1,400 ng/50 μL cyst fluid (range: 52.3–23,666 ng). We observed that cyst fluid specimens that were “cloudy” in appearance generated more RNA than those that appeared “watery” (SCAs). Agilent Bioanalyzer analysis of cyst fluid RNA showed no distinct 18S and 28S peaks and an average RNA fragment size of more than 100 nucleotides. The adequacy of the cyst fluid specimens for miRNA expression profiling was established using miR-103, miR-191, and miR-24, which are indicative of the overall miRNA recovery in “compromised” biospecimens (16, 24, 25).
miRNA biomarkers in cyst fluid specimens
High-throughput expression profiling of 377 human miRNAs was successfully completed in cyst fluid specimens collected from 3 patients with histologically confirmed low-grade IPMNs, 4 patients with high-grade IPMNs (±invasive carcinoma), and 4 patients with SCAs (CST1; Supplementary Table S2). SCAs were included because they represent cystic lesions that are essentially benign but are sometimes misdiagnosed as IPMNs (and vice versa; refs. 3, 26). Clear separation between experimental groups was observed as shown in Fig. 2B. Similarly to FFPE specimens, the aim of the bioinformatics analysis here was to identify lesions that would be recommended for surgical resection (high-grade IPMN) versus those likely to favor conservative management (low-grade IPMNs and SCAs). Because only 5 DiffPairs showed P values less than 0.05 (Supplementary Table S3), we selected 5 additional DiffPairs with FDR P values ranging from 0.05 to 0.06 on the basis of unadjusted P value ranking. Of note, an association between diagnoses and raw Ct values was observed, in which low-grade IPMNs showed overall higher mean Ct values across all miRNAs (lower expression) as compared with high-grade IPMNs (lower mean Ct value, higher expression; Supplementary Fig. S3 and S4). This may be a result of a higher proliferation with a higher cell turnover in those more dysplastic lesions.
The bioinformatics analysis of combined FTS(1+2) and CFS1 qRT-PCR data rendered 37 top differentially expressed miRNAs derived from the top 10 cyst fluid DiffPairs (17 miRNAs in Supplementary Table S3) combined with the top 10 individual miRNAs (Supplementary Table S4), the top 13 FFPE tissue miRNAs from the 30 DiffPairs (Table 1, Supplementary Table S3), and with 6 miRNAs selected based on their high expression levels and their performance as individual candidates and in DiffPairs (let-7b, miR-223, miR-30b, miR-328, miR-532-3p, and miR-590-5p). Four miRNAs (let-7c, miR-106b, miR-342-3p, and miR-93) were shared between the FTS and the CFS analyses (Table 2 and Supplementary Information). Verification of all those candidates was carried out in 9 CFS1 specimens with sufficient RNA (Supplementary Table S2), whereas a reduced set of 13 miRNAs (Table 2) was investigated in the remaining 2 specimens. Twenty-seven significantly differentially expressed DiffPairs composed of 18 miRNAs were selected for validation in an independent set of 38 cyst fluid specimens, which excluded intermediate-grade IPMNs (Fig. 1, Table 3, and Supplementary Table S2). One additional candidate, miR-21, was included based on its reported overexpression and strong association with poor patient outcome in many human neoplasms (12, 13, 27–29), including pancreatic cancer (30) and IPMNs (16, 23). We observed that the CFS2 specimen data for SCAs exhibited larger variance in the mean Ct values as compared with the CFS1 (Supplementary Fig. S4). One result of this increased variation was a decreased ability to separate high-grade IPMNs from the low-grade IPMNs/ SCAs grouping on the basis of mean Ct alone.
A miRNA-based model that predicts resection status
Combination of the singleplex qRT-PCR data for the CFS1 and CFS2 specimens provided an opportunity to construct a miRNA-based classifier to identify high-risk lesions, which under the current patient management would be recommended to undergo resection. For simplicity, we used a classifier based on penalized logistic regression with Diff-Pairs as predictors (31) and grouped cyst fluid specimens into “low-risk” (SCAs, low-grade IPMNs) and “high-risk” (high-grade IPMNs, SPNs, and NETs). In order for all diagnostic groups to be represented in the training set, 9 CFS1 specimens were combined with 12 specimens from the CFS2 set to yield a training set containing 7 SCAs, 3 low-grade IPMNs, 7 high-grade IPMNs, 2 PanNETs, and 2 SPNs, but no intermediate-grade IPMN (Supplementary Table S2). This reassignment of specimens could be implemented because there were no batch effects observed between the 2 sets (Supplementary Fig. S8). On the basis of broader diagnostic coverage of the combined training set, a new set of 20 DiffPairs was selected for validation in the remaining 37 CFS2 specimens (test set), including intermediate-grade IPMNs (Supplementary Table S2). Thirteen of those Diff-Pairs were excluded by the model filtering as they added little in terms of predictive power in differentiating between low- and high-risk lesions (Supplementary Table S5). The expression values (ΔCt) for the remaining 7 DiffPairs are shown in Fig. 3, whereas the raw Ct values associated with miR-24, miR-30a-3p, miR-18a, miR-92a, miR-342-3p, miR-99b, miR-106b, miR-142-3p, and miR-532-3p used by these DiffPairs are plotted in Supplementary Fig. S7. The regression coefficients for each of the 7 DiffPairs, which weight each DiffPair in terms of its relevant contribution toward predicting a high-risk lesion, are shown in Supplementary Table S5.
Figure 3.

miRNA-based model to predict resection. Differential expression (ΔCt) values for DiffPairs were used as predictors by a logistic model derived from singleplex qRT-PCR data using the CFS1 and CFS2 specimens. Diff (miR-X, miR-Y) indicates subtraction of the raw Ct of miR-Y from the raw Ct of miR-X. HG, high-grade; LG, low-grade.
The DiffPairs assigned the highest and lowest weights in the model, namely Diff(miR-24, miR-30a-3p) and Diff (miR-30a-3p, miR-532-3p), separated cystic PanNETs and SPNs particularly well, and to a lesser extent high-grade IPMNs, from low-grade IPMNs and SCAs. The pattern of the third highest weighted DiffPair, Diff(miR-24, miR-342-3p) was somewhat unique, showing differentiation of IPMNs in general from SCAs. The ΔCt expression patterns for Diff(miR-18a, miR-92a), Diff(miR-24, miR-99b), Diff(miR-106b, miR-92a), and Diff(miR-142-3p, miR-92a) indicated a progressively weaker differentiation between “low-risk” and “high-risk” lesions.
Because the model calculates the probability of any given specimen being a “high-risk” lesion, the scores for each sample were 0% to 100% inclusive. When the scores were dichotomized using a threshold of 50% (specimen is “low-risk” lesion if the score is less than 50% and is “high-risk” otherwise), all SCA/low-grade IPMNs and 90% high-grade IPMNs were correctly predicted as “low-risk” and “high-risk,” respectively (Fig. 4A). Notably, in 3 of the 4 IPMNs with eventual low-grade dysplasia (CFS1-1, CFS1-3, and CFS1-5), the cyst size was actually more than 3 cm, thus meeting Sendai high-risk criteria for resection. Although we remain unclear whether size alone was the clinical rationale for removing the said cysts, our model correctly predicted all 3 low-grade IPMNs as “low-risk” based on cyst fluid analysis, irrespective of cyst size. Conversely, 2 of the IPMNs with eventual high-grade dysplasia (CFS2-17 and CFS2-20) were only 1 cm in greatest diameter but were accurately classified as “high-risk” by the 9-miRNA model.
Figure 4.

Logistic regression model performance. A, classification of specimens from the CFS1 and CFS2 reassigned to training and test sets, respectively (line indicates 50% threshold). “Low-risk” group includes SCA and low-grade IPMN specimens; “high-risk” group includes high-grade IPMNs, PanNETs, and SPNs. B, prediction probability for surgical resection as a function of median singleplex miRNA Ct of CFS2 specimens. SRC indicates Spearman rank correlation. HG, high-grade; LG, low-grade.
All SCAs in both the training and the test sets were predicted as “low-risk,” whereas all SPN and cystic PanNET samples (typically recommended for surgical resection) were predicted to be “high-risk.” Within the cohort of intermediate-grade IPMNs, 45.5% specimens (n = 5) were predicted as “low-risk,” whereas the remaining 54.5% (6 specimens) were predicted as “high-risk”; unfortunately, in the absence of prospective follow up, the natural history of such lesions remains unclear. Considering the results from the test set (excluding intermediate-grade IPMNs, for which we did not have independent assessment risk), the sensitivity of this 9-miRNA model was estimated at 89% (95% Wilson interval, 57%–98%) and the specificity at 100% (95% Wilson interval, 82%–100%) with an area under the curve of 1. From the extent of correlation between the prediction model and median Ct (measured by Spearman rank correlation; Fig. 4B), it is apparent that although median Ct alone has some predictive power, the regression model is capable of stratifying indications far more accurately. Of note, miR-21 was not included in our model. In contrast to recent reports (25), in this study miR-21 was not among the strongest predictors of a specimen being at low- or high-risk for therapeutic stratification.
Discussion
Previous studies have shown that pancreatic carcinogenesis is a multistep process involving well-defined precursor lesions (1, 32). Recent evidence suggests that the time frame from the onset of first genetic hit within pancreatic ducts until the development of metastatic disease spans about 2 decades, suggesting that clinicians have a reasonable diagnostic window for early detection strategies to help ameliorate the outcome of this deadly disease (33). Modern imaging is a central component in diagnosing PDAC. However, the microscopic precursor lesions that a majority of PDACs are believed to arise from are usually undetectable on EUS, MR, or CT, hampering early detection. On the contrary, IPMNs are cystic precursor lesions of PDAC and can be readily identified by abdominal imaging (34). IPMNs account for the most frequently diagnosed detectable cystic precursor lesion of PDAC and are currently the second most common indication for primary pancreatic surgery at The Johns Hopkins Hospital after PDAC. In fact, cystic lesions of the pancreas, in general, are being increasingly diagnosed. Recent imaging studies report prevalence rates of pancreatic cysts in asymptomatic individuals from about 2.6% on CT scans (35) up to 13.5% on MRI (36). Autopsy studies even suggest that up to one-fourth of the general population might harbor undiagnosed cystic lesions in their pancreata (37).
Despite the advances in modern imaging techniques, an incidentally diagnosed pancreatic cyst is often a clinical challenge for both the patient and the treating physicians. The prevailing diagnostic uncertainty has resulted in accurate preoperative diagnoses in only up to two-thirds of asymptomatic pancreatic cysts that have been subsequently resected (26), with the resulting potential for both over- and undertreatment in any given individual.
The primary objective of this study was to identify miRNA biomarker candidates that allow a prediction of dysplasia (high-grade vs. low-grade) in IPMNs. IPMNs with underlying high-grade dysplasia require surgical resection in light of the associated risk for synchronous or metachronous invasive neoplasia, whereas those harboring low-grade dysplasia can be followed conservatively. A secondary objective of this study was to determine whether additional cystic entities of the pancreas that can be followed with watchful waiting (e.g., SCAs) and can be differentiated from entities such as cystic PanNETs or SPNs that mandate surgery, using miRNA biomarkers.
Aberrant miRNA expression data established with well annotated, microdissected FFPE tissue specimens, which underwent a thorough histopathologic review represented “proof-of-concept” for use of miRNAs as biomarkers for pancreatic cystic lesions. With a high-throughput expression profiling approach, we were able to interrogate expression levels of 750 miRNAs, even in specimens with limiting RNA yield and preserve enough material in majority of the samples to carry out a verification step. Although target preamplification bias is a concern when using high-throughput expression platforms, data generated at Asuragen (unpublished) and from other research groups (38, 39) show that preamplification of miRNA-containing cDNA improves sensitivity of miRNA detection, while maintaining the relative expression levels. To our knowledge, this study is the first comprehensive demonstration of miRNAs aberrantly expressed in tissue specimens collected from patients with cystic lesions who have high-risk versus low-risk of malignancy.
Although we initially hypothesized that malignant epithelial cells shed from the cyst wall to the internal fluid will be detected in the cystic fluid, a majority of miRNA candidates identified through the FTS and CFS were nonoverlapping. This result may appear as a surprise, considering that millions of cells reported to be shed daily from a tumor into circulation (40). One of the reasons for this lack of correlation may be that in contrast to strong aberrant expression signal observed in carefully microdissected neoplastic epithelium, the signal from malignant cells in the aspirated cyst fluid is likely to be weakened by contaminating nonneoplastic epithelium, endothelial cells, and others and therefore more difficult to detect. Our results also underscore the importance of directly profiling the most proximate biologic sample to be used for biomarker analyses (in this case, aspirated cyst fluid), rather than extrapolating candidates from tissue profiling experiments alone, as prior studies have done.
Logistic regression analysis led to the final identification of a 9-miRNA model, which allowed separation of all but one high-grade IPMNs from low-grade IPMNs/SCAs with 89% Se and 100% Sp. We re-reviewed the histology of the misclassified IPMN case and did not find any histologic features to the contrary. As we have recently shown (3), independent locules within the same IPMN might harbor distinct genetic alterations, and it is possible that the cyst fluid was aspirated from a locule lined by lower grade dysplastic epithelium. As for the intermediate-grade specimens, they were separated by the model into those exhibiting high- and low-risk of malignant transformation (Fig. 4A). Future prospective studies should clarify whether this separation of intermediate-grade IPMNs according to our miRNA panel reflects true differences in natural history within this IPMN subcategory or results from the inherent imprecision associated with grading epithelial dysplasia. Our miRNA signature also distinguished low-grade IPMNs/SCAs from uncommon cysts such as SPNs and cystic PanNETs. PanNETs are a highly heterogeneous group of tumors with diverse biologic behavior and occasional cystic appearance, for which a clear staging system has been historically challenging. Although they generally have a better prognosis than PDAC, even localized PanNETs will, over time, metastasize and thus, their surgical resection at diagnosis is warranted (41, 42). Solid pseudopapillary neoplasms (SPN) are lesions that present with an admixture of solid and cystic features and predominantly arise in younger women (43, 44). Although not an overt malignancy, the diagnosis of an SPN is generally regarded as an indication for resection as well. As both PanNETs and SPNs imply resection, it is beneficial that the miRNA candidates selected via logistic regression herein allow clustering of those lesions with high-grade IPMNs.
The most important miRNAs in the regression model included miR-24, miR-30a-3p, miR-18a, miR-92a, and miR-342-3p. Of these, miR-92a and miR-18a were previously reported to be involved in pancreatic cancer (18, 45). In agreement with previous reports (20, 23, 46), in our study miR-21 was upregulated in low-grade/intermediate-grade/high-grade IPMNs, SPNs, and PanNETs as compared with SCAs. However, it did not seem to predict the risk level of malignant transformation and therefore, is likely to be less useful for this purpose.
With respect to therapeutic stratification, logistic regression correctly predicted indication for surgery in so-called higher risk lesions, as defined by current recommendations for surgery (high-grade IPMNs, PanNETs, and SPNs) versus those in which conservative management is considered appropriate (low-grade IPMNs, SCAs). Despite our promising findings, we recognize that our study has limitations. First, the model parameters, including the malignancy threshold, needs to be further evaluated in a large prospective study. In addition, here we examined differential miRNA expression using resected specimens only, which included lesions that would not have been surgically removed if diagnosed accurately (BD-IPMNs and SCAs). The resection of those lesions was likely mandated by either cyst size (>3 cm) or worrisome features on imaging. Furthermore, there are additional rare cystic lesions (e.g., MCNs, lymphangiomas) in which the expression of our miRNA candidates needs to be interrogated to determine their diagnostic/predictive potential. And finally, although SPNs and NETs are important diagnostic entities to differentiate from SCAs and low-grade/high-grade IPMNs, the numbers of specimens used in this study were rather low.
In conclusion, we identified a 9-miRNA model that may aid in diagnosis and surgical treatment decisions for patients with pancreatic cystic lesions, such as high-grade IPMNs, cystic PanNETs, and SPNs. We recommend that this signature is prospectively validated in larger series of consecutively collected cysts that have not been resected, with clinical follow-up or subsequent surgical findings serving as the gold standard. The validation study must follow CLIA and CAP regulations to ensure that this signature can be introduced into clinical use as an LDT. We also recommend that reference cystic fluid analyte, such as carcinoembryonic antigen, and the emerging genetic markers, such as GNAS mutation status (3) are incorporated into the study design. In addition, aspiration of multiple IPMN locules in patients with multifocal IPMNs should be considered, to reduce the probability of specimen bias and false negative results. A study that follows the abovementioned recommendations should allow establishing whether this 9-miRNA signature can be applied clinically toward stratification of patients with pancreatic cysts for surgical intervention or watchful waiting.
Supplementary Material
Translational Relevance.
There has been a dramatic increase in the diagnosis of pancreatic cystic lesions because of the enhanced usage of abdominal imaging. Although the majority of such lesions have minimal potential for malignant progression, others such as intraductal papillary mucinous neoplasm (IPMN) represent bona fide precursor lesions of invasive adenocarcinoma. Current imaging and biochemical assessments cannot always reliably separate IPMNs harboring high-grade dysplasia or cancer and thus warranting surgery from those that can be observed conservatively because of the presence of low-grade dysplasia. In this study, we have identified a 9-miRNA signature in pancreatic cyst fluid specimens that distinguishes high-grade from low-grade IPMNs with a remarkable degree of accuracy. In addition, this signature can also reliably identify other pancreatic cystic entities that require surgical management. The prospective validation of this unique signature should provide a valuable adjunct for appropriate stratification and management of patients with pancreatic cysts.
Acknowledgments
The authors thank Sarah Adai for her assistance in the preparation of the manuscript.
Grant Support
This study was supported by grants from the NIH (R01CA113669, P01CA134292, and P50CA062924), The Sol Goldman Pancreatic Cancer Research Center, and The Michael Rolfe Foundation for Pancreatic Cancer Research. H. Matthaei was supported by a fellowship grant by German Cancer Aid (Deutsche Krebshilfe e.V.).
Footnotes
Note: Supplementary data for this article are available at Clinical Cancer Research Online (http://clincancerres.aacrjournals.org/).
Disclosure of Potential Conflicts of Interest
A. Maitra, H. Matthaei, and R.H. Hruban have jointly filed for intellectual property rights with Asuragen, Inc., related to the 9-miRNA signature identified in this study. A. Maitra serves as a consultant for Asuragen, Inc., and the terms of this agreement have been declared to the Johns Hopkins Office of Policy Coordination. No potential conflicts of interest were disclosed by the other authors.
Authors’ Contributions
Conception and design: H. Matthaei, D. Wylie, B.F. Andruss, A.E. Szafranska-Schwarzbach, A. Maitra
Development of methodology: H. Matthaei, J. Kemppainen, B.F. Andruss, A.E. Szafranska-Schwarzbach, A. Maitra
Acquisition of data (provided animals, acquired and managed patients, provided facilities, etc.): H. Matthaei, M.B. Lloyd, M.D. Molin, J. Kemppainen, R.D. Schulick, L. Langfield, R.H. Hruban, A.E. Szafranska-Schwarzbach, A. Maitra
Analysis and interpretation of data (e.g., statistical analysis, biostatistics, computational analysis): H. Matthaei, D. Wylie, S.C. Mayo, C.L. Wolfgang, B.F. Andruss, A.T. Adai, A.E. Szafranska-Schwarzbach, A. Maitra
Writing, review, and/or revision of the manuscript: H. Matthaei, D. Wylie, M.B. Lloyd, J. Kemppainen, S.C. Mayo, C.L. Wolfgang, R.D. Schulick, B.F. Andruss, A.T. Adai, R.H. Hruban, A.E. Szafranska-Schwarzbach, A. Maitra
Administrative, technical, or material support (i.e., reporting or organizing data, constructing databases): H. Matthaei, M.B. Lloyd, M.D. Molin, R.D. Schulick, B.F. Andruss, A.E. Szafranska-Schwarzbach
Study supervision: H. Matthaei, R.D. Schulick, B.F. Andruss, A.T. Adai, A.E. Szafranska-Schwarzbach
References
- 1.Matthaei H, Maitra A. Precursor lesions of pancreatic cancer. In: Fitzgerald RC, editor. Pre-invasive disease: pathogenesis and clinical management. New York: Springer; 2011. pp. 395–420. [Google Scholar]
- 2.Tanaka M, Chari S, Adsay V, Fernandez-del Castillo C, Falconi M, Shimizu M, et al. International consensus guidelines for management of intraductal papillary mucinous neoplasms and mucinous cystic neoplasms of the pancreas. Pancreatology. 2006;6:17–32. doi: 10.1159/000090023. [DOI] [PubMed] [Google Scholar]
- 3.Wu J, Matthaei H, Maitra A, Dal Molin M, Wood LD, Eshleman JR, et al. Recurrent GNAS mutations define an unexpected pathway for pancreatic cyst development. Sci Transl Med. 2011;3:92ra66. doi: 10.1126/scitranslmed.3002543. [DOI] [PMC free article] [PubMed] [Google Scholar]
- 4.Lee RC, Feinbaum RL, Ambros V. The C. elegans heterochronic gene lin-4 encodes small RNAs with antisense complementarity to lin-14. Cell. 1993;75:843–54. doi: 10.1016/0092-8674(93)90529-y. [DOI] [PubMed] [Google Scholar]
- 5.Calin GA, Croce CM. MicroRNA-cancer connection: the beginning of a new tale. Cancer Res. 2006;66:7390–4. doi: 10.1158/0008-5472.CAN-06-0800. [DOI] [PubMed] [Google Scholar]
- 6.Lee YS, Dutta A. The tumor suppressor microRNA let-7 represses the HMGA2 oncogene. Genes Dev. 2007;21:1025–30. doi: 10.1101/gad.1540407. [DOI] [PMC free article] [PubMed] [Google Scholar]
- 7.He L, Thomson JM, Hemann MT, Hernando-Monge E, Mu D, Goodson S, et al. A microRNA polycistron as a potential human oncogene. Nature. 2005;435:828–33. doi: 10.1038/nature03552. [DOI] [PMC free article] [PubMed] [Google Scholar]
- 8.Voorhoeve PM, le Sage C, Schrier M, Gillis AJ, Stoop H, Nagel R, et al. A genetic screen implicates miRNA-372 and miRNA-373 as oncogenes in testicular germ cell tumors. Cell. 2006;124:1169–81. doi: 10.1016/j.cell.2006.02.037. [DOI] [PubMed] [Google Scholar]
- 9.Dillhoff M, Wojcik SE, Bloomston M. MicroRNAs in solid tumors. J Surg Res. 2009;154:349–54. doi: 10.1016/j.jss.2008.02.046. [DOI] [PMC free article] [PubMed] [Google Scholar]
- 10.Costinean S, Zanesi N, Pekarsky Y, Tili E, Volinia S, Heerema N, et al. Pre-B cell proliferation and lymphoblastic leukemia/high-grade lymphoma in E{micro}-miR155 transgenic mice. Proc Natl Acad Sci U S A. 2006;103:7024–9. doi: 10.1073/pnas.0602266103. [DOI] [PMC free article] [PubMed] [Google Scholar]
- 11.Yanaihara N, Caplen N, Bowman E, Seike M, Kumamoto K, Yi M, et al. Unique microRNA molecular profiles in lung cancer diagnosis and prognosis. Cancer Cell. 2006;9:189–98. doi: 10.1016/j.ccr.2006.01.025. [DOI] [PubMed] [Google Scholar]
- 12.Iorio MV, Ferracin M, Liu C-G, Veronese A, Spizzo R, Sabbioni S, et al. MicroRNA gene expression deregulation in human breast cancer. Cancer Res. 2005;65:7065–70. doi: 10.1158/0008-5472.CAN-05-1783. [DOI] [PubMed] [Google Scholar]
- 13.Chan SH, Wu CW, Li AF, Chi CW, Lin WC. miR-21 microRNA expression in human gastric carcinomas and its clinical association. Anti-cancer Res. 2008;28:907–11. [PubMed] [Google Scholar]
- 14.Ozen M, Creighton CJ, Ozdemir M, Ittmann M. Widespread deregulation of microRNA expression in human prostate cancer. Oncogene. 2008;27:1788–93. doi: 10.1038/sj.onc.1210809. [DOI] [PubMed] [Google Scholar]
- 15.Lanza G, Ferracin M, Gafa R, Veronese A, Spizzo R, Pichiorri F, et al. mRNA/microRNA gene expression profile in microsatellite unstable colorectal cancer. Mol Cancer. 2007;6:54. doi: 10.1186/1476-4598-6-54. [DOI] [PMC free article] [PubMed] [Google Scholar]
- 16.Habbe N, Koorstra JB, Mendell JT, Offerhaus GJ, Ryu JK, Feldmann G, et al. MicroRNA miR-155 is a biomarker of early pancreatic neoplasia. Cancer Biol Ther. 2009;8:340–6. doi: 10.4161/cbt.8.4.7338. [DOI] [PMC free article] [PubMed] [Google Scholar]
- 17.Ryu JK, Hong SM, Karikari CA, Hruban RH, Goggins MG, Maitra A. Aberrant microRNA-155 expression is an early event in the multistep progression of pancreatic adenocarcinoma. Pancreatology. 2010;10:66–73. doi: 10.1159/000231984. [DOI] [PMC free article] [PubMed] [Google Scholar]
- 18.Szafranska AE, Davison TS, John J, Cannon T, Sipos B, Maghnouj A, et al. MicroRNA expression alterations are linked to tumorigenesis and non-neoplastic processes in pancreatic ductal adenocarcinoma. Oncogene. 2007;26:4442–52. doi: 10.1038/sj.onc.1210228. [DOI] [PubMed] [Google Scholar]
- 19.Szafranska AE, Doleshal M, Edmunds HS, Gordon S, Luttges J, Munding JB, et al. Analysis of microRNAs in pancreatic fine-needle aspirates can classify benign and malignant tissues. Clin Chem. 2008;54:1716–24. doi: 10.1373/clinchem.2008.109603. [DOI] [PMC free article] [PubMed] [Google Scholar]
- 20.Ryu JK, Matthaei H, Dal Molin M, Hong SM, Canto MI, Schulick RD, et al. Elevated microRNA miR-21 levels in pancreatic cyst fluid are predictive of mucinous precursor lesions of ductal adenocarcinoma. Pancreatology. 2011;11:343–50. doi: 10.1159/000329183. [DOI] [PMC free article] [PubMed] [Google Scholar]
- 21.Taylor DD, Gercel-Taylor C. MicroRNA signatures of tumor-derived exosomes as diagnostic biomarkers of ovarian cancer. Gynecol Oncol. 2008;110:13–21. doi: 10.1016/j.ygyno.2008.04.033. [DOI] [PubMed] [Google Scholar]
- 22.Schmittgen TD, Lee EJ, Jiang J, Sarkar A, Yang L, Elton TS, et al. Real-time PCR quantification of precursor and mature microRNA. Methods. 2008;44:31–8. doi: 10.1016/j.ymeth.2007.09.006. [DOI] [PMC free article] [PubMed] [Google Scholar]
- 23.Dillhoff M, Liu J, Frankel W, Croce C, Bloomston M. MicroRNA-21 is overexpressed in pancreatic cancer and a potential predictor of survival. J Gastrointest Surg. 2008;12:2171–6. doi: 10.1007/s11605-008-0584-x. [DOI] [PMC free article] [PubMed] [Google Scholar]
- 24.Doleshal M, Magotra AA, Choudhury B, Cannon BD, Labourier E, Szafranska AE. Evaluation and validation of total RNA extraction methods for microRNA expression analyses in formalin-fixed, paraffin-embedded tissues. J Mol Diagn. 2008;10:203–11. doi: 10.2353/jmoldx.2008.070153. [DOI] [PMC free article] [PubMed] [Google Scholar]
- 25.Szafranska AE, Davison TS, Shingara J, Doleshal M, Riggenbach JA, Morrison CD, et al. Accurate molecular characterization of formalin-fixed, paraffin-embedded tissues by microRNA expression profiling. J Mol Diagn. 2008;10:415–23. doi: 10.2353/jmoldx.2008.080018. [DOI] [PMC free article] [PubMed] [Google Scholar]
- 26.Correa-Gallego C, Ferrone CR, Thayer SP, Wargo JA, Warshaw AL, Fernandez-Del Castillo C. Incidental pancreatic cysts: do we really know what we are watching? Pancreatology. 2010;10:144–50. doi: 10.1159/000243733. [DOI] [PMC free article] [PubMed] [Google Scholar]
- 27.Volinia S, Calin GA, Liu CG, Ambs S, Cimmino A, Petrocca F, et al. A microRNA expression signature of human solid tumors defines cancer gene targets. Proc Natl Acad Sci U S A. 2006;103:2257–61. doi: 10.1073/pnas.0510565103. [DOI] [PMC free article] [PubMed] [Google Scholar]
- 28.Hu Y, Correa AM, Hoque A, Guan B, Ye F, Huang J, et al. Prognostic significance of differentially expressed miRNAs in esophageal cancer. Int J Cancer. 2011;128:132–43. doi: 10.1002/ijc.25330. [DOI] [PMC free article] [PubMed] [Google Scholar]
- 29.Tetzlaff MT, Liu A, Xu X, Master SR, Baldwin DA, Tobias JW, et al. Differential expression of miRNAs in papillary thyroid carcinoma compared to multinodular goiter using formalin fixed paraffin embedded tissues. Endocr Pathol. 2007;18:163–73. doi: 10.1007/s12022-007-0023-7. [DOI] [PubMed] [Google Scholar]
- 30.Giovannetti E, Funel N, Peters GJ, Del Chiaro M, Erozenci LA, Vasile E, et al. MicroRNA-21 in pancreatic cancer: correlation with clinical outcome and pharmacologic aspects underlying its role in the modulation of gemcitabine activity. Cancer Res. 2010;70:4528–38. doi: 10.1158/0008-5472.CAN-09-4467. [DOI] [PubMed] [Google Scholar]
- 31.Goeman JJ. L1 penalized estimation in the Cox proportional hazards model. Biom J. 2010;52:70–84. doi: 10.1002/bimj.200900028. [DOI] [PubMed] [Google Scholar]
- 32.Fernandez-del Castillo C, Adsay NV. Intraductal papillary mucinous neoplasms of the pancreas. Gastroenterology. 2010;139:708–13. 713 e701–702. doi: 10.1053/j.gastro.2010.07.025. [DOI] [PubMed] [Google Scholar]
- 33.Yachida S, Jones S, Bozic I, Antal T, Leary R, Fu B, et al. Distant metastasis occurs late during the genetic evolution of pancreatic cancer. Nature. 2010;467:1114–7. doi: 10.1038/nature09515. [DOI] [PMC free article] [PubMed] [Google Scholar]
- 34.Adsay NV. Cystic neoplasia of the pancreas: pathology and biology. J Gastrointest Surg. 2008;12:401–4. doi: 10.1007/s11605-007-0348-z. [DOI] [PubMed] [Google Scholar]
- 35.Laffan TA, Horton KM, Klein AP, Berlanstein B, Siegelman SS, Kawamoto S, et al. Prevalence of unsuspected pancreatic cysts on MDCT. AJR Am J Roentgenol. 2008;191:802–7. doi: 10.2214/AJR.07.3340. [DOI] [PMC free article] [PubMed] [Google Scholar]
- 36.Lee JM, Cho H, Jung Y. Fabrication of a structure-specific RNA binder for array detection of label-free microRNA. Angew Chem Int Ed Engl. 2010;49:8662–5. doi: 10.1002/anie.201004000. [DOI] [PubMed] [Google Scholar]
- 37.Kimura W, Nagai H, Kuroda A, Muto T, Esaki Y. Analysis of small cystic lesions of the pancreas. Int J Pancreatol. 1995;18:197–206. doi: 10.1007/BF02784942. [DOI] [PubMed] [Google Scholar]
- 38.Mestdagh P, Feys T, Bernard N, Guenther S, Chen C, Speleman F, et al. High-throughput stem-loop RT-qPCR miRNA expression profiling using minute amounts of input RNA. Nucleic Acids Res. 2008;36:e143. doi: 10.1093/nar/gkn725. [DOI] [PMC free article] [PubMed] [Google Scholar]
- 39.Chen Y, Gelfond JA, McManus LM, Shireman PK. Reproducibility of quantitative RT-PCR array in miRNA expression profiling and comparison with microarray analysis. BMC Genomics. 2009;10:407. doi: 10.1186/1471-2164-10-407. [DOI] [PMC free article] [PubMed] [Google Scholar]
- 40.Butler TP, Gullino PM. Quantitation of cell shedding into efferent blood of mammary adenocarcinoma. Cancer Res. 1975;35:512–6. [PubMed] [Google Scholar]
- 41.Bilimoria KY, Talamonti MS, Tomlinson JS, Stewart AK, Winchester DP, Ko CY, et al. Prognostic score predicting survival after resection of pancreatic neuroendocrine tumors: analysis of 3851 patients. Ann Surg. 2008;247:490–500. doi: 10.1097/SLA.0b013e31815b9cae. [DOI] [PubMed] [Google Scholar]
- 42.Martin RC, Kooby DA, Weber SM, Merchant NB, Parikh AA, Cho CS, et al. Analysis of 6,747 pancreatic neuroendocrine tumors for a proposed staging system. J Gastrointest Surg. 2011;15:175–83. doi: 10.1007/s11605-010-1380-y. [DOI] [PubMed] [Google Scholar]
- 43.Reddy S, Cameron JL, Scudiere J, Hruban RH, Fishman EK, Ahuja N, et al. Surgical management of solid-pseudopapillary neoplasms of the pancreas (Franz or Hamoudi tumors): a large single-institutional series. J Am Coll Surg. 2009;208:950–7. doi: 10.1016/j.jamcollsurg.2009.01.044. discussion 957–959. [DOI] [PMC free article] [PubMed] [Google Scholar]
- 44.Kawamoto S, Scudiere J, Hruban RH, Wolfgang CL, Cameron JL, Fishman EK. Solid-pseudopapillary neoplasm of the pancreas: spectrum of findings on multidetector CT. Clin Imaging. 2011;35:21–28. doi: 10.1016/j.clinimag.2009.11.007. [DOI] [PubMed] [Google Scholar]
- 45.Lee EJ, Gusev Y, Jiang J, Nuovo GJ, Lerner MR, Frankel WL, et al. Expression profiling identifies microRNA signature in pancreatic cancer. Int J Cancer. 2007;120:1046–54. doi: 10.1002/ijc.22394. [DOI] [PMC free article] [PubMed] [Google Scholar]
- 46.LaConti JJ, Shivapurkar N, Preet A, Deslattes Mays A, Peran I, Kim SE, et al. Tissue and serum microRNAs in the Kras(G12D) transgenic animal model and in patients with pancreatic cancer. PLoS One. 2011;6:e20687. doi: 10.1371/journal.pone.0020687. [DOI] [PMC free article] [PubMed] [Google Scholar]
Associated Data
This section collects any data citations, data availability statements, or supplementary materials included in this article.