

Abstract
In this paper, we report a novel normal mode analysis for supramolecular complexes, named as fSUB. The method models a complex as a group of flexible substructures. The low-frequency substructure modes are first determined with substructures in isolation, and the motions of the whole complex are then calculated based on substructure modes and substructure-substructure interactions. The calculation of modes in fSUB requires modal analysis without initial energy minimization, which is essential for maintaining energetic and structural consistency between substructures and whole complex. Comparing with other coarse-grained methods, such as RTB method, fSUB delivers much more accurate modes for the complex and allows for choice of much larger substructures. The method can also accommodate any type of substructure arrangement including covalent bonds across the interface. In tests on molecular chaperonin GroEL (7350 residues) and HK97 capsid complex (118,092 residues), fSUB was shown to be much more efficient in terms of combined accuracy and demand of computing resource. Our results clearly demonstrated the vital importance of including substructure flexibility in complex modal analysis, as the deformational patterns of substructures were found to play an important role even in the lowest frequency modes of the whole complex.
Keywords: Normal Mode Analysis, Substructure Mode, Conformational Flexibility, Supramolecular Complex
Introduction
One of the biggest challenges in normal mode analysis (NMA) of biomolecules is to efficiently calculate low frequency modes for very large complexes 1–3. In the last two decades, many methods have been developed to reduce computational cost. For example, a series of elastic network models (ENMs) were developed to reduce degrees of freedom in mode calculation by coarse-graining a structure into a bunch of nodes and by using a simplified elastic potential 4–11. Another popular approach, rotations translations of blocks (RTB)12 models a group of residues as a rigid-body block. However, when structure becomes extremely large, higher level of coarse-graining are required even for ENM and RTB methods in order to perform calculations on current computer resources. For example, in ENM, fewer nodes may be chosen to represent the structure; while in RTB, larger blocks have to be used. The increased level of coarse-graining often leads to larger errors in the low-frequency modes of the complex.
In this study, we introduce a novel NMA, named fSUB (flexible substructures). In this method, a molecular complex is divided into a group of substructures, each of which is modeled as a flexible object. The normal modes for the whole complex are constructed based on the substructure modes (calculated with substructures in isolation) and substructure-substructure interactions. Unlike in RTB, the substructures in fSUB are not rigid bodies but flexible entities, i.e. the degrees of freedom used in each substructure include not only translational and rotational rigid-body motions, but also low frequency deformations. The substructure modes can be calculated by any NMA, as long as the method delivers the six zero-frequency modes and does not require initial energy minimization 10, 13–14. We found that it is vitally important to use modal analysis without initial energy minimization. This is for maintaining energetic and structure consistency between substructures and the whole complex. Because of the explicit inclusion of substructure flexibility in calculation, fSUB allows for much larger size of substructure without sacrificing the accuracy of the modes for the whole complex. This was clearly shown in the current study by comparing the fSUB modes with those from much more fine-grained calculations.
This fSUB method is also a hierarchical normal mode approach, since mode calculation on the whole structure requires low frequency modes of substructures. If necessary, fSUB can also be applied to the mode calculation within a substructure, therefore the method supports multiple hierarchies.
In this study, we employed our recently developed modal analysis based on molecular geometry restraints (MGR) 14 to calculate the Hessian matrix for both substructures and whole complex. Unlike the conventional ENM, MGR calculates normal modes by including information of molecular geometry, and thus can produce better low frequency modes. It is also a method that does not require initial energy minimization, thus modes on any desired substructure can be calculated.
We previously developed another hierarchical normal mode approach, called substructure synthesis method (SSM) 15–16. Both SSM and fSUB require low frequency modes of substructures for mode calculations of the whole complex. However, in SSM, the modes of the whole complex are synthesized from the modes of substructures based on boundary condition of the interface between two substructures, e.g., by imposing the geometry compatibility. Therefore, the applicability of SSM is often restricted to the shape of interface. For example, SSM works well on linearly arranged structures, such as Actin filaments 16. On the other hand, fSUB has no restriction on the spatial arrangement of substructures or the shape of interface. It therefore can handle any kind of contact configuration between “substructures” in any complex, including covalent cross-links across substructure interface.
In this paper, we first introduce the theory of fSUB. We then show the features of fSUB by testing it on three structures of different sizes: a four-chain Fur protein, a fourteen-chain molecular chaperonin GroEL complex and a HK97 virus capsid complex.
Methods
Basic Theory
In fSUB, a complex structure is first divided into n substructures. For each substructure i, we can perform NMA on the isolated substructure and obtain the first ki lowest frequency modes (ki ≥ 6, including zero-frequency modes) with eigenvectors { }, where j is the mode index ranged from 1 to ki. For an NMA that does not require initial energy minimization, the first six modes are the zero-frequency trans-rotational modes, and the rest are all positive frequency modes. The normal modes for the substructures are called “substructure modes” in the rest of the article. In this study, we employed our previously developed MGR method 14 for Hamiltonian calculation of both substructures and the whole complex.
For a normal mode of the whole complex with eigenvalue λ and eigenvector y = (y1T, y 2T…y nT)T, the eigenvalue problem can be written as
| (eq.1) |
where H is the Hessian matrix for the whole complex (structure unminimized), yi is the portion of the eigenvector y for the substructure i. Here, yi can be further approximately expressed as a linear combination of the lowest frequency modes { } of the substructure i, or
| (eq.2) |
where vi, is an ki × 1 vector for the substructure mode variables. From eq.2, eq.1 can be rewritten as HPv = λPv, where , v = (v1T, v2T…vnT)T. It is easy to show that the matrix P is a unitary matrix, therefore
| (eq.3) |
where HfSUB is a square matrix of dimension ,
| (eq.4) |
In short, fSUB first performs n Hessian matrix calculations and diagonalizations for all substructures. Then fSUB calculates HfSUB matrix from the substructure modes (eq.4). The modes for the whole complex can be obtained by diagonalizing HfSUB. Any eigenvector v for substructure mode variables can be easily converted back to the original eigenvector y (in Cartesian coordinates) by eq.2, or
| (eq.5) |
The mode calculation method (MGR in this study) used in fSUB should be able to obtain six zero-frequency modes for the whole complex without initial energy minimization step. It guarantees that the projected Hessian HfSUB also has these zero-frequency modes.
Computational Cost
In fSUB, the whole MGR Hessian H is not first calculated and stored in memory. Instead, the elements of H are only computed when they are required for HfSUB calculation. This procedure is similar to the implementation of RTB method in CHARMM package 17. In both cases, the algorithm dramatically reduces memory cost for very large systems.
In the implementation, DSYEVR in LAPACK package was used to calculate the first few lowest frequency eigenvalues and eigenvectors of a real symmetric matrix. The diagonalization method was selected since we found it is usually more stable and faster than some of sparse matrix methods. Some LAPACK implementation (e.g. Math Kernel Library from Intel) also allows easy parallelization. The input of DSYEVR is upper triangle of the Hessian matrix, so the memory cost is o(n2). The diagonalization step usually requires o(n3) operations.
Suppose a structure is equally divided into n substructures, each of which has N degrees of freedom in mode calculation. Therefore, the traditional NMA method requires o(n2N2) memory and o(n3N3) operations. For fSUB, if the first k lowest frequency modes are calculated for each isolated substructure, it needs o(N2) + o(n2k2) + o(nNk) memory, and about o(nN3) + o(n3k3) + o(cnNk2) operations. The last memory term o(nNk) is the memory used to store substructure eigenvectors; the last operation term o(cnNk2) is the operations used to calculate the matrix HfSUB, where c is the average number of atoms in the interaction range of any atom. For cases when n and k are considerably smaller than N, compared to the traditional method, fSUB uses about 1/n2 computational cost for both memory and speed.
Test criteria
Similarity of the lowest-frequency eigenvectors of two different mode calculation methods were evaluated by the overlap index, defined as the projection of an eigenvector of one method onto the lowest frequency mode subspace of the other:
| (eq.6) |
where vi, uj are ith and j th eigenvectors of the two methods respectively and the summation is over all u eigenvectors in the subspace. For a single mode, the magnitude of P ranges from zero (orthogonal, no similarity) to one (overlap, high similarity). The similarity of two methods is indicated by the profile of P, or the average value of P (denoted as P̄), for the lowest-frequency modes of the first method.
For a given eigenvector calculated by fSUB, it is easy to separate rigid body displacements of substructures from internal deformations. Any eigenvector v (with substructure mode variables) of the Hessian matrix HfSUB can be divided into two parts
where . The first six components of are set to be same as those of vi, and the rest components are zero. Recall that v represents substructure mode variables, so only contains contributions from the first six zero-frequency substructure modes for the substructure i. Therefore vext and vint is the external and internal parts of the eigenvector v respectively. From (eq.5), the corresponding fSUB eigenvector y in the Cartesian coordinates can be also divided into two parts
| (eq.7) |
With the yext and yint calculated from (eq.7), the ratio of internal motions for a substructure i can be approximated by , where and are the average atomic displacement for substructure i along the vectors yint and yext respectively. However, since yint and yext are usually not parallel, this is only a rough estimation on the ratio of internal motions.
MGR
In fSUB, Hessian matrix calculation for each substructure and the whole complex and were performed by our recent all-atom NMA with molecular geometry restraints (MGR), originally developed in reference 14.
The MGR potential function contains both long range pair-wise harmonic interactions and short range bond interactions. It takes the form of
where the four terms represent bond length, bond angle, bond dihedral angle and the long range interactions, l, θ, φ, r and l0, θ0, φ0, r0 are instantaneous and initial values of bond length, bond angle, bond dihedral angle and distance respectively. In the current work, we used the optimized parameter set from the original MGR study 14. The cutoff distance for the long-range interactions rc is set as 6AǺ. The four force constants are kr = 1, kl = 1.0 × 10⁴, kθ = 8.2 × 10² and kφ = 6.2 × 101.
MGR only requires coordinates and molecular geometry (bond connectivity) as input. Since the MGR has only harmonic terms specifically designed to have the structure at energy minimum, it does not require initial energy minimization. To reduce computational cost, all MGR calculations in this study are combined with RTB scheme in which each residue is modeled as rigid body. When comparing different normal mode methods in this study, we also used MGR to represent traditional NMA.
Results
In the implementation of fSUB, we used MGR 14 as a method for calculating substructure modes since MGR does not require initial energy minimization, so it can be applied to whatever flexible substructure chosen in the study. In the calculation, RTB scheme was also applied and each residue is grouped as a rigid body. We refer this in the following as residue-based MGR method.
The new fSUB was tested on three X-ray protein structures of various sizes. They are bacterial ferric uptake regulator (Fur) protein (PDB code 2xig 18, 592 residues), molecular chaperonin GroEL (PDB code 1kp8 19, 7350 residues) and virus capsid HK97 (PDB code 1ohg 20, 118,092 residues). These structures were selected to test various aspects of fSUB. In the first case, Fur is a relatively small structure, so it is ideal to test the parameters and their effects on performance of the new method. In the second case, GroEL is larger, but can still be calculated by the traditional NMA method. This case serves to compare the speed of fSUB to the traditional method. In the last case, HK97 capsid is the largest structure among all test cases. We also sought to find new structural and dynamic features from fSUB analysis.
Ferric Uptake Regulator (FUR)
The Fur structure 2xig 18 (shown in Fig. 1) has four chains of same sequence. Since there are missing residues in some chains in the crystal structure, four chains are not completely identical. A single chain of 2xig contains 148 residues on average.
Fig. 1.
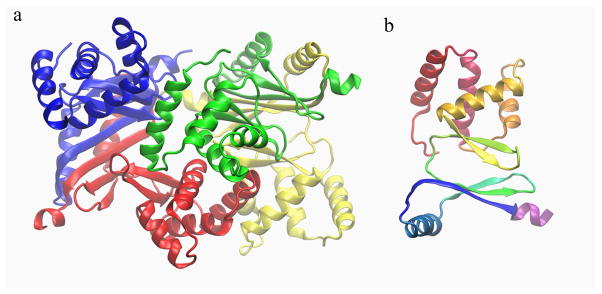
Ribbon diagram and fSUB grouping schemes for the Fur structure 2xig. a. four substructures, each chain is defined as a substructure. b. substructures based on secondary structures. The diagram illustrates the grouping scheme for only one chain (e.g. the blue portion of the structure in a.). There are a total of 44 substructures for the whole complex. Different substructures are shown with different colors.
We first used each chain as a substructure (colors in Fig. 1a), and tested a series of fSUB by changing the number of substructure modes. The upper left panel of Fig. 2 shows the average overlap P̄ for the first 50 low-frequency modes for the whole complex, between eigenvectors from fSUB and from residue-based MGR (calculated on a whole complex as a reference). When only six zero-frequency substructure modes are used, or each chain is modeled as rigid body, P̄ is about 0.68 (the case that can be easily shown to be identical to regular RTB). Interestingly, P̄ goes down to 0.60 when another six low-frequency substructure modes are added. Further increasing the number of substructure modes gradually increases P̄ value. It reaches 0.99 when 90 substructure modes (including zero-frequency modes) are used, and it approaches to 1.0 with more substructure modes. Thus, once the number of substructure modes is larger than 90, fSUB and residue-based MGR essentially produce the same accuracy for low-frequency eigenvectors. Our results also indicate that, to produce accurate enough modes for the complex, the dimension of fSUB Hessian (90 times four in this case) should be substantially larger than the desired number of low frequency modes for the whole complex (50 modes here).
Fig. 2.

The effects of the number of substructure modes on the accuracy of the lowest-frequency eigenvectors of fSUB for the Fur structure 2xig. The average overlap indices were calculated by projecting each of the first 50 lowest-frequency fSUB eigenvectors onto the subspace of the first 50 lowest-frequency MGR eigenvectors. The plot shows the dependence of the average overlap indices to the number of substructure modes. Here shows two grouping schemes: the four-substructure case (at chain level, two upper panels) and the 44-substructure case (at secondary structure level, two lower panels). The solid circles in all panels denote the fSUB case in which the substructure modes were calculated by MGR; the hallow squares in the right panels denote the case in which the substructure modes were calculated by all-atom ENM.
We further tested fSUB by grouping substructures according to the secondary structure (44 substructures, Fig. 1b). As shown in the lower left panel of Fig. 2, the value of P̄ reaches 0.99 when 24 substructure modes are used. In general, fSUB requires less number of substructure modes for smaller substructures to accurately calculate low-frequency eigenvectors of the complex.
We then tested how the quality of substructure modes affects fSUB eigenvectors. In this case, residue-based MGR was replaced by all-atom ENM (see ref 14 for details) for substructure mode calculation, while the Hamiltonian for the whole structure was still calculated by residue-based MGR. As shown in the right panels of Fig. 2, for any number of substructure modes, the values of P̄ in the ENM case are much smaller than those of the MGR case, and the ENM P̄ never approaches 1.0. ENM produces far worse substructure modes because all-atom ENM lacks bonded energy terms and it has “tip-effects” in low-frequency modes 10. The fSUB Hessian sometime cannot even be properly diagonalized by DSYEVR when a large number of ENM substructure modes were used. This indicates that the quality of substructure modes is crucial to both the accuracy and stability of fSUB.
Some further tests of fSUB on the Fur structure can be found in Supporting Information.
Chaperonin GroEL
GroEL is a ring-like structure with 14 identical chains (Fig. 3). The crystal structure 1kp8 21 contains only two subunits, so PISA server 22 were used to automatically build the entire GroEL complex. The whole structure is more than ten times bigger than the Fur protein, but still in the size range that can be calculated by non-hierarchical methods.
Fig. 3.

The GroEL complex 1kp8. a. GroEL complex grouped by subunits (14 substructures). b. GroeEL subunit grouped by domains (42 substructures).
We first calculated the first 100 lowest frequency modes of the complex by residue-based MGR. This calculation is the most fine-grained, so it is regarded as the reference for the other calculations. The whole calculation was finished in about six hours and 46 minutes. We then applied fSUB in which each subunit was regarded as a flexible substructure and the first 50 lowest-frequency substructure modes (including zero-frequency modes) were used. The fSUB calculation only took two minutes and 41 second, or about 151 times as fast as residue-based MGR in this application. From Fig. 4, the overlap index between the first 50 lowest-frequency eigenvectors of fSUB and residue-based MGR is very close to 1.0, indicating high similarity of the low frequency modes between subunit-based fSUB and residue-based MGR.
Fig. 4.

The comparison of lowest-frequency eigenvectors for various mode calculations on the GroEL structure 1kp8. For each normal mode method, the overlap indices were calculated by projecting each of the first 50 lowest-frequency modes onto the subspace formed by the first 50 lowest-frequency modes from residue-based MGR. Four normal mode methods were tested: fSUB with 14 substructures (Fig 3a) and 50 substructure modes for each substructure (solid line); fSUB with 14 substructures and 18 substructure modes for each substructure (dot dash line); fSUB with 42 substructures and 50 substructure modes for each substructure (dot line); RTB with 14 rigid substructures (dash line); RTB with 42 substructures (shot dash line). In the 42-substructure scheme, each GroEL chain was divided into three substructures according to domains (Fig 3b).
To further compare fSUB with RTB method, we did two special RTB calculations with different level of coarse-graining (rigid-body division). In the first case, each subunit was modeled as a rigid body; in the other case, each domain in GroEL subunit was modeled as a rigid body according to domain boundary (each GroEL subunit has three domains: apical, intermediate and equatorial domains, Fig 3b, thus 42 bodies in total). It is clear in Fig. 4 (dash line for first subunit case and short dash line for second domain case), modes of both RTB schemes have much smaller overlaps to the residue-based MGR modes than those of fSUB (solid line). In the doman case, RTB performs better since it uses more bodies (therefore more degrees of freedom) to model deformation of a subunit. We also calculated another fSUB case in which 18 substructure modes were used for each subunit (dot-dash line). Although this fSUB case uses the same number of degree of freedom as the second domain case (42 bodies), the curve of overlap is closer to that of 50 substructure modes, better than any of the RTB case. In other words, in the case of fSUB, even with significantly smaller number of substructure modes (18 in the above case), and larger substructure size (as large as a subunit), fSUB still outperforms RTB with smaller body size (domain case for example). Finally, we calculated another fSUB case in which 50 substructure modes were used for each domain (42 substructures, dot line). As expected, this most fine-grained method produces closest low frequency modes to residue-based MGR among all test cases.
All the above results indicate that rigid-body modeling of large subunit in RTB 12, 17 leads to substantial error in computing lowest frequency modes of the whole complex, while fSUB produces much higher accuracy of the modes for the whole complex and allows for a much larger size of substructures, i.e, a much more aggressive level of coarse-graining.
HK97 Capsid
Virus capsid HK97 (PDB code: 1ohg) 23 is a thin-walled icosahedral structure. It is formed by 420 copies of capsid protein gp5 protein (Fig. 5a), each of which is a single chain protein that contains 280 residues. The whole capsid structure is formed by 60 hexamers (Fig. 5c) and 12 pentamers (Fig. 5d) of gp5. These two building blocks have unique structure features. The hexamer is bigger and is relatively flat comparing with the pentamer. The two building blocks have different roles in forming a capsid. Each of the twelve vertices is occupied by a pentamer (red color in Fig. 5a), while each of the 20 facets are formed by three closely-packed hexamers (blue color in Fig. 5a). Besides, as schematically shown in Fig. 5b, each pentamer (red dot) is surrounded by five hexamers (connected by lines). The mature capsid structure contains 420 covalent cross-links that join residues K169 and N356 between different building blocks (no cross-links between capsid proteins inside a pentamer or hexamer). Modal analyses were performed on the isolated hexamer and pentamer and it was found that eigenvalues of low-frequency modes of a pentamer are about 1.5 times as large as those of a hexamer, suggesting that the pentamer is harder to deform than hexamer (data not shown).
Fig. 5.

The HK97 capsid and its building blocks. a) Trace representation: red parts are the pentamers (five copies of gp5), blue and white parts are the hexamers (six copies of gp5). The three blue hexamers are highlighted to show how they contact and form a facet of the icosahedron. b) More simplified representation for the same structure: each red dot denotes the center of mass of a pentamer and each write dot denotes that of a hexamer. Lines are connected for the hexamers that are closely packed to the same pentamer. c) The structure of a hexamer; d) The structure of a pentamer. In both c and d, the upper portion shows the top view and the lower portion shows the side view. Compared to the hexamer, the pentamer is smaller and has more curvature.
The PDB structure of 1ohg was solved by using icosahedral NCS symmetry, so the deposited structure contains all six chains from a hexamer and one chain from a pentamer. In fSUB analysis, the flexible substructures were not chosen as the deposited structure and its symmetric copies, but the 72 building blocks (the pentamers and the hexamers). The flexible substructures were grouped in this way because it is a natural choice and it is also easy to perform comparison analysis between pentamers and hexamers. The Hamiltonian in fSUB calculation also includes all the 420 cross-links. Since cross-links are not formed within a building block, they don’t affect substructure modes, but only Hessian calculation for the whole structure. The first 50 lowest-frequency substructure modes (including the six zero-frequency modes) were calculated for each substructure. From these substructure modes, the fSUB Hessian was constructed for the whole capsid and the first 100 lowest-frequency modes were calculated. It only took 8 hours and 25 minutes to finish the whole calculation for a structure of almost nine hundred thousand atoms.
Fig. 6 shows the eigenvalues of the first 50 lowest frequency capsid modes (not including zero-frequency modes). Because of the icosahedral symmetry of capsid particle, there are many degenerate modes (grouped by Roman numerals). Each mode group has three to five degenerate modes. The deformations of the mode group I and IV have three fold symmetry; those of the mode group II and III have two fold symmetry; the rest correspond to higher order symmetric motions. The non-degenerate central symmetric breathing mode of the entire icosahedral capsid appeared in much higher frequency in this analysis (mode index 63, not shown in the figure). It is also clear that the cross-links globally rigidify the complex structure as the frequency values of cross-linked system are uniformly larger than those without cross-linking.
Fig. 6.

The eigenvalues of the first 50 lowest-frequency fSUB modes of the HK97 capsid. The capsid were divided into 72 substructures, and 50 substructure modes from each substructure were used for capsid mode calculation. Empty squares denote the case when the fSUB Hamiltonian contains bonded terms of the cross-links; solid circles denote the case when the fSUB Hamiltonian has no terms for the cross-links. The Roman numerals denotes different non-degenerate mode types. It is clear that, with the covalent cross-links. the magnitude of eigenvalues are globally increased, indicating that the complex is stiffened.
We then examined the deformations of pentamers and hexamers in each mode. As shown in Fig. 7a, hexamers in general have larger average atomic displacement for all the calculated lowest-frequency modes and they are very similar for all modes. In contrary, those for the pentamers can be as low as 20% of those of hexamers in some modes, while it can also be 90% for some others. Such large differences between the motions of pentamers and hexamers in a given mode show that the vertices and facets move very differently in capsid deformation.
Fig. 7.

Difference of deformation between the pentamers and the hexamers of HK97 capsid. a) Average atomic displacement of the pentamers (empty squares) and the hexamers (solid circles, normalized to 1.0) for the first 94 lowest-frequency modes (not including zero-frequency modes). b) Ratio of internal motions of the pentamers (empty squares) and the hexamers (solid circles) for the first 94 lowest-frequency modes (not including zero-frequency modes).
To further investigate the difference between pentamer and hexamer in capsid deformation, we also estimated the average ratio of internal motions for each substructure type (Fig. 7b). For the hexamers, the average ratio of internal motions is only about 4% for the mode type I (index 7 to 9) and 3% for the mode type II (index 10 to 14). The ratio gradually increases for the higher frequency modes. For example, the ratio of internal motions for the mode type XII reaches about 25% (index 52 to 56). However, the average ratio of internal motions for the pentamers has no apparent dependency to mode index and the values of ratio can be much higher than that of the hexamers. For example, the average ratio is about 33% for the mode type I and 88% for the mode type III (index 15 to 18). The two left panels of Fig. 8 shows the ratio of internal motions for each building block for the 7th mode (left panel, belongs to the mode type I) and the 18th mode (middle panel, belongs to the mode type III). In both cases, the pentamers (denoted as pentagons) show higher ratio for internal motions (green to red color, the warmer the color, the larger the ratio of internal motion) than the hexamers (denoted as hexagons). Fig. 7 and Fig. 8 suggest that, in many lowest-frequency modes, the pentamers behave like hinges, since they move relatively smaller and have more internal deformations. On the other hand, the hexamers move larger and involve more rigid body motions.
Fig. 8.
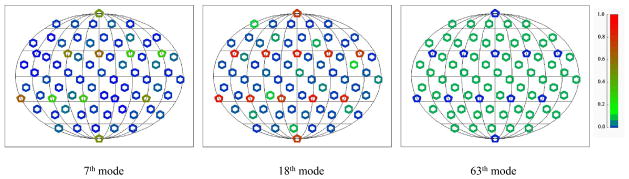
Ratio of internal motions for each of the 72 building blocks of HK97 capsid. All pentamers (denoted as pentagons) and hexamers (deonoted as hexagons) are illustrated in Mollweide projection. The magnitude of the ratio is denoted in the figure with colors (from zero in blue to one in red). The left panel is for the 7th mode (the first non-zero frequency mode), which belongs to the mode type I; the middle panel is for the 18th mode (the 12th non-zero frequency mode), which belongs to the mode type III; the right panel is for the 63rd mode (the non-degenerate central symmetric breathing mode). It is clear that the central symmetric mode has the smallest substructure internal motions.
The results for the motions of the pentamers and the hexamers raise an interesting question: is it sufficient to model the large deformations of a supramolecular complex with highly coarse-grained rigid blocks? Our results have shown that the pentamers can have higher internal deforamtions even in the lowest frequency modes of the capsid. It should be also noted that, according to modal analysis on each isolated substructure, the pentamer is stiffer than the hexamer, but it deforms more, even in the very first few lowest-frequency modes, in the capsid. Therefore, the stiffness for the building blocks does not play a dominant role in determining how they move in the whole complex, rather, the geometrical positions of the building blocks may have more impacts, as in this case all the pentamers resides at the vertices and they deform more than the hexamers that reside on the facets.
To further investigate this problem, we calculated RTB modes for the capsid by modeling each building block as a rigid body. Fig. 9 shows the overlap of RTB eigenvectors onto the first 50 lowest-frequency eigenvector subspace of fSUB (hollow square). The magnitude of overlap is about as high as 0.9 for the first 16 modes, but is dramatically decreased for the higher frequency modes. To see how RTB modes are related to the non-degenerate mode types of fSUB, we also calculated the overlap of each RTB eigenvector onto the subspace of only one type of non-degenerate fSUB modes (solid circles). The first 30 RTB modes is mostly directly related to (> 0.6 overlap) one non-degenerate mode type of fSUB. From the data, we found that the 7th to 11th RTB modes belong to the mode type II of fSUB, while the 12th to 14th RTB modes belong to the mode type I of fSUB. The order of eigenvalues changes, because the high internal motions of the pentamers in the mode type I are prohibited in the RTB modes, thus causing more stress. Similar results were also found when compared with the calculated modes from cluster normal mode analysis (cNMA) on the same structure in ref 24. Similar to RTB, cNMA modeled each seven chains as rigid body. According to their study, the 12th to 15th cNMA modes have breathing motion along three evenly spaced axes around the equator. These modes belong to the mode type I in fSUB, but have higher frequency than some other low-frequency modes in cNMA.
Fig. 9.

The overlap indices of RTB modes onto the fSUB mode subspace of HK97 capsid. For each of the first 50 non-zero lowest-frequency RTB modes, the overlap index was calculated by projecting the eigenvector to fSUB eigenvector subspace. Two subspaces were calculated in the test: the subspace formed by the first 50 lowest-frequency fSUB eigenvector (empty squares) and the closest subspace formed by all degenerate eigenvectors from any single non-degenerate mode type (solid cricles).
The non-redundant central symmetric breathe mode was found to be the 63rd mode in the fSUB calculation but the 33rd mode in the RTB calculation. It raises an interesting question: why the mode index for the symmetric mode can have such a dramatic shift? From Fig. 7(b), for the 63rd mode of fSUB, the ratio of internal motion of hexamers is about 13.7% and is relative smaller than that of the other modes with similar frequency. The ratio of internal motion of pentamers is as low as 2.8%. It suggests that these building blocks do more rigid body motions in this mode. It is also clearly shown in the right panel of Fig. 8, that all hexamers or pentamers have similar low level of internal motions (blue to green color). Thus rigid body approximation in RTB method works well in the symmetric mode. However, for the other modes in fSUB with similar frequency, RTB can not fully capture the motion patterns, since the pentamers and hexamers have more internal motions. It is likely that many non-central-symmetric modes in RTB calculation are up-shifted in frequency due to stress in the rigid bodies, while the central symmetric mode, like mode 63 in the right panel of Fig. 8, is much less affected.
Concluding Discussion
In this study, we developed a new normal mode analysis (named as fSUB) for studying supramolecular complexes. It divides a molecular complex into a group of flexible substructures, the motions of which are modeled by the low-frequency modes of the substructures in isolation. The motions of the entire complex are then calculated based on the substructure modes and substructure-substructure interactions. Therefore, fSUB converts a normal mode analysis from Cartesian coordinate (or internal coordinate) space to substructure mode space. The method can calculate modes for very large complexes without sacrificing too much in mode accuracy.
The implementation of fSUB requires the method for computing modes without initial energy minimization. This is important so that the coordinates used for substructure mode calculation (with substructures in isolation) are identical to the ones in complex, a feature vitally important for energetic and structural consistency in mode calculation for the entire complex. For HK97 capsid, there are covalent cross-links across the interface between substructures, initial energy minimization in case like this would be even more problematic. Also, energy minimization for a complex as big as HK97 capsid is computationally unfeasible anyway.
The quality of substructure modes affects both the accuracy and stability of fSUB. As we have shown in the results section, MGR 14 performs much better than conventional elastic network model (ENM) 4 when it was used to produce substructure modes in fSUB. That is because MGR can produce better modes due to the information of molecular geometry constraints. Thus, we used MGR throughout the whole study.
In RTB method 12, a structure is divided into rigid blocks, and the trans-rotational degrees of freedom of all blocks are used to construct normal modes of the whole complex. It can be easily shown that fSUB reduces to RTB if only the six rigid-body zero modes of each substructure are used as substructure modes. However, unlike RTB, in which larger block size introduces larger error, fSUB can substantially improve mode accuracy because of the flexibility of substructures. Our study shows that even in the lowest-frequency modes of the complex, there are significant deformation of substructures. By using sufficient substructure modes, fSUB with larger substructures can produce lowest-frequency modes as accurate as the fSUB with smaller substructures.
The method has also been shown to be very fast. It can dramatically reduce computational costs for large molecular complexes. Theoretically, if n substructures are included, fSUB scales about 1/n2 in computational cost for both memory and speed. In our study, we showed that fSUB can be two orders of magnitude as fast as the conventional NMA (residue-based MGR in this study) for structure complexes as large as GroEL (7350 residues). The method can also be applied to complexes, such as HK97 capsid (118,092 residues), that are beyond the reach of conventional methods.
The fSUB scheme can also be used with multiple hierarchy. Since mode calculation for substructures can be done by any normal mode method without initial energy minimization, fSUB can be applied to an isolated substructure by dividing it into some more fine-grained substructures.
Recently, Ming et. al. 25 developed an improved version of substructure synthesis method called VISSM. In that method, virtual interface substructures (VIS) are created to connect to neighboring substructures, and geometry-compatible conditions are applied between a VIS and a real substructure. Both fSUB and VISSM are able to calculate lowest frequency modes at atomic level for supramolecular complexes. Compared to VISSM, fSUB has the following advantages. First, VISSM can only be applied to linear complexes, while fSUB has no restriction to the arrangement of substructures (such as HK97 capsid). Second, the atoms in VIS from VISSM are usually scattered atoms (nodes) for bridging boundary, so it requires coarse-grained method like elastic network models to perform mode calculation. On the other hand, fSUB doesn’t require virtual structure to define boundary.
There are many application values of fSUB. First, like mentioned above, fSUB can handle much larger size of complexes. Second, fSUB works for the NMA without initial energy minimization. So fSUB can be applied to the cases where one cannot do energy minimization, such as normal-mode-based X-ray crystallographic refinement.26–29 Third, fSUB can analyze a specific component (substructure) of a whole complex for functional purpose. For example, in the case of HK97 capsid, we showed the different roles of pentamors and hexamors in lowest-frequency modes. We expect fSUB will be a useful tool for NMA of supramolecular complexes.
Supplementary Material
Acknowledgments
The authors acknowledge support of grants from the National Institutes of Health (R01-GM067801), the National Science Foundation (MCB-0818353), and the Welch Foundation (Q-1512).
Footnotes
Supporting Information Available
The Supporting Information includes some additional performance tests of fSUB on the Fur structure 2xig. This information is available free of charge via the Internet at http://pubs.acs.org/.
References
- 1.Brooks B, Karplus MP. Natl Acad Sci-Biol. 1983;80:6571–6575. doi: 10.1073/pnas.80.21.6571. [DOI] [PMC free article] [PubMed] [Google Scholar]
- 2.Bahar I, Rader AJ. Curr Opin Struc Biol. 2005;15:586–592. doi: 10.1016/j.sbi.2005.08.007. [DOI] [PMC free article] [PubMed] [Google Scholar]
- 3.Ma JP. Structure. 2005;13:373–380. doi: 10.1016/j.str.2005.02.002. [DOI] [PubMed] [Google Scholar]
- 4.Atilgan AR, Durell SR, Jernigan RL, Demirel MC, Keskin O, Bahar I. Biophys J. 2001;80:505–515. doi: 10.1016/S0006-3495(01)76033-X. [DOI] [PMC free article] [PubMed] [Google Scholar]
- 5.Ming D, Kong YF, Lambert MA, Huang Z, Ma JP. P Natl Acad Sci USA. 2002;99:8620–8625. doi: 10.1073/pnas.082148899. [DOI] [PMC free article] [PubMed] [Google Scholar]
- 6.Tirion MM. Phys Rev Lett. 1996;77:1905–1908. doi: 10.1103/PhysRevLett.77.1905. [DOI] [PubMed] [Google Scholar]
- 7.Hinsen K. J Comput Chem. 2000;21:79–85. [Google Scholar]
- 8.Suhre K, Sanejouand YH. Nucleic Acids Res. 2004;32:W610–W614. doi: 10.1093/nar/gkh368. [DOI] [PMC free article] [PubMed] [Google Scholar]
- 9.Ming D, Wall ME. Phys Rev Lett. 2005;95:159902. doi: 10.1103/PhysRevLett.95.198103. [DOI] [PubMed] [Google Scholar]
- 10.Lu MY, Poon B, Ma JP. J Chem Theory Comput. 2006;2:464–471. doi: 10.1021/ct050307u. [DOI] [PMC free article] [PubMed] [Google Scholar]
- 11.Yang Z, Bahar I, Widom M. Biophys J. 2009;96:4438–48. doi: 10.1016/j.bpj.2009.03.016. [DOI] [PMC free article] [PubMed] [Google Scholar]
- 12.Tama F, Gadea FX, Marques O, Sanejouand YH. Proteins. 2000;41:1–7. doi: 10.1002/1097-0134(20001001)41:1<1::aid-prot10>3.0.co;2-p. [DOI] [PubMed] [Google Scholar]
- 13.Lu M, Ma J. Proc Natl Acad Sci U S A. 2008;105:15358–63. doi: 10.1073/pnas.0806072105. [DOI] [PMC free article] [PubMed] [Google Scholar]
- 14.Lu MY, Ma JP. Arch Biochem Biophys. 2011;508:64–71. doi: 10.1016/j.abb.2010.12.031. [DOI] [PMC free article] [PubMed] [Google Scholar]
- 15.Ma JP, Ming D, Kong YF, Wu YH. P Natl Acad Sci USA. 2003;100:104–109. doi: 10.1073/pnas.232588999. [DOI] [PMC free article] [PubMed] [Google Scholar]
- 16.Ming D, Kong Y, Wu Y, Ma J. Biophys J. 2003;85:27–35. doi: 10.1016/S0006-3495(03)74451-8. [DOI] [PMC free article] [PubMed] [Google Scholar]
- 17.Li GH, Cui Q. Biophys J. 2002;83:2457–2474. doi: 10.1016/S0006-3495(02)75257-0. [DOI] [PMC free article] [PubMed] [Google Scholar]
- 18.Dian C, Vitale S, Leonard GA, Bahlawane C, Fauquant C, Leduc D, Muller C, de Reuse H, Michaud-Soret I, Terradot L. Mol Microbiol. 2011;79:1260–75. doi: 10.1111/j.1365-2958.2010.07517.x. [DOI] [PubMed] [Google Scholar]
- 19.Wang J, Boisvert DC. J Mol Biol. 2003;327:843–55. doi: 10.1016/s0022-2836(03)00184-0. [DOI] [PubMed] [Google Scholar]
- 20.Helgstrand C, Wikoff WR, Duda RL, Hendrix RW, Johnson JE, Liljas L. J Mol Biol. 2003;334:885–99. doi: 10.1016/j.jmb.2003.09.035. [DOI] [PubMed] [Google Scholar]
- 21.Wang J, Boisvert DC. J Mol Biol. 2003;327:843–855. doi: 10.1016/s0022-2836(03)00184-0. [DOI] [PubMed] [Google Scholar]
- 22.Krissinel E, Henrick K. J Mol Biol. 2007;372:774–797. doi: 10.1016/j.jmb.2007.05.022. [DOI] [PubMed] [Google Scholar]
- 23.Heigstrand C, Wikoff WR, Duda RL, Hendrix RW, Johnson JE, Liljas L. J Mol Biol. 2003;334:885–899. doi: 10.1016/j.jmb.2003.09.035. [DOI] [PubMed] [Google Scholar]
- 24.Chirikjian GS, Schuyler AD. J Mol Graph Model. 2005;24:46–58. doi: 10.1016/j.jmgm.2005.05.002. [DOI] [PubMed] [Google Scholar]
- 25.Chen XH, Sun YX, An XB, Ming DM. J Chem Phys. 2011;135:144108. doi: 10.1063/1.3647314. [DOI] [PubMed] [Google Scholar]
- 26.Poon BK, Chen XR, Lu MY, Vyas NK, Quiocho FA, Wang QH, Ma JP. P Natl Acad Sci USA. 2007;104:7869–7874. doi: 10.1073/pnas.0701204104. [DOI] [PMC free article] [PubMed] [Google Scholar]
- 27.Chen X, Wang Q, Ni F, Ma J. Proc Natl Acad Sci U S A. 2010;107:11352–7. doi: 10.1073/pnas.1000142107. [DOI] [PMC free article] [PubMed] [Google Scholar]
- 28.Chen X, Lu M, Poon BK, Wang Q, Ma J. Acta Crystallogr D Biol Crystallogr. 2009;65:339–47. doi: 10.1107/S0907444909003539. [DOI] [PMC free article] [PubMed] [Google Scholar]
- 29.Chen XR, Poon BK, Dousis A, Wang QH, Ma JP. Structure. 2007;15:955–962. doi: 10.1016/j.str.2007.06.012. [DOI] [PMC free article] [PubMed] [Google Scholar]
Associated Data
This section collects any data citations, data availability statements, or supplementary materials included in this article.