

Abstract
Background
We examined whether survivors from the Childhood Cancer Survivor Study were less likely to be in higher skill occupations than a sibling comparison and whether certain survivors were at higher risk.
Methods
We created three mutually-exclusive occupational categories for participants aged ≥25 years: Managerial/Professional and Non-Physical and Physical Service/Blue Collar. We examined currently employed survivors (N=4845) and siblings (N=1727) in multivariable generalized linear models to evaluate the likelihood of being in the three occupational categories. Among all participants, we used multinomial logistic regression to examine the likelihood of these outcomes in comparison to being unemployed (survivors N=6671; siblings N=2129). Multivariable linear models were used to assess survivor occupational differences by cancer and treatment variables. Personal income was compared by occupation.
Results
Employed survivors were less often in higher skilled Managerial/Professional occupations (Relative Risk=0.93, 95% Confidence Interval 0.89–0.98) than siblings. Survivors who were Black, were diagnosed at a younger age, or had high-dose cranial radiation were less likely to hold Professional occupations than other survivors. In multinomial models, female survivors’ likelihood of being in full-time Professional occupations (27%) was lower than male survivors (42%) and female (41%) and male (50%) siblings. Survivors’ personal income was lower than siblings within each of the three occupational categories in models adjusted for sociodemographic variables.
Conclusions
Adult childhood cancer survivors are employed in lower skill jobs than siblings. Survivors with certain treatment histories are at higher risk and may require vocational assistance throughout adulthood.
Keywords: Neoplasms, Occupations, Survivors, Socioeconomic Factors, Late Effects, Female
Introduction
There are over 328,000 childhood cancer survivors (CCS) in the United States.1 During the past four decades, survival from childhood cancers has improved substantially due to new and improved treatments and advancements in supportive care.2 Cure, however, is not without consequence. Surgery, chemotherapy, and radiation are associated with late health effects that can affect survivors’ physical, psychosocial and cognitive functioning.3–6 As a result, researchers have increasingly sought to identify the effect of treatment-related health problems on the social and economic characteristics of adult survivors. Many survivors report education difficulties, unemployment, and lower incomes, and are more likely to have public health insurance coverage in contrast to non-affected populations.7–11 The impact of childhood cancer on occupational achievement, however, has not been reported.
Assessing occupations can capture several aspects of socioeconomic status, summarizing the income, education and skill requirements associated with achievement of specific job types. Studies of other high risk populations, such as employed adults with disabilities, find that even after accounting for educational attainment, these workers are disproportionately employed in entry-level, lower-wage jobs.12 Such jobs are associated with an increased risk of morbidity and mortality13, 14 and more exposure to workplace hazards and job instability.15 Employees in lower-skilled jobs, such as the service industry, have fewer opportunities for employer-sponsored health insurance, retirement savings, disability leave, and career advancement than management and professional occupations.16
Certain CCS may be at higher risk for poor occupational outcomes due to their treatment histories. Survivors treated with cranial radiation face cognitive limitations, hearing loss or other neurosensory problems.5, 6 Bone tumor and soft tissue sarcoma survivors may have amputations or limb-sparing surgeries that affect their functional status17 and limit their ability to perform tasks required for some occupations. Other factors, such as female sex and younger age at diagnosis, have been associated with lower levels of employment in adult survivors,18 and could potentially impact occupational achievement.
The purpose of this study was to 1) assess whether employed CCS are underrepresented in higher-skilled occupations and are disproportionately in jobs that require fewer skills compared to a sibling cohort and 2) determine whether specific risk factors (e.g., female sex or a history cranial radiotherapy) predict survivors’ occupational attainment. Because many CCS report physical limitations,19 we were interested in evaluating whether survivors who were employed in lower-skilled occupations reported their jobs required physical activity, since we hypothesized that physical problems could limit the types of jobs available to survivors with fewer employment skills. We also examined whether personal income differed within occupations for survivors compared to siblings.
Methods
Participants
The Childhood Cancer Survivor Study (CCSS) is a multi-institutional research initiative started in 1994 to investigate health outcomes in childhood and adolescent cancer survivors. The cohort includes survivors diagnosed when younger than age 21 years, and a group of randomly selected age-matched siblings.20 Participants were diagnosed between January 1, 1970 and December 31, 1986 and had survived at least five years from the time of diagnosis.21, 22 Eligible diagnoses included leukemia, central nervous system (CNS) malignancies (all histologies), Hodgkin’ s lymphoma (HL), non-Hodgkin lymphoma (NHL), Wilms tumor, neuroblastoma, soft tissue sarcoma, or malignant bone tumor. The Human Subjects Committees at the 26 participating institutions reviewed and approved the CCSS protocol.
CCSS participants have completed a baseline survey (1994–96) and four follow-up surveys. We performed the current cross-sectional analyses using the second follow-up (2003), because detailed information was asked about current occupation at this time. Information on cancer type, treatments received, and clinical characteristics of the survivors was obtained from medical records.
At baseline, there were 14,357 survivors and 3,418 siblings. By the second follow-up, 8.2% survivors had refused contact or were lost to follow-up, and 11.3% had died; 10.5% of siblings were no longer being followed. Of the remaining 11,560 survivors and 3601 siblings, the second follow-up was completed by 9289 survivors and 2792 siblings. Because 26% of survivors between ages 20–24 were still in school, we excluded 2145 survivors and 512 siblings who were <25 years of age at survey completion. Students engaged in post-secondary education likely have jobs that do not reflect their eventual occupational attainment. We used no upper age limit, because the oldest eligible survivors and siblings were 54 years and 58 years respectively.
We generated two analysis samples from the remaining N=7144 survivors and N=2280 siblings. First, we excluded the 473 survivors and 151 siblings with missing employment information. Then, because of the high levels of unemployment (survivors 27%, siblings 19%), we performed analyses comparing the occupations of employed to unemployed participants (N=6671 survivors and N=2129). We also performed analyses limited to participants who were currently employed (N=4845 survivors, N=1727 siblings).
Occupation measures
CCSS participants were asked to list their main job title and tasks. These were coded according to the US Department of Labor Standard Occupational Classification (SOC) System (http://www.bls.gov/soc/). The SOC has 23 major occupational groups that include detailed information on occupations requiring similar job duties, skills, education, or experience. We excluded military due to potential differences in skill requirements (N=10 survivors; N=16 siblings).
The remaining 22 groups were classified into three mutually exclusive occupational categories (Figure 1). First, occupations were coded as “Professional/Managerial” or “Service/Blue Collar.” We grouped Professional/Managerial positions according to assessment of skill levels and/or experience to capture higher skill and experience jobs. Because of medical conditions potentially limiting survivors from performing physical labor common to Service/Blue Collar occupations, we coded the remaining occupations as Physical or Non-Physical. Participants reporting mostly heavy labor or physically demanding work were coded as “Physical.” Those reporting primarily sitting, standing or walking were coded as “Non-Physical.” We used the 5-point Job Zone classification developed by occupational experts from the Occupational Information Network (O*Net) database (http://onetcenter.org) to assess agreement with our created occupational categories.23 Occupations with higher Job Zone scores require more education, preparation and training, and the “Professional/Managerial” average Job Zone scores (3.4–5.0) were higher than Service/Blue Collar (1.0–2.7).
Figure 1. Distribution of jobs among survivors and siblings by occupation.
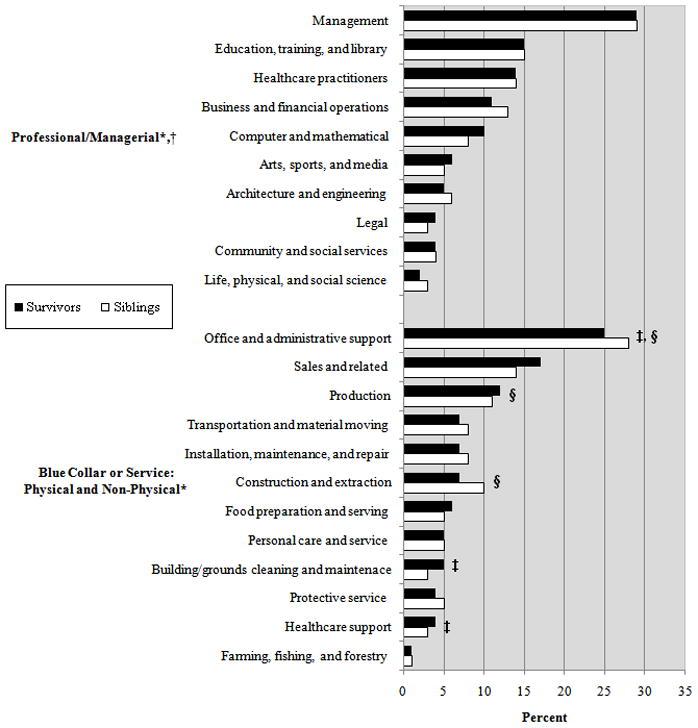
* N=4845 survivors and N=1727 siblings who were currently employed; Professional: N=2589 survivors and N=1026 siblings; Non-Physical N=1787 survivors and N=551 siblings; Physical N=469 survivors and N=150 siblings
†The proportions reporting specific Professional jobs did not differ significantly between survivors and siblings.
‡The proportion of survivors and siblings reporting Non-Physical work was significantly different for this job.
§The proportion of survivors and siblings reporting Physical work was significantly different for this job.
Other measures
For the survivor-sibling comparisons, we included current age, sex and race in all models. Full-time employment was considered as working ≥30 hours per week and part-time <30 hours. Cancer recurrence and secondary cancers (not including nonmelanoma skin cancers) were examined to account for subsequent events. For chemotherapy and radiation treatment, we evaluated whether survivors received any of these therapies as well as the specific types of chemotherapeutic agents (platinum, alkylating agents, anthracyclines, and bleomycin) and the location of specific radiation regions (brain/head, neck, chest, spine, abdomen, pelvis, arm/leg, or total body irradiation). We hypothesized that cranial radiation would be highly related to occupation and created a 7-level categorical variable to investigate doses. All other cancer-related variables are listed in Table 2.
Table 2.
Cancer and treatment-related characteristics for survivors by occupational status*
| Employed |
Unemployed N=1826 (23%) | ||||||||
|---|---|---|---|---|---|---|---|---|---|
| N=6671 | N | Professional/Managerial N=2589 (39%) | Nonphysical N=1787 (27%) | Physical N=469 (7%) | |||||
| N | % | N | % | N | % | N | % | ||
| Diagnosis | |||||||||
| Leukemia | 2046 | 713 | 35 | 631 | 31 | 196 | 9 | 506 | 25 |
| Central Nervous System | 829 | 197 | 24 | 221 | 27 | 50 | 6 | 361 | 44 |
| Hodgkin’ s Disease | 1096 | 512 | 47 | 261 | 24 | 64 | 6 | 259 | 24 |
| Non-Hodgkin Lymphoma | 585 | 231 | 39 | 159 | 27 | 52 | 9 | 143 | 24 |
| Wilms tumor | 482 | 195 | 40 | 130 | 27 | 28 | 6 | 129 | 27 |
| Neuroblastoma | 287 | 119 | 41 | 78 | 27 | 17 | 6 | 73 | 25 |
| Soft tissue sarcoma | 650 | 297 | 46 | 155 | 24 | 45 | 7 | 153 | 24 |
| Bone cancer | 696 | 325 | 47 | 152 | 22 | 17 | 2 | 202 | 29 |
| Age at diagnosis | |||||||||
| ≤ 4 years | 1782 | 577 | 32 | 536 | 30 | 157 | 9 | 512 | 29 |
| 5–9 years | 1696 | 606 | 36 | 470 | 28 | 134 | 8 | 486 | 29 |
| 10–14 years | 1729 | 727 | 42 | 435 | 25 | 105 | 6 | 462 | 27 |
| ≥15 years | 1464 | 679 | 46 | 346 | 24 | 73 | 5 | 366 | 25 |
| Cancer recurrence | |||||||||
| Yes | 652 | 240 | 37 | 169 | 26 | 40 | 6 | 203 | 31 |
| No | 6019 | 2349 | 39 | 1618 | 27 | 429 | 7 | 1623 | 27 |
| Secondary cancers | |||||||||
| Yes | 335 | 127 | 38 | 79 | 24 | 13 | 4 | 116 | 35 |
| No | 6336 | 2462 | 39 | 1708 | 27 | 456 | 7 | 1710 | 27 |
| Years since diagnosis | |||||||||
| ≤20 | 1547 | 612 | 40 | 394 | 25 | 116 | 8 | 425 | 28 |
| 21–30 | 4170 | 1591 | 38 | 1142 | 27 | 296 | 7 | 1141 | 27 |
| >30 | 954 | 386 | 40 | 251 | 26 | 57 | 6 | 260 | 27 |
| Treatment era | |||||||||
| 1970–73 | 1069 | 425 | 40 | 285 | 27 | 69 | 6 | 290 | 27 |
| 1974–77 | 1712 | 638 | 37 | 475 | 28 | 113 | 7 | 486 | 28 |
| 1978–81 | 2006 | 769 | 38 | 536 | 27 | 149 | 7 | 552 | 28 |
| 1982–86 | 1884 | 757 | 40 | 491 | 26 | 138 | 7 | 498 | 26 |
| Chemotherapy | |||||||||
| Any chemotherapy | 4754 | 1898 | 40 | 1255 | 26 | 340 | 7 | 1261 | 27 |
| No chemotherapy | 1339 | 505 | 38 | 359 | 27 | 74 | 6 | 401 | 30 |
| Missing† | 578 | 184 | 32 | 171 | 30 | 54 | 9 | 163 | 29 |
| Platinum chemotherapy | |||||||||
| Any | 237 | 106 | 45 | 60 | 25 | 5 | 2 | 66 | 28 |
| No platinum | 5856 | 2297 | 39 | 1554 | 27 | 409 | 7 | 1596 | 27 |
| Missing† | 578 | 186 | 32 | 173 | 30 | 55 | 10 | 164 | 28 |
| Radiation | |||||||||
| Any | 4338 | 1664 | 38 | 1176 | 27 | 297 | 7 | 1201 | 28 |
| No radiation | 1749 | 736 | 42 | 435 | 25 | 118 | 7 | 460 | 26 |
| Missing† | 584 | 189 | 32 | 176 | 30 | 54 | 9 | 165 | 28 |
| Cranial radiation‡ | |||||||||
| None | 1762 | 742 | 42 | 440 | 25 | 118 | 7 | 462 | 26 |
| Cumulative dose | |||||||||
| Scatter low§ | 1887 | 868 | 46 | 470 | 25 | 97 | 5 | 452 | 24 |
| Scatter high§ | 189 | 92 | 49 | 40 | 21 | 15 | 8 | 42 | 22 |
| <18 Gy | 539 | 208 | 39 | 159 | 30 | 45 | 8 | 127 | 24 |
| 18–24 Gy | 742 | 228 | 31 | 247 | 33 | 82 | 11 | 185 | 25 |
| 25–34 Gy | 129 | 41 | 32 | 46 | 36 | 8 | 6 | 34 | 26 |
| ≥35 Gy | 613 | 134 | 22 | 162 | 26 | 29 | 5 | 288 | 47 |
| Missing† | 810 | 276 | 34 | 223 | 28 | 75 | 9 | 236 | 29 |
| Surgery sites | |||||||||
| Amputation | 432 | 190 | 44 | 92 | 21 | 14 | 3 | 136 | 31 |
| Limb-sparing | 66 | 20 | 30 | 16 | 24 | 3 | 5 | 27 | 41 |
| CNS resection | 950 | 244 | 26 | 263 | 28 | 57 | 6 | 386 | 41 |
Percentages calculated by row
Includes subjects who did not provide consent for release of medical information regarding detailed treatment exposures.
Denominator is number of patients receiving radiation exposure with cranial radiation information (N=5861).
Scatter Low=no treatment to head or brain, but patient received radiation to some part of the body (dose range >0 to <1 Gy); Scatter high=no direct treatment to segment, but treatment was nearby (≥1 to ≤5 Gy)
Statistical analyses
The proportions of survivors and siblings in each occupational category (including unemployed) were calculated overall and by demographic characteristics. Additional proportions were calculated for survivors by cancer and treatment characteristics.
To compare survivors to siblings, we used multivariable regression with robust variance estimates to account survivor-sibling correlations24 adjusting for age, sex, and race. We limited the analyses to employed participants, comparing survivors in each cancer diagnosis group to siblings, separately for Professional/Managerial, Non-Physical, and Physical occupations. Because of the high proportion of participants in each occupational category, the results are reported as relative risks (RR) with 95% confidence intervals (95% CI).25 Sensitivity analyses examined the impact of excluding the highest and lowest average Job Zone values and were consistent with the overall regression estimates. Next, to assess differences in occupations and unemployment between survivors and siblings, we calculated predicted probabilities from multinomial logistic regressions for the categories of full- and part-time Professional/Managerial, Non-Physical, and Physical Occupations and Unemployed24 with an interaction for survivor/sibling status by sex.
To estimate associations of cancer and treatment-related variables with the occupational categories, we next performed multivariable relative risk regressions limited to employed survivors. Cancer diagnosis was not included due to being closely related to treatment. We first examined the 7-category cranial radiation dose variable with current age, sex and race. We then investigated the other treatment variables, considering that many of the cancer treatments are related. We also calculated predicted probabilities from ordinal logistic regressions for yearly personal income for the survivors and siblings by occupation. Because of potential endogeneity with occupational status, we examined educational attainment separately for all regressions. Analyses were performed using Stata version 11.0 (Stata Corp, College Station, TX). All reported p-values are two-sided and considered significant at α=0.05.
Results
Twenty-seven percent of survivors were unemployed compared to 19% of siblings (P<0.001). Unemployment was due to staying at home to take care of family or children, or being a student or retired (survivors 12%; siblings 14%), not working because of health limitations (survivors 9.3%; siblings 1.5%), and being unemployed but currently seeking work (survivors 5%; siblings 2.7%). Among survivors, 39% reported a Professional occupation compared to 48% of siblings (P<0.001), although the distribution of specific jobs within this category did not differ (Figure 1). The proportions reporting Physical (25% vs. 27%) and Non-Physical (7% vs. 7%) occupations were similar between survivors and siblings; however, within these categories there were differences in the proportions reporting certain jobs.
Survivors in all occupational categories tended to be younger or male more often than siblings, while the proportion working full-time did not differ (Table 1). Fewer survivors with leukemia or CNS tumors were in Professional jobs and those with higher doses of cranial radiation were less often employed or working in Professional jobs (Table 2).
Table 1.
Demographic characteristics of survivors and siblings by occupational status
| N(%) | Full Sample* | Employed |
Unemployed | |||||||||||||||||
|---|---|---|---|---|---|---|---|---|---|---|---|---|---|---|---|---|---|---|---|---|
| Professional | Non-Physical | Physical | ||||||||||||||||||
| Survivors N=6671 | Siblings N=2129 | Survivors N=2589 | Siblings N=1026 | Survivors N=1787 | Siblings N=551 | Survivors N=469 | Siblings N=150 | Survivors N=1826 | Siblings N=402 | |||||||||||
| N | % | N | % | N | % | N | % | N | % | N | % | N | % | N | % | N | % | N | % | |
| Current age (years) | ||||||||||||||||||||
| 25–34 | 3793 | 57 | 985 | 46 | 1345 | 52 | 464 | 45 | 1069 | 60 | 242 | 44 | 308 | 66 | 77 | 51 | 1071 | 59 | 202 | 50 |
| 35–44 | 2302 | 34 | 806 | 38 | 973 | 38 | 390 | 38 | 581 | 32 | 213 | 3 | 135 | 29 | 56 | 37 | 613 | 34 | 147 | 37 |
| 45+ | 576 | 9 | 338 | 16 | 271 | 10 | 172 | 17 | 137 | 8 | 96 | 17 | 26 | 6 | 17 | 11 | 142 | 8 | 53 | 13 |
| Sex | ||||||||||||||||||||
| Male | 3385 | 51 | 964 | 45 | 1389 | 54 | 492 | 48 | 937 | 52 | 257 | 47 | 410 | 87 | 120 | 80 | 649 | 36 | 95 | 24 |
| Female | 3286 | 49 | 1165 | 55 | 1200 | 46 | 534 | 52 | 850 | 48 | 294 | 53 | 59 | 13 | 30 | 20 | 117 | 64 | 307 | 76 |
| Race† | ||||||||||||||||||||
| White, non-Hispanic | 5767 | 87 | 1917 | 93 | 2304 | 89 | 928 | 94 | 1556 | 88 | 495 | 93 | 411 | 92 | 135 | 92 | 1496 | 82 | 359 | 93 |
| Black, non-Hispanic | 208 | 3 | 39 | 2 | 48 | 2 | 18 | 2 | 72 | 4 | 13 | 2 | 11 | 2 | 1 | 1 | 77 | 4 | 7 | 2 |
| Hispanic | 239 | 4 | 51 | 3 | 83 | 3 | 17 | 2 | 55 | 3 | 15 | 3 | 17 | 4 | 5 | 3 | 84 | 5 | 14 | 4 |
| Other/mixed | 436 | 7 | 50 | 3 | 149 | 6 | 26 | 3 | 101 | 6 | 11 | 2 | 29 | 6 | 6 | 4 | 157 | 9 | 7 | 2 |
| Education‡ | ||||||||||||||||||||
| ≤ High school | 1160 | 18 | 266 | 13 | 121 | 5 | 42 | 4 | 406 | 23 | 118 | 21 | 130 | 28 | 52 | 35 | 503 | 28 | 54 | 13 |
| Some college or more | 5465 | 82 | 1857 | 87 | 2465 | 95 | 981 | 96 | 1373 | 77 | 432 | 79 | 338 | 72 | 97 | 65 | 1289 | 72 | 347 | 87 |
| Marital status§ | ||||||||||||||||||||
| Married | 3371 | 49 | 1385 | 65 | 1503 | 58 | 681 | 67 | 836 | 47 | 337 | 62 | 228 | 49 | 89 | 60 | 804 | 44 | 278 | 70 |
| Not married | 3275 | 51 | 736 | 35 | 1078 | 42 | 343 | 34 | 942 | 53 | 211 | 38 | 240 | 51 | 60 | 40 | 1015 | 56 | 122 | 30 |
| Children | ||||||||||||||||||||
| Yes | 2533 | 38 | 1287 | 60 | 948 | 37 | 573 | 56 | 666 | 37 | 349 | 63 | 173 | 37 | 92 | 61 | 746 | 41 | 273 | 68 |
| No | 4138 | 62 | 842 | 40 | 1641 | 63 | 453 | 44 | 1121 | 63 | 202 | 37 | 296 | 63 | 58 | 39 | 1080 | 59 | 129 | 32 |
| Health Insurance|| | ||||||||||||||||||||
| Canadian | 406 | 6 | 172 | 8 | 167 | 6 | 90 | 9 | 91 | 5 | 49 | 9 | 31 | 7 | 25 | 17 | 117 | 7 | 18 | 5 |
| Yes | 5522 | 83 | 1786 | 84 | 2296 | 89 | 894 | 87 | 1499 | 84 | 460 | 83 | 359 | 77 | 108 | 73 | 1368 | 76 | 324 | 81 |
| No | 695 | 11 | 167 | 8 | 115 | 4 | 42 | 4 | 189 | 11 | 42 | 8 | 76 | 16 | 15 | 10 | 315 | 18 | 58 | 14 |
| Employment Status | ||||||||||||||||||||
| Full-time (≥30 hours) | 4358 | 90 | 1559 | 90 | 2401 | 93 | 932 | 91 | 1519 | 85 | 496 | 90 | 428 | 93 | 131 | 87 | NA | NA | ||
| Part-time (<30 hours) | 487 | 10 | 168 | 10 | 188 | 7 | 94 | 9 | 267 | 15 | 55 | 10 | 31 | 7 | 19 | 13 | ||||
Full sample is comprised of employed and unemployed participants≥ 25years with available employment and occupational information except for employment status, which is only calculated for currently employed participants. All survivor-sibling comparisons significant at p<0.001for the full sample except for employment status.
Race/ethnicity reported by N=6650 survivors; N=2057 siblings
Highest achieved education reported by N=6625 survivors; N=2123 siblings
Marital status reported N=6646 survivors; N=2121 siblings
Health insurance reported by N=6623 survivors; N=2125 siblings
Survivor-Sibling comparisons
In multivariable regression models restricted to currently employed participants (Table 3), survivors were less likely to hold Professional occupations (RR=0.93, 95% CI 0.89–0.98) and more likely to be employed in Non-Physical occupations (RR=1.15, 95% CI 1.07–1.24) than siblings. Leukemia, CNS tumor, and NHL patients reported fewer Professional positions, while bone cancer patients were more likely than siblings to be working in a Professional occupation (RR=1.12, 95% CI 1.04–1.21). Leukemia patients were more likely (RR=1.26, 95% CI 1.03–1.54) and bone cancer patients less likely (RR=0.37, 95% CI 0.23–0.61) to report Physical occupations. The estimates remained similar when adjusted for full- or part-time employment status and education. Except for neuroblastoma, survivors of all cancer types reported more unemployment compared to siblings.
Table 3.
Relative risk (RR) and 95% confidence intervals (95% CI) of survivors’ occupational status compared to siblings*
| Professional* | Non-Physical* | Physical* | Unemployed† | |||||||||
|---|---|---|---|---|---|---|---|---|---|---|---|---|
| RR | 95% CI | P-value | RR | 95% CI | P- value | RR | 95% CI | P-value | RR | 95% CI | P-value | |
| Siblings (referent) | 1 | 1 | 1 | 1 | ||||||||
| All survivors | 0.93 | 0.89–0.98 | 0.003 | 1.15 | 1.07–1.24 | <0.001 | 0.97 | 0.82–1.16 | 0.75 | 1.45 | 1.32, 1.60 | <0.001 |
| Leukemia | 0.79 | 0.74–0.85 | <0.00l | 1.27 | 1.16–1.40 | <0.001 | 1.26 | 1.03–1.54 | 0.004 | 1.26 | 1.11, 1.41 | <0.001 |
| Central Nervous System | 0.72 | 0.65–0.81 | <0.001 | 1.48 | 1.31–1.67 | <0.001 | 1.04 | 0.77–1.41 | 0.75 | 2.36 | 2.10, 2.66 | <0.001 |
| Hodgkin’s Disease | 1.04 | 0.97–1.11 | 0.28 | 0.99 | 0.87–1.12 | 0.88 | 0.85 | 0.64–1.12 | 0.06 | 1.31 | 1.14, 1.50 | <0.001 |
| Non-Hodgkin Lymphoma | 0.89 | 0.81–0.99 | 0.03 | 1.16 | 1.00–1.33 | 0.05 | 1.01 | 0.75–1.35 | 0.42 | 1.47 | 1.24, 1.73 | <0.001 |
| Wilms tumor | 0.98 | 0.88–1.09 | 0.71 | 1.11 | 0.95–1.30 | 0.17 | 0.84 | 0.57–1.23 | 0.21 | 1.34 | 1.12, 1.59 | <0.001 |
| Neuroblastoma | 0.96 | 0.83–1.09 | 0.50 | 1.10 | 0.91–1.34 | 0.32 | 0.85 | 0.53–1.32 | 0.97 | 1.23 | 0.99, 1.53 | 0.06 |
| Soft tissue sarcoma | 1.03 | 0.95–1.12 | 0.51 | 0.98 | 0.85–1.14 | 0.81 | 0.93 | 0.68–1.28 | 0.67 | 1.27 | 1.08, 1.49 | 0.004 |
| Bone cancer | 1.12 | 1.04–1.21 | 0.003 | 0.97 | 0.84–1.13 | 0.72 | 0.37 | 0.23–0.61 | <0.001 | 1.56 | 1.25, 1.80 | <0.001 |
Regressions compare the occupation of interest to the other two occupational categories among employed participants. The analyses included survivors (N=4836) and siblings (N=1670) who had available occupational and demographic variables (age, race and sex).
The Unemployed regression model compared unemployed to employed participants.
In our multinomial models, we found differences by sex in the proportion unemployed and for part- or full -time employment (Figure 2). Both male and female survivors were more likely to be unemployed (males 17%, females 38%) than siblings (males 9%, females 25%). Twenty-seven percent of female survivors, 42% of male survivors, 41% of female siblings and 50% of male siblings held a full-time Professional occupation.
Figure 2. Predicted probabilities of occupational status for survivors and siblings by sex*.
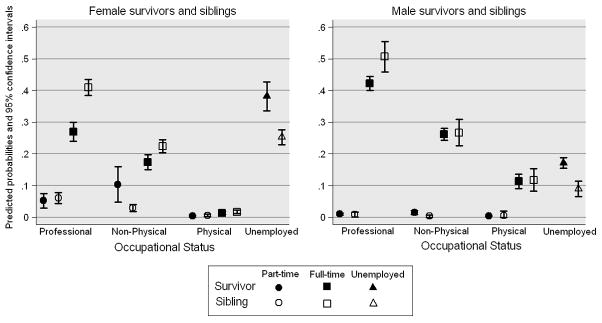
*Survivors (N=6662) and siblings (N=2072); estimates adjusted for current age and race and an interaction for survivor status by sex. Unemployment does not include full or part-time status.
Survivor risk group comparisons
When we limited the analyses to only employed survivors, female survivors were actually more likely to hold Professional (RR=1.13, 95% CI 1.07–1.19) and Non-Physical (RR=1.19, 95% CI 1.10–1.29) occupations than male survivors, and less likely to report Physical occupations (RR=0.19, 95% CI 0.14–0.25) (Table 4). Black survivors were 33% less likely to report Professional occupations, and Black, Hispanic and Other race survivors were 33–36% more likely to be unemployed compared to White survivors. Survivors diagnosed at age ≥5 had an increased odds of Professional and decreased odds of Non-Physical and Physical occupations.
Table 4.
Relative Risk (RR) and 95% confidence intervals (95% CI) of survivors’ occupational status by cancer and treatment-related factors
| Employed (N=4845)* |
Unemployed*,‡ (N=1826) | |||||||||||
|---|---|---|---|---|---|---|---|---|---|---|---|---|
| Professional† (N=2589) | Non-Physical† (N=1787) | Physical† (N=469) | ||||||||||
| RR | 95% CI | P | RR | 95% CI | P | RR | 95% CI | P | RR | 95% CI | P | |
| Current age (years) | ||||||||||||
| 25–34 (ref) | 1 | 1 | 1 | 1 | ||||||||
| 35–44 | 1.00 | 0.91–1.09 | 0.93 | 1.00 | 0.87–1.14 | 0.98 | 1.02 | 0.74–1.40 | 0.90 | 1.04 | 0.90–1.20 | 0.60 |
| 45+ | 0.95 | 0.81–1.11 | 0.52 | 0.98 | 0.76–1.25 | 0.84 | 1.36 | 0.75–2.47 | 0.32 | 0.96 | 0.74–1.26 | 0.79 |
| Sex | ||||||||||||
| Male (ref) | 1 | 1 | 1 | 1 | ||||||||
| Female | 1.13 | 1.07–1.19 | <0.001 | 1.19 | 1.10–1.29 | <0.001 | 0.19 | 0.14–0.25 | <0.001 | 1.93 | 1.76–2.11 | <0.001 |
| Race | ||||||||||||
| White, non-Hispanic (ref) | 1 | 1 | 1 | 1 | ||||||||
| Black, non-Hispanic | 0.67 | 0.51–0.88 | 0.004 | 1.51 | 1.24–1.85 | <0.001 | 0.84 | 0.39–1.82 | 0.66 | 1.36 | 1.09–1.70 | 0.007 |
| Hispanic | 0.98 | 0.83–1.16 | 0.83 | 0.91 | 0.71–1.17 | 0.47 | 1.40 | 0.86–2.28 | 0.18 | 1.33 | 1.09–1.61 | 0.004 |
| Other/mixed | 0.99 | 0.88–1.12 | 0.90 | 1.00 | 0.85–1.18 | 0.96 | 0.95 | 0.65–1.39 | 0.79 | 1.34 | 1.17–1.55 | <0.001 |
| Age at diagnosis | ||||||||||||
| ≤ 4 years (ref) | 1 | 1 | 1 | 1 | ||||||||
| 5–9 years | 1.16 | 1.05–1.27 | 0.003 | 0.92 | 0.82–1.04 | 0.19 | 0.75 | 0.57–0.97 | 0.03 | 0.94 | 0.82–1.07 | 0.34 |
| 10–14 years | 1.31 | 1.18–1.46 | <0.001 | 0.83 | 0.71–0.96 | 0.01 | 0.59 | 0.42–0.83 | 0.002 | 0.88 | 0.75–1.03 | 0.11 |
| ≥15 years | 1.32 | 1.14–1.52 | <0.001 | 0.83 | 0.68–1.01 | 0.07 | 0.49 | 0.32–0.80 | 0.005 | 0.85 | 0.68–1.06 | 0.14 |
| Cranial radiation | ||||||||||||
| None (ref) | 1 | 1 | 1 | 1 | ||||||||
| Scatter low | 1.01 | 0.95–1.08 | 0.66 | 1.00 | 0.90–1.11 | 0.99 | 0.82 | 0.63–1.05 | 0.11 | 0.98 | 0.87–1.11 | 0.79 |
| Scatter high | 1.05 | 0.92–1.20 | 0.48 | 0.85 | 0.65–1.13 | 0.26 | 1.06 | 0.63–1.79 | 0.81 | 0.97 | 0.72–1.31 | 0.85 |
| <18 Gy | 0.88 | 0.78–0.98 | 0.02 | 1.15 | 0.99–1.33 | 0.06 | 1.03 | 0.76–1.41 | 0.87 | 0.91 | 0.76–1.10 | 0.35 |
| 18–24 Gy | 0.71 | 0.64–0.80 | <0.001 | 1.29 | 1.15–1.47 | <0.001 | 1.57 | 1.20–2.05 | 0.001 | 1.00 | 0.85–1.16 | 0.96 |
| 25–34 Gy | 0.73 | 0.57–0.92 | 0.008 | 1.42 | 1.14–1.79 | 0.002 | 0.93 | 0.48–1.82 | 0.84 | 1.04 | 0.76–1.42 | 0.81 |
| ≥35 Gy | 0.78 | 0.67–0.92 | 0.002 | 1.30 | 1.12–1.52 | 0.001 | 0.96 | 0.65–1.41 | 0.84 | 1.61 | 1.39–1.87 | <0.001 |
| Platinum chemotherapy | NA | NA | NA | |||||||||
| No (ref) | 1 | |||||||||||
| Yes | 0.34 | 0.14–0.80 | 0.01 | |||||||||
| CNS tumor resection | NA | |||||||||||
| No (ref) | 1 | 1 | 1 | |||||||||
| Yes | 0.82 | 0.73–0.92 | 0.001 | 1.23 | 1.09–1.40 | 0.001 | 1.29 | 1.12–1.48 | <0.001 | |||
| Amputation | NA | NA | NA | |||||||||
| No (ref) | 1 | |||||||||||
| Yes | 1.30 | 1.09–1.55 | 0.003 | |||||||||
| Limb-sparing | NA | NA | NA | |||||||||
| No (ref) | 1 | |||||||||||
| Yes | 1.40 | 1.00–1.97 | 0.05 | |||||||||
Adjusted for treatment era, which was non-significant in all models.
Regressions compare the occupation of interest to the other two categories. Sample sizes were Professional N=4421, Non-Physical N=4259, and Physical N=4258; these are smaller than 4845 due to missing information on treatment.
The Unemployed regression estimated compared the unemployed survivors to the employed survivors; sample size was N=5985.
Employed survivors with cranial radiation doses ≥18 Gy were between 22%–29% less likely to hold Professional positions than survivors without this treatment, and more likely to be employed in Non-Physical jobs. For Physical occupations and cranial radiation, there was a parabolic effect in that only mid-range doses between 18–24 Gy were significant (RR=1.57, 95% CI 1.20–2.05). Doses of ≥35 Gy were associated with a 1.61 higher risk of unemployment (95% CI 1.39–1.87). CNS tumor resection imparted a decreased odds of Professional (RR=0.82, 95% CI 0.73–0.92) but increased Non-Physical (RR=1.23, 95% CI 1.09–1.40) occupation. Platinum chemotherapy was associated with a decreased likelihood of Physical employment (RR=0.34, 95% CI 0.14–0.80). No other chemotherapy agents or radiation sites were significant. The estimates remained similar when adjusted for education except cranial radiation attenuated.
Personal income
Yearly personal income differed by occupation for survivors and siblings in models adjusted for age, sex, marital status, and full- or part-time employment status (Figure 3). Survivors were more likely than siblings to make less than $20,000 per year and were less likely to report incomes greater than $40,000 per year in each of the occupation categories. The income differences remained similar in magnitude when education was included.
Figure 3. Predicted probabilities yearly personal income by occupation for survivors vs. siblings.
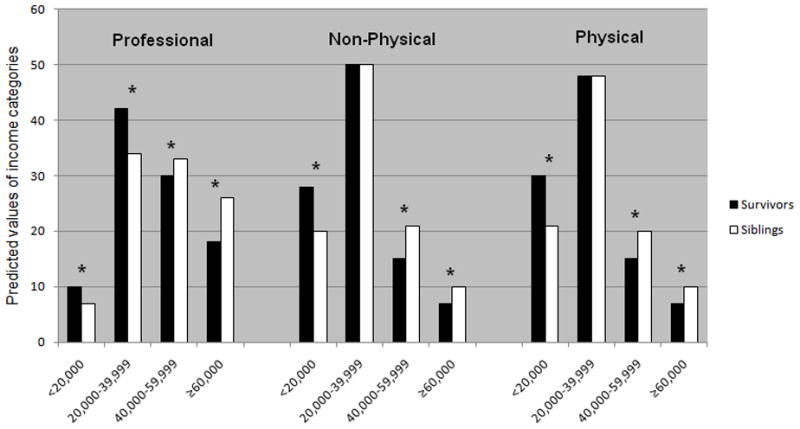
*Income category difference significant at p<0.05; models adjusted for sex, age, race, marital status and full- or part-time employment status
Discussion
Studies of adult CCS have increasingly sought to identify and explain the impact of late effects on their social, economic and demographic outcomes. We found that adult survivors were less likely to be employed in higher-skill occupations when compared to siblings. Survivors, particularly those with a history of CNS tumors and leukemia, reported jobs that were non-physical more often than siblings. Because of the physical late effects from cancer, we hypothesized that CCS would be less likely to report occupations that required high levels of physical activity, but this was only significant for bone cancer survivors.
Our results that suggest survivors are more often employed in lower skill occupations have implications for their economic status throughout their lifetimes. The average yearly income from the 2003 Bureau of Labor Statistics for our Professional/Managerial category was approximately $49,000 (range: $32,400–$70,870) compared to less than $24,000 (range: $15,390–$34,290) for Service/Blue Collar.26 Within occupational categories, personal income was lower for survivors compared to siblings even when adjusted for education. Future studies should examine more detailed assessment of survivors’ career decisions and occupations and the effect on income. There may be work experiences or lifestyle decisions that differ between the survivors and siblings not captured in our categories. Additionally, survivors with chronic health problems may be intermittently employed, affecting their income potential despite working in similar fields as siblings.
Certain cancer and treatment-related factors were linked to occupational differences. CNS tumor resection was associated with decreased Professional employment, and all surgery types were associated with unemployment. Platinum chemotherapy, which was primarily used in the CCSS cohort for osteosarcoma patients, conferred a 66% decreased likelihood of reporting Physical work, although due to the small number in this category, this finding should be interpreted with caution. Conversely, the bone cancer diagnosis group was the only diagnosis group more likely to be working in Professional jobs than siblings. Among CCS, a younger diagnosis age is associated with cognitive impairment and learning disabilities requiring special education7, 11 and an increased risk of specific medical conditions.27 We found as age of diagnosis increased, the likelihood of Professional employment increased, while survivors diagnosed at a younger age were more likely to hold Service/Blue Collar jobs.
Fewer survivors were employed in Professional jobs and more survivors were in Non-Physical jobs with increasing doses of cranial radiation. Mid-range doses (18–25 Gy) were the only cranial radiation dose associated with an increased likelihood of Physical work, suggesting that survivors with a history of higher doses may not be physically able to work in certain occupations. Patients receiving cranial radiation – typically CNS and leukemia patients – often face neurocognitive deficits, including motor skill limitations and decreased abilities in acquiring new skills and information, although the risk decreases with lower doses.5, 6, 28 Not only are these survivors at a higher risk for poor health outcomes and unemployment,8, 18 but if they are working, our findings suggest they may be disproportionately employed in lower skill positions.
Black survivors were less likely to be employed in Professional and more often in Non-Physical occupations than white survivors, while no racial/ethnic differences were found for siblings. Black survivors report similar health status as white survivors when adjusting for socioeconomic status,29 and when we controlled for socioeconomic variables, such as education, our racial and ethnic occupational differences persisted, suggesting that there may be factors beyond health status influencing racial/ethnic employment differences. CCS report difficulties obtaining employment,30 and minority race survivors may face differential discrimination by employers for hiring or providing access to training or career advancement opportunities.
The differences in our results depending on the inclusion of unemployed or only employed survivors demonstrates the necessity in comparing both groups due to the high proportion of unemployed female survivors. In analyses limited to employed survivors, female survivors were more likely than male survivors to be employed in Professional occupations. However, when we considered the proportion unemployed in the denominator, female survivors were less likely to work in these occupations and more likely to be unemployed compared to male survivors and male and female siblings. These results suggest that future studies should investigate how the cancer experience differentially affects career decisions for female survivors, including the decision to work, and whether to work full- or part-time. Coupled with our earlier analyses that found female survivors at an increased risk of health-related unemployment,31 female survivors may particularly vulnerable for poor labor force outcomes.
There are certain limitations with this study. Aggregating occupations may obscure further job skill differences between survivors and siblings. Although there are well-known indicators of occupational status and social class available, such as the Duncan Socioeconomic Index, we hypothesized that occupational groupings tied to potential differences in skills and physical ability would best describe our population and our sensitivity analyses showed the robustness of our classifications. Using cross-sectional occupational information limited our ability to detect further differences if we had been able to summarize years of experience in specific occupations or other longitudinal occupational measures. Also, we did not have information on comorbidities beyond cancer recurrence and secondary cancers, which may impact on CCS occupational outcomes.
Childhood socioeconomic status and parental occupation are predictive of adult employment and occupational status, and were not available in the current study. However, by comparing the survivors to a sibling cohort, we provided some control for childhood socioeconomic status, although not all survivors had a sibling pair (N=1,592 pairs in the full sample). Additionally, 24% of survivors and 19% of siblings have been lost to follow-up or refused participation since baseline; because individuals with lower socicoeconomic status are less likely to participate in health surveys, our estimates of the proportion of survivors in low-skill jobs may be conservative.
CCS are less often employed in higher-skill occupations. Future studies are needed to determine why survivors make specific career decisions, to elucidate what survivors need to be successful in the workplace, and to assess the barriers survivors face in developing their careers. Long-term survivorship programs should offer vocational assistance to CCS from the point of initial treatment throughout their careers, and may need to provide a broad array of services depending on a survivor’ s psychosocial or health status to maximize their occupational potential. High-risk survivors, due to their treatment history or demographic background, may also need additional resource assistance from community vocational or educational services.
Barriers exist to getting occupational services to the neediest survivors. Uninsured CCS may not be able to obtain survivorship services, and, even for insured survivors, occupational rehabilitation services may not be covered. Furthermore, current national policies that encourage workforce participation for individuals with disabilities should be extended to provide those employed in low-skill and entry-level jobs – such as many adult survivors of childhood cancer – opportunities to advance their careers.12 As research continues to acknowledge the social, psychological and financial impacts of childhood cancer, identifying survivors for occupational intervention will help to improve their quality of life.
Acknowledgments
The Childhood Cancer Survivor Study is funded by the National Cancer Institute (U24 CA55727, PI: L.L. Robison). Support to St. Jude Children’s Research Hospital also provided by the Cancer Center Support (CORE) grant (CA 21765) and by the American, Syrian, Lebanese Associated Charities (ALSAC). The authors have no financial support to disclose. The authors would like to thank Debra L. Friedman and Gregory T. Armstrong for their valuable assistance in the development of this project.
References
- 1.Mariotto AB, Rowland JH, Yabroff KR, et al. Long-Term Survivors of Childhood Cancers in the United States. Cancer Epidemiol Biomarkers Prev. 2009 Apr;18(4):1033–1040. doi: 10.1158/1055-9965.EPI-08-0988. [DOI] [PubMed] [Google Scholar]
- 2.Ries LAG, Smith MA, Gurney JG, Linet M, Tamra T, Young JLBG, editors. Institute NC. Cancer incidence and survival among children and adolescents: United States SEER Program 1975–1995. Bethesda, MD: National Institutes of Health; 1999. No. NIH Pub. No. 99–4649. [Google Scholar]
- 3.Ness KK, Hudson MM, Ginsberg JP, et al. Physical Performance Limitations in the Childhood Cancer Survivor Study Cohort. J Clin Oncol. 2009 Mar 30; doi: 10.1200/JCO.2008.21.1482. [DOI] [PMC free article] [PubMed] [Google Scholar]
- 4.Gurney JG, Krull KR, Kadan-Lottick N, et al. Social Outcomes in the Childhood Cancer Survivor Study Cohort. J Clin Oncol. 2009 Feb 17; doi: 10.1200/JCO.2008.21.1458. [DOI] [PMC free article] [PubMed] [Google Scholar]
- 5.Ellenberg L, Liu Q, Gioia G, et al. Neurocognitive status in long-term survivors of childhood CNS malignancies: a report from the Childhood Cancer Survivor Study. Neuropsychology. 2009 Nov;23(6):705–717. doi: 10.1037/a0016674. [DOI] [PMC free article] [PubMed] [Google Scholar]
- 6.Kadan-Lottick NS, Zeltzer LK, Liu Q, et al. Neurocognitive functioning in adult survivors of childhood non-central nervous system cancers. J Natl Cancer Inst. 2010 Jun 16;102(12):881–893. doi: 10.1093/jnci/djq156. [DOI] [PMC free article] [PubMed] [Google Scholar]
- 7.Mitby PA, Robison LL, Whitton JA, et al. Utilization of special education services and educational attainment among long–term survivors of childhood cancer: a report from the Childhood Cancer Survivor Study. Cancer. 2003 Feb 15;97(4):1115–1126. doi: 10.1002/cncr.11117. [DOI] [PubMed] [Google Scholar]
- 8.de Boer AG, Verbeek JH, van Dijk FJ. Adult survivors of childhood cancer and unemployment: A metaanalysis. Cancer. 2006 Jul 1;107(1):1–11. doi: 10.1002/cncr.21974. [DOI] [PubMed] [Google Scholar]
- 9.Crom DB, Lensing SY, Rai SN, Snider MA, Cash DK, Hudson MM. Marriage, employment, and health insurance in adult survivors of childhood cancer. J Cancer Surviv. 2007 Sep;1(3):237–245. doi: 10.1007/s11764-007-0026-x. [DOI] [PubMed] [Google Scholar]
- 10.Park ER, Li FP, Liu Y, et al. Health insurance coverage in survivors of childhood cancer: the Childhood Cancer Survivor Study. J Clin Oncol. 2005 Dec 20;23(36):9187–9197. doi: 10.1200/JCO.2005.01.7418. [DOI] [PubMed] [Google Scholar]
- 11.Barrera M, Shaw AK, Speechley KN, Maunsell E, Pogany L. Educational and social late effects of childhood cancer and related clinical, personal, and familial characteristics. Cancer. 2005 Oct 15;104(8):1751–1760. doi: 10.1002/cncr.21390. [DOI] [PubMed] [Google Scholar]
- 12.Kaye HS. Stuck at the bottom rung: occupational characteristics of workers with disabilities. J Occup Rehabil. 2009 Jun;19(2):115–128. doi: 10.1007/s10926-009-9175-2. [DOI] [PubMed] [Google Scholar]
- 13.Volkers AC, Westert GP, Schellevis FG. Health disparities by occupation, modified by education: a cross-sectional population study. BMC Public Health. 2007;7:196. doi: 10.1186/1471-2458-7-196. [DOI] [PMC free article] [PubMed] [Google Scholar]
- 14.Gregorio DI, Walsh SJ, Paturzo D. The effects of occupation-based social position on mortality in a large American cohort. Am J Public Health. 1997 Sep;87(9):1472–1475. doi: 10.2105/ajph.87.9.1472. [DOI] [PMC free article] [PubMed] [Google Scholar]
- 15.Adler NE, Newman K. Socioeconomic disparities in health: pathways and policies. Health Aff (Millwood) 2002 Mar-Apr;21(2):60–76. doi: 10.1377/hlthaff.21.2.60. [DOI] [PubMed] [Google Scholar]
- 16.U.S. Department of Labor. National Compensation Survey: Employee Benefits in Private Industry in the United States. Mar, 2007. [accessed July 8, 2010]. Available from: http://www.bls.gov/ncs/ebs/sp/ebsm0006.pdf.
- 17.Barr RD, Wunder JS. Bone and soft tissue sarcomas are often curable-But at what cost?: a call to arms (and legs) Cancer. 2009 Sep 15;115(18):4046–4054. doi: 10.1002/cncr.24458. [DOI] [PubMed] [Google Scholar]
- 18.Pang JW, Friedman DL, Whitton JA, et al. Employment status among adult survivors in the Childhood Cancer Survivor Study. Pediatr Blood Cancer. 2007 Jun 6; doi: 10.1002/pbc.21226. [DOI] [PubMed] [Google Scholar]
- 19.Ness KK, Mertens AC, Hudson MM, et al. Limitations on physical performance and daily activities among long-term survivors of childhood cancer. Ann Intern Med. 2005 Nov 1;143(9):639–647. doi: 10.7326/0003-4819-143-9-200511010-00007. [DOI] [PubMed] [Google Scholar]
- 20.Leisenring WM, Mertens AC, Armstrong GT, et al. Pediatric Cancer Survivorship Research: Experience of the Childhood Cancer Survivor Study. J Clin Oncol. 2009 Apr;:13. doi: 10.1200/JCO.2008.21.1813. [DOI] [PMC free article] [PubMed] [Google Scholar]
- 21.Robison LL, Mertens AC, Boice JD, et al. Study design and cohort characteristics of the Childhood Cancer Survivor Study: a multi-institutional collaborative project. Med Pediatr Oncol. 2002 Apr;38(4):229–239. doi: 10.1002/mpo.1316. [DOI] [PubMed] [Google Scholar]
- 22.Robison LL, Armstrong GT, Boice JD, et al. The Childhood Cancer Survivor Study: A National Cancer Institute-Supported Resource for Outcome and Intervention Research. J Clin Oncol. 2009 Apr 13; doi: 10.1200/JCO.2009.22.3339. [DOI] [PMC free article] [PubMed] [Google Scholar]
- 23.Peterson NG, Mumford MD. Understanding work using the Occupational Information Network (O*NET): Implications for practice and research. Personnel Psychology. 2001;54(2):451–492. [Google Scholar]
- 24.Hosmer DW, Lemeshow L. Applied logistic regression. 2. John Wiley and Sons; 2000. [Google Scholar]
- 25.McNutt LA, Wu C, Xue X, Hafner JP. Estimating the relative risk in cohort studies and clinical trials of common outcomes. Am J Epidemiol. 2003 May 15;157(10):940–943. doi: 10.1093/aje/kwg074. [DOI] [PubMed] [Google Scholar]
- 26.Bureau of Labor Statistics. US Department of Labor, Labor Force Characteristics. May 20, 2009. Available from: http://www.bls.gov/cps/lfcharacteristics.htm#laborforce, September 1, 2009.
- 27.Hudson MM, Mulrooney DA, Bowers DC, et al. High-Risk Populations Identified in Childhood Cancer Survival Study Investigations: Implications for Risk-Based Surveillance. J Clin Oncol. 2009 Mar 16; doi: 10.1200/JCO.2008.21.1516. [DOI] [PMC free article] [PubMed] [Google Scholar]
- 28.Packer RJ, Gurney JG, Punyko JA, et al. Long-term neurologic and neurosensory sequelae in adult survivors of a childhood brain tumor: childhood cancer survivor study. J Clin Oncol. 2003 Sep 1;21(17):3255–3261. doi: 10.1200/JCO.2003.01.202. [DOI] [PubMed] [Google Scholar]
- 29.Castellino SM, Casillas J, Hudson MM, et al. Minority adult survivors of childhood cancer: a comparison of long-term outcomes, health care utilization, and health-related behaviors from the childhood cancer survivor study. J Clin Oncol. 2005 Sep 20;23(27):6499–6507. doi: 10.1200/JCO.2005.11.098. [DOI] [PubMed] [Google Scholar]
- 30.Langeveld NE, Stam H, Grootenhuis MA, Last BF. Quality of life in young adult survivors of childhood cancer. Support Care Cancer. 2002 Nov;10(8):579–600. doi: 10.1007/s00520-002-0388-6. [DOI] [PubMed] [Google Scholar]
- 31.Kirchhoff AC, Leisenring W, Krull KR, et al. Unemployment Among Adult Survivors of Childhood Cancer: A Report From the Childhood Cancer Survivor Study. Med Care. 2010 Oct 11; doi: 10.1097/MLR.0b013e3181eaf880. [DOI] [PMC free article] [PubMed] [Google Scholar]