Synthetic methods have been developed for producing a wide variety of nanostructures that differ in size, shape, and composition. Indeed, methods now exist for preparing nonspherical, monodisperse samples of Au and Ag triangular prisms,[1–5] cubes,[6, 7] wires,[8] bars,[9] tetrahedra,[7, 10] octahedra,[11] decahedra,[12, 13] bipyramids,[14] and disks.[15] Synthetic control over particle shape allows one to chemically tailor the optical, electric, magnetic, and catalytic properties of such structures, making them useful for many applications, including biological diagnostics,[16] therapeutics,[17, 18] catalysis,[19, 20] and optics.[21, 22]
One of the most controllable synthetic methods for making anisotropic nanostructures involves the photochemical conversion of Ag spheres into triangular prisms.[1] With this synthetic method, the growth of the silver nanoprisms can be modulated through a combination of photoexcitation and pH control,[2, 23] and the resulting edge length of the nanoprisms can be controlled by excitation wavelength. Essentially the prisms grow via a photo-mediated process until their plasmon resonances are red-shifted from the excitation wavelength. This method has been widely used to synthesize silver nanoprisms and other related structures (e.g. nanodisks or truncated prisms).[24–27] In addition, there is recent evidence that one can realize even more exotic structures such as decahedra[13] and tetrahedra[10] through plasmon-mediated syntheses, although wavelength driven size control has not been demonstrated with these particle shapes.
Conceptually, the use of plasmon excitation to direct nanostructure growth has significant advantages over thermal methods. The photogeneration of triangular silver prisms is an excellent example of the utility of such methods, enabling the facile generation of equilateral triangular prisms with a fixed thickness and an edge length which is tunable over the 40 to 120 nm range simply through choice of excitation wavelength and pH.[2, 23] However this system is the only example to date where excitation wavelength driven particle size control has been demonstrated. This raises questions about the generality of plasmon-mediated particle growth and its suitability for generating different particle shapes with similar size control advantages.
Herein, we report the discovery of a new plasmon-mediated particle growth method, which results in the formation of right triangular bipyramids (Scheme 1). Silver right triangular bipyramids are structurally related to triangular prisms[28] and consist of two right tetrahedra symmetrically joined base-to-base (Scheme 1A). Their sharp vertices are particularly promising for applications related to surface-enhanced Raman scattering (SERS)[29] and plasmonics[30] in general. Significantly, the excitation wavelength in this system can be used to control the dimensions of the two right pyramids forming each particle. Although triangular silver bipyramids have previously been synthesized by a thermal polyol synthesis, which yielded 80% bipyramids and 20% cubes,[28] methods for forming them in monodisperse form have yet to be developed. The photochemical route described herein allows one to prepare monodisperse samples of such structures (> 95% shape selectivity) with a less than 9% variation in edge length. Theoretical calculations have been used to assign the different plasmon excitation bands from the extinction spectra of the bipyramids, and the excellent correlation between experimentally measured UV-vis spectra and calculated spectra confirm the monodispersity of the product.
Scheme 1.
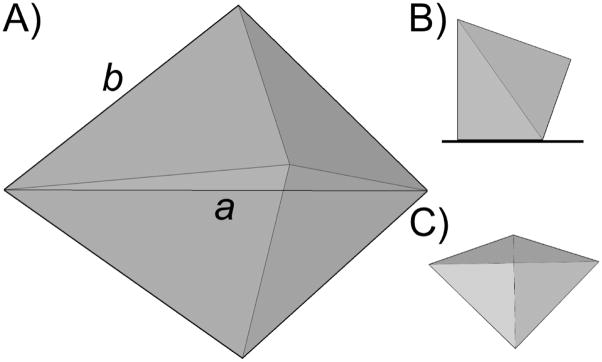
Schematic of a right triangular bipyramid: A) Perspective view; B) Side view and C) top view when the right pyramid is placed on a planar substrate.
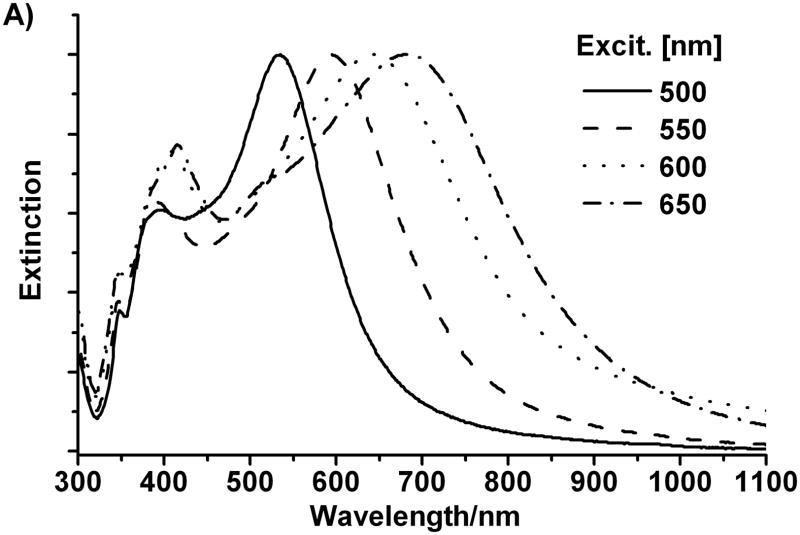
A typical photoinduced synthesis was carried out by irradiating an aqueous solution of 0.3 mM AgNO3, 1.5 mM sodium citrate, 0.3 mM Bis(p-sulfonatophenyl) phenylphosphine dihydrate dipotassium salt (BSPP), and 0.005 M NaOH (see Experimental Section for details) for 8 h using a 150-W halogen lamp and a bandpass filter. The optical bandpass filter allows for control over the desired excitation wavelength range (500±20, 550±20, 600±20, 650±20 nm). After 30 minutes, the reaction solution turned from colorless to light yellow. With continued irradiation (1 h), the color of the solution continued to change, with the final solution color obtained depending upon the excitation wavelength used (Figure 1). For example, when the solution was irradiated with 500±20 nm light, a red solution was obtained with a UV-vis band at λmax=535 nm. Similarly, if the solution was irradiated with 550±20 nm light, a blue solution was obtained with a UV-vis band centered at λmax=590 nm.
Figure 1.
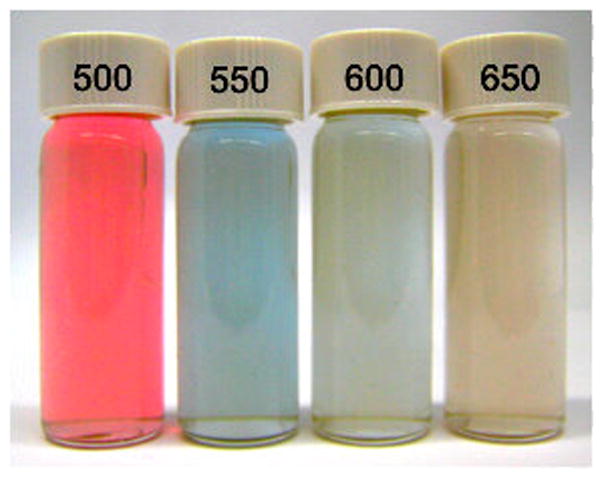
Photographs of the aqueous solutions of silver right triangular bipyramids prepared with excitation at 500±20, 550±20, 600±20, and 650±20 nm respectively.
SEM images (Figure 2) of the nanoparticles show that they are highly monodisperse right triangular bipyramids. Note that the bipyramid is a three dimensional object, with one of its six isosceles facets sitting on the substrate (Scheme 1C). Only two dimensional projections of such structures can be observed by SEM and TEM, and therefore the triangular bipyramids appear as irregular tetragons or triangles.[31, 32] Each structure has six right isosceles triangular faces with an equilateral triangle as a base (Scheme 1A). There are two different edge lengths associated with the bipyramids, denoted as edge lengths a and b, where . For the sample produced with a band pass filter centered at 550 nm, a and b were determined to be 131±12 nm and 93±9 nm, respectively, from SEM images. The ratio between these two edge lengths (1.41) is consistent with the expected value . Overall, there are five vertices in one bipyramid. Three vertices in the plane of the equilateral triangular base are defined as longitudinal vertices, and the other two vertices are defined as transverse vertices. SEM images indicate that the vertices of the right bipyramids are slightly truncated (inset in Figure 2B). For example, for bipyramids made from irradiation at 550 nm, the truncation of the three longitudinal and two transverse vertices are 20±5 nm and 30±7 nm, respectively. Truncation here determined by measuring the edge length of the triangle that forms as a consequence of the missing tip; with a perfect bipyramid, this triangle would be a point. The degree of truncation significantly affects the surface plasmon resonance of these metallic nanoparticles (vide infra).
Figure 2.
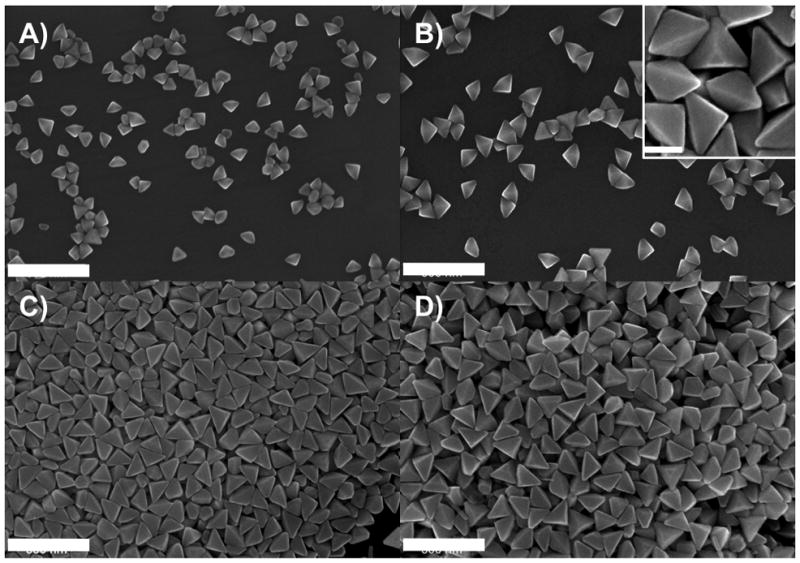
A–D) SEM images of the triangular bipyramids (scale bar 300 nm) generated with the band pass filter centered at 500±20 550±20, 600±20, and 650±20 nm respectively. (Inset of B: a higher magnification view, scale bar 100 nm).
The particle dimensions are highly tailorable through choice of excitation wavelength with 500±20, 550±20, 600±20, and 650±20 nm band pass filters yielding monodisperse samples of bipyramids with edge lengths (a) of 106±9, 131±12, 165±12, and 191±8 nm, respectively (Figure 2, see Figure S1 for histograms). In general, the edge lengths of the right bipyramids increase as the excitation wavelength increases over this wavelength range.
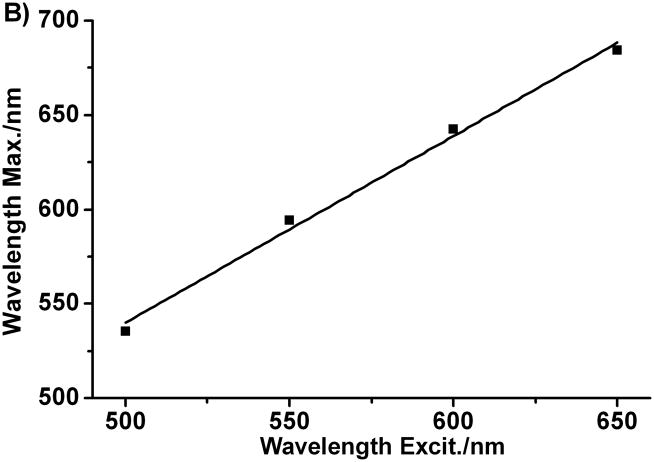
We also measured the ultraviolet-visible-near-infrared (UV-vis-NIR) spectra of the colloidal suspensions of particles formed from this photomediated method (Figure 3A). The UV-vis-NIR spectra of the colloidal suspensions of each of the four different sized bipyramids, exhibit three distinct bands. Two are centered around 355 and 400 nm, and they are similar in all four spectra. The third band is at longer wavelength (ranging from 530 nm to 730 nm) and is highly dependent upon the size of the bipyramids. In general, as the particle increases in size, this band red shifts and is at slightly longer wavelength than the excitation source. There is an excellent linear correlation between excitation wavelength and the surface plasmon resonance maximum for the bipyramids (Figure 3B). This result strongly indicates that the formation of the triangular bipyramids is a plasmon-mediated process. These results are significant because they not only provide a simple method to precisely control the edge length of silver bipyramids, but also indicate that the surface plasmon resonance can indeed be utilized as a tool to control nanoparticle size and shape in structures other than triangular prisms.[1, 2]
Figure 3.
A) Normalized extinction spectra of the aqueous suspensions of silver right triangular bipyramid prepared with excitation at 500±20, 550±20, 600±20, and 650±20 nm respectively. B) Plot of extinction maximum of different bipyramids vs. different excitation wavelength.
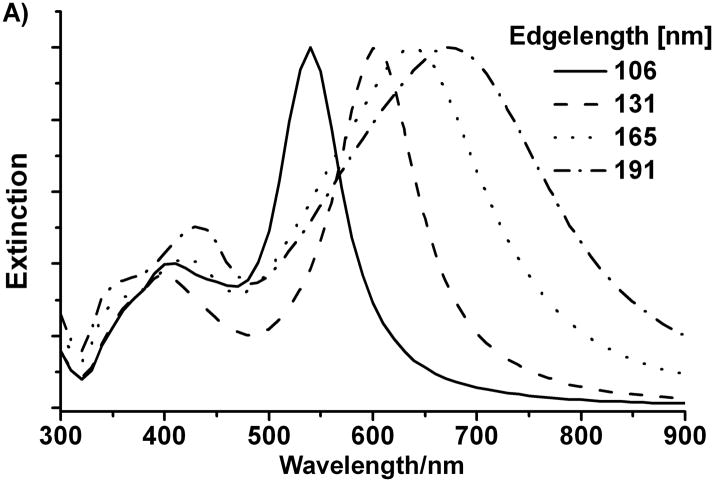
The optical properties of the triangular bipyramids, including light absorption and scattering, as well as surface-enhanced Raman spectroscopy, should be influenced by their structural anisotropy, which is significantly different from both small spherical nanoparticles and triangular nanoprisms. As predicted by Mie theory, the larger particles can exhibit multiple surface plasmon bands, including dipole, quadrupole and higher multipole plasmon modes, with the dipole band being farthest red. To characterize and understand the spectra shown in Figure 3, we calculated extinction spectra using the discrete dipole approximation (DDA) method.[33] The DDA method, which numerically solves Maxwell’s equations for particles with arbitrary shapes, has been previously applied to various nanoparticles.[34] The edge length of the bipyramids and the tip truncation length are measured based on average structures found in the SEM images. The extinction spectra from the DDA calculations are plotted in Figure 4A for the bipyramids with the edge a taken to be 106, 131, 165, and 191 nm, respectively. The excellent agreement between experiment and calculation provides additional evidence of the high monodispersity of the bipyramids. Slight broadening of the bands in the experimental spectra can be attributed to the edge length distribution (4 to 9%) of the bipyramids.
Figure 4.
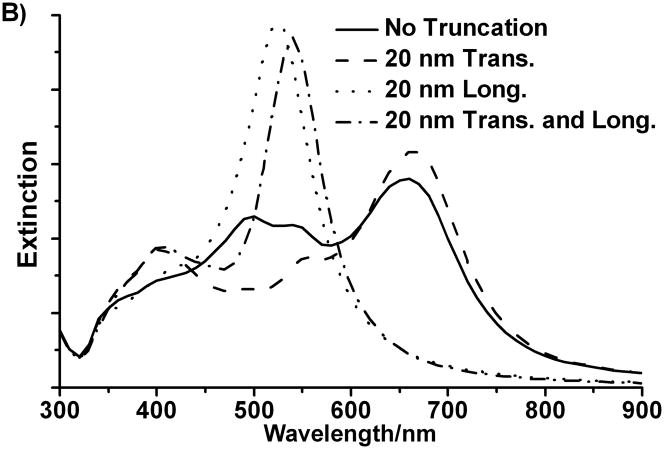
A). Normalized DDA simulations of the orientation averaged UV-vis-NIR spectra of right triangular bipyramids with four different edge lengths in water; B). DDA simulations of the orientation averaged extinction efficiency spectra of right triangular bipyramid with different truncation.
To identify the important features in the extinction spectra of the bipyramids and to assign different bands, we studied the effect of tip truncation by comparing the calculated extinction spectra for a perfect right bipyramid with those bipyramids with truncation. Based on a calculation for a perfect triangular bipyramid with an edge length a of 106 nm, the spectrum of the perfect bipyramid is significantly different from that of the truncated bipyramid (Figure 4B). When only the two transverse tips are truncated, the band around 500 nm blue shifts to 400 nm and there is almost no change for the band at 670 nm. When the other three longitudinal tips are truncated, the 670 nm band blue-shifts to 525 nm. When all five tips of the bipyramid are truncated, both bands blue-shift, and the resulting spectra match well with the experimental one. From this, we demonstrate that the calculated spectra shown above are an overall effect of the tip truncation on both longitudinal and transverse orientation. This also indicates the band around 400 nm and 530 nm in the measured spectrum can be attributed to the transverse and longitudinal plasmon resonance modes of the bipyramid respectively.
We then performed experiments to gain insight into the structure and the mechanistic basis for bipyramid formation. First, TEM was used to investigate how reaction time affected the structure of the resulting nanoparticles. Three distinct stages of growth have been identified (Figure 5). Within one hour of irradiation, spherical silver nanocrystals form (Figure 5A). During the second stage, the spherical nanocrystals enlarge and some small triangular bipyramids appear, which are confirmed by the TEM images taken after 2 hours (Figure 5B). In the last stage, small bipyramids grow into the final bipyramids (Figure 5C).
Figure 5.
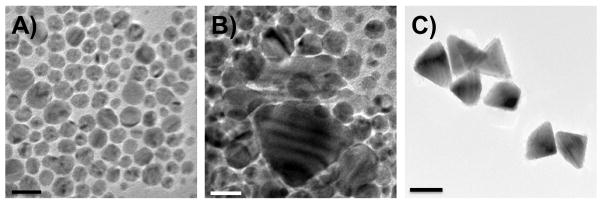
TEM images of samples taken by stopping the reaction after 1 hour (5A, scale bar 20 nm), 2 hours (5B, scale bar 20 nm), and 8 hours (5C, scale bar 100 nm).
For silver nanoprisms, planar stacking faults (SF) and twin planes have been identified, so it is important to consider their role in nanoprism formation. We investigated the silver nanocrystals formed at different stages in the bipyramid synthesis by using high-resolution electron microscopy (HREM). For noble metal face-centered-cubic structures, the twin planes and stacking defaults usually are found on the {111} planes. The best orientation for one to visualize these defects is along the <110> zone axis when the {111} planes are edge on. At this orientation, one {100} and two {111} planes are aligned with the electron beam, which is perpendicular to the {110} plane. Figure 6A is a schematic representation of the atoms in a crystal in this orientation, showing one twin plane and two SFs. The {110} plane of the crystal is within the plane of the scheme, and the two {111} planes and one {100} plane can be identified; the spacing for {111} planes and {100} planes are 2.4 Å and 2.0 Å, respectively. We studied the crystal structure of the seeds by stopping the photoinduced reaction after one hour of irradiation, and the intermediate bipyramids by stopping the reaction after two hours of irradiation. For the sample taken 1 hour into the reaction, nanoparticles with twinned planes (mainly multiple planar twinned defects) can be found readily (Figure 6B and Figure S2). In the particular crystal shown in Figure 6B, there are five twin planes and two stacking faults. The spacings are consistent with the expected values. Figure 6C shows an HREM image of an intermediate small bipyramid, whose orientation is a little bit away from the <110> zone axis. In the image, the fringes for the {111} planes can still be seen, which have 2.4 Å spacing; one twin and four stacking fault interfaces can be identified.
Figure 6.
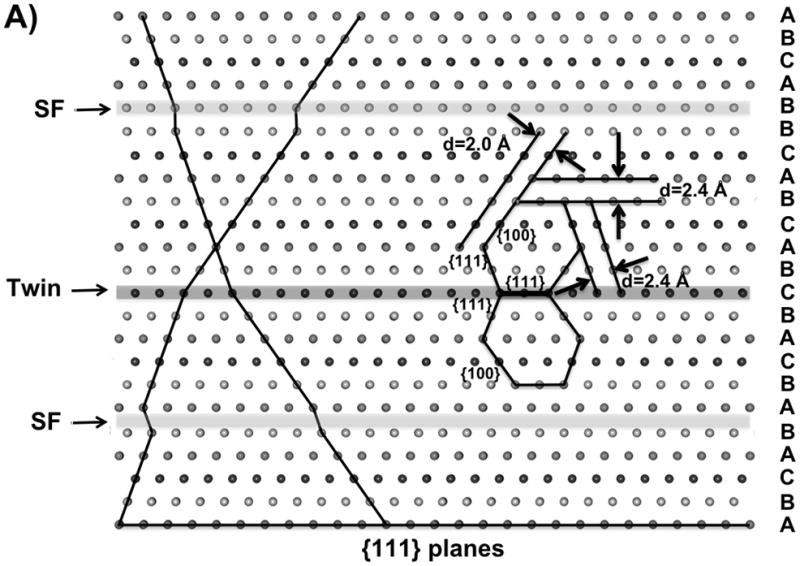
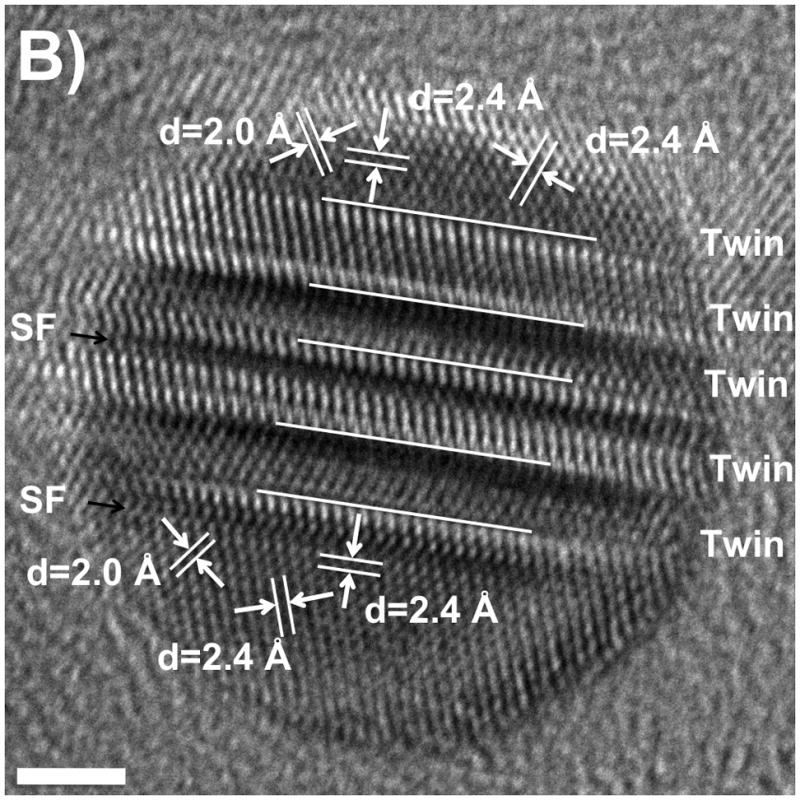
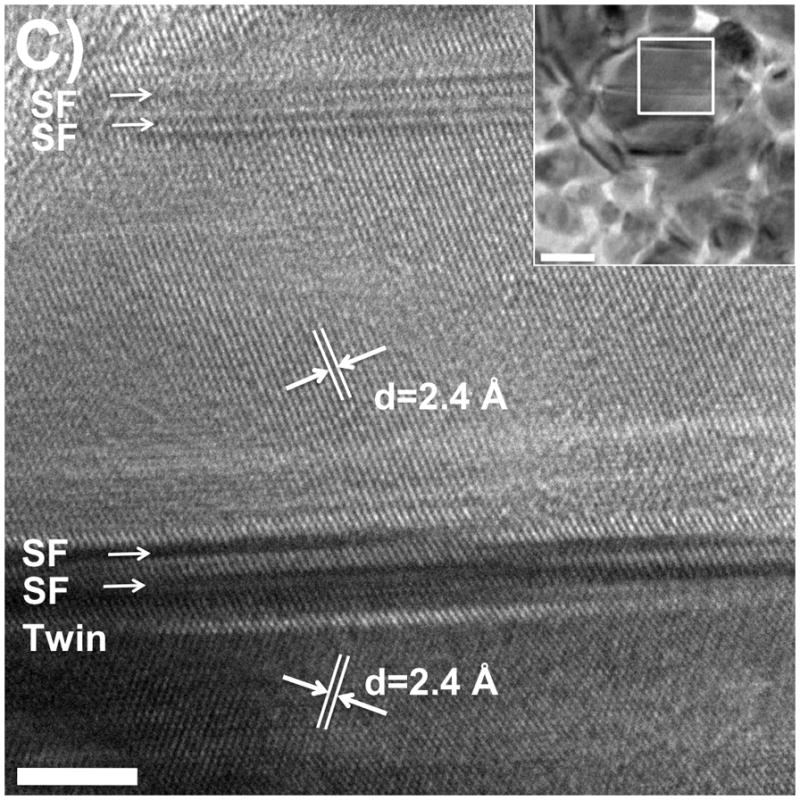
A). Schematic of a fcc crystal with a twin plane (Twin) and stacking faults (SF) along the {111} planes. B and C). High-resolution TEM images of a seed (6B, scale bar 2 nm) and a small bipyramid (6C, scale bar 4 nm; inset: zoom out view of this bipyramid, scale bar, 20 nm) showing multiple planar twinned planes along with stacking faults when the reaction was stopped after one hour and two hours, respectively (excitation wavelength 550±20 nm).
To confirm that the twinned nature of the bipyramid is preserved throughout the reaction, we examined the final product for twinned planes. HREM is not a suitable method for large bipyramid structures. Instead, we used electron diffraction experiments to identify the twinned structure. A series of tilted selected area electron diffraction (SAED) patterns were collected by tilting one bipyramid inside an electron microscope (Hitachi H-8100). With the double tilt holder, we changed the relative orientation between incident electron beam and the crystal. As shown in Figure 7A, initially the crystal was tilted along the [100] zone axis, which was used as the zero point. For a single face-centered cubic crystal, the smallest angle between <100> and <111> zone axes is 54.74°. When the crystal was tilted off the [100] zone by 15.5°, we obtained diffraction patterns which can be indexed as [111] zone axes (Figure 7B). This implies that the bipyramid is a twinned crystal. Along with the diffraction patterns, TEM images were also collected for each orientation as shown in Figure 7D–7F.
Figure 7.
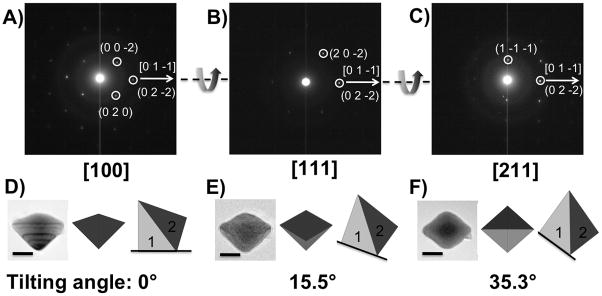
A–C): Tilted SAED pattern of a single bipyramid at different incident angle between the electron beam and the crystal by tilting along the [0 1 −1] direction. D–F): Tilted TEM images (scale bar 50 nm) and schematic illustrations of the top view and side view of the bipyramid at different incident angles.
Based on the tilted diffraction patterns and images, a model of the triangular bipyramid is proposed: the entire crystal is bisected by twinned (111) plane(s); the two twinning halves are denoted as 1 and 2 in Figure 7. At an angle of 0°, the observed diffraction is dominantly part 1, since most lattice planes in part 1 satisfy the Bragg diffraction condition at this angle. At angle 15.5°, part 2 becomes the main contributor to the diffraction. However, when tilted to 35.3°, both twins are along the [211] zone axis. The experimental tilting angle between [100] and [211] zone axis of crystal 1 is 35.3°, and that between [211] and [111] zone axis of crystal 2 is 19.8°. Both are very close to the theoretical values, 35.26° and 19.47° respectively.
The results from HREM and electron diffraction experiments unambiguously show the twinned structure of both the seeds and the final products in bipyramid synthesis. To form bipyramids, the bisecting layer of the crystal must have an odd number of twin planes, as this is the only way for a single crystal to evolve two halves with mirror symmetry, bisected by the mirror plane. Although stacking faults occur throughout the entire crystal, they do not affect the propagation direction of the crystal. More recently, right silver bipyramids were also observed as one of the products from the thermal overgrowth of silver platelets; the bipyramid structure was also attributed to multiple planar twinned defects in the platelet seeds.[35]
In conclusion, we have reported a high yielding, photoinduced synthesis for right triangular silver bipyramid nanoparticles. By adjusting the excitation wavelength, the edge lengths of the resulting bipyramids can be controlled with remarkable precision. This second example of plasmon-mediated shape control points to the generality of the approach for realizing monodisperse samples of nanostructures with unusual shapes and corresponding chemical and physical properties. The detailed mechanism underlying this extraordinary transformation is likely related to the one for forming triangular prisms.[24] A more systematic analysis of the factors that control bipyramid formation is underway.
Experimental Section
Synthesis of silver right triangular bipyramids: NanoPure™ water (18.5 mL), AgNO3 (0.6 mL, 10 mM), BSPP (0.6 mL, 10 mM), sodium citrate (0.3 mL, 0.1 M) were mixed in a 24 mL vial. Then NaOH (1 mL, 0.1 M) was added into this mixture. The resulting solution was irradiated with a 150-W halogen lamp coupled with an optical band pass filter (500±20, 550±20, and 600±20 nm). For the synthesis with a filter of 650±20 nm, the sample was first irradiated under 600±20 nm for one hour, and then switched to 650±20 nm for the rest of the synthesis. The distance between the lamp and filter was kept at 2 cm. The intensity of the lamp was varied from 0.3 W to 0.5 W, measured by an optical power meter (Newport 1916-C) coupled with a thermopile detector (818P-010-12) with an active diameter of 12 mm.
All DDA calculations were carried out by DDSCAT7.0.[36] The grid spacing was 1 nm, and the refractive index of the medium was 1.331. The extinction spectra are orientation-averaged. For right bipyramids of 106, 131, 165, and 191 nm, the two transverse truncations are 20, 30, 0, and 0 nm, and the three longitudinal truncations are 20, 20, 20, and 25 nm, respectively.
Supplementary Material
Footnotes
C.A.M. acknowledges support from NSF, MRSEC, and NSSEF. C.A.M is also grateful for an NIH Director’s Pioneer Award. G.C.S acknowledges MRSEC, NSF-DMR, and AFOSR/DARPA for support.
Supporting information for this article is available on the WWW under http://www.angewandte.org or from the author.
Contributor Information
Jian Zhang, Department of Chemistry and International Institute for Nanotechnology, Northwestern University, 2145 Sheridan Road, Evanston, IL 60208-3113 (USA).
Shuzhou Li, Department of Chemistry and International Institute for Nanotechnology, Northwestern University, 2145 Sheridan Road, Evanston, IL 60208-3113 (USA).
Jinsong Wu, Department of Materials Science and Engineering, Northwestern University, 2145 Sheridan Road, Evanston, IL 60208-3108 (USA).
Prof. George C. Schatz, Department of Chemistry and International Institute for Nanotechnology, Northwestern University, 2145 Sheridan Road, Evanston, IL 60208-3113 (USA).
Prof. Chad A. Mirkin, Department of Chemistry and International Institute for Nanotechnology, Northwestern University, 2145 Sheridan Road, Evanston, IL 60208-3113 (USA).
References
- 1.Jin RC, Cao YW, Mirkin CA, Kelly KL, Schatz GC, Zheng JG. Science. 2001;294:1901. doi: 10.1126/science.1066541. [DOI] [PubMed] [Google Scholar]
- 2.Jin RC, Cao YC, Hao EC, Metraux GS, Schatz GC, Mirkin CA. Nature. 2003;425:487. doi: 10.1038/nature02020. [DOI] [PubMed] [Google Scholar]
- 3.Metraux GS, Mirkin CA. Adv Mater. 2005;17:412. [Google Scholar]
- 4.Millstone JE, Metraux GS, Mirkin CA. Adv Funct Mater. 2006;16:1209. [Google Scholar]
- 5.Bastys V, Pastoriza-Santos I, Rodriguez-Gonzalez B, Vaisnoras R, Liz-Marzan LM. Adv Funct Mater. 2006;16:766. [Google Scholar]
- 6.Sun YG, Xia YN. Science. 2002;298:2176. doi: 10.1126/science.1077229. [DOI] [PubMed] [Google Scholar]
- 7.Kim F, Connor S, Song H, Kuykendall T, Yang PD. Angew Chem, Int Ed. 2004;43:3673. doi: 10.1002/anie.200454216. [DOI] [PubMed] [Google Scholar]
- 8.Sun YG, Gates B, Mayers B, Xia YN. Nano Lett. 2002;2:165. [Google Scholar]
- 9.Wiley BJ, Chen YC, McLellan JM, Xiong YJ, Li ZY, Ginger D, Xia YN. Nano Lett. 2007;7:1032. doi: 10.1021/nl070214f. [DOI] [PubMed] [Google Scholar]
- 10.Zhou J, An J, Tang B, Xu SP, Cao YX, Zhao B, Xu WQ, Chang JJ, Lombardi JR. Langmuir. 2008;24:10407. doi: 10.1021/la800961j. [DOI] [PubMed] [Google Scholar]
- 11.Seo D, Park JC, Song H. J Am Chem Soc. 2006;128:14863. doi: 10.1021/ja062892u. [DOI] [PubMed] [Google Scholar]
- 12.Seo D, Il Yoo C, Chung IS, Park SM, Ryu S, Song H. J Phys Chem C. 2008;112:2469. [Google Scholar]
- 13.Pietrobon B, Kitaev V. Chem Mater. 2008;20:5186. [Google Scholar]
- 14.Liu MZ, Guyot-Sionnest P. J Phys Chem B. 2005;109:22192. doi: 10.1021/jp054808n. [DOI] [PubMed] [Google Scholar]
- 15.Hao EC, Kelly KL, Hupp JT, Schatz GC. J Am Chem Soc. 2002;124:15182. doi: 10.1021/ja028336r. [DOI] [PubMed] [Google Scholar]
- 16.Rosi NL, Mirkin CA. Chem Rev. 2005;105:1547. doi: 10.1021/cr030067f. [DOI] [PubMed] [Google Scholar]
- 17.Rosi NL, Giljohann DA, Thaxton CS, Lytton-Jean AKR, Han MS, Mirkin CA. Science. 2006;312:1027. doi: 10.1126/science.1125559. [DOI] [PubMed] [Google Scholar]
- 18.Thaxton CS, Daniel WL, Giljohann DA, Thomas AD, Mirkin CA. J Am Chem Soc. 2009;131:1384. doi: 10.1021/ja808856z. [DOI] [PMC free article] [PubMed] [Google Scholar]
- 19.Daniel MC, Astruc D. Chem Rev. 2004;104:293. doi: 10.1021/cr030698+. [DOI] [PubMed] [Google Scholar]
- 20.Burda C, Chen XB, Narayanan R, El-Sayed MA. Chem Rev. 2005;105:1025. doi: 10.1021/cr030063a. [DOI] [PubMed] [Google Scholar]
- 21.Lal S, Link S, Halas NJ. Nat Photonics. 2007;1:641. [Google Scholar]
- 22.Eustis S, El-Sayed MA. Chem Soc Rev. 2006;35:209. doi: 10.1039/b514191e. [DOI] [PubMed] [Google Scholar]
- 23.Xue C, Mirkin CA. Angew Chem, Int Ed. 2007;46:2036. doi: 10.1002/anie.200604637. [DOI] [PubMed] [Google Scholar]
- 24.Xue C, Metraux GS, Millstone JE, Mirkin CA. J Am Chem Soc. 2008;130:8337. doi: 10.1021/ja8005258. [DOI] [PMC free article] [PubMed] [Google Scholar]
- 25.Rocha TCR, Winnischofer H, Westphal E, Zanchet D. J Phys Chem C. 2007;111:2885. [Google Scholar]
- 26.Zheng XL, Xu WQ, Corredor C, Xu SP, An J, Zhao B, Lombardi JR. J Phys Chem C. 2007;111:14962. [Google Scholar]
- 27.Wu XM, Redmond PL, Liu HT, Chen YH, Steigerwald M, Brus L. J Am Chem Soc. 2008;130:9500. doi: 10.1021/ja8018669. [DOI] [PubMed] [Google Scholar]
- 28.Wiley BJ, Xiong YJ, Li ZY, Yin YD, Xia YA. Nano Lett. 2006;6:765. doi: 10.1021/nl060069q. [DOI] [PubMed] [Google Scholar]
- 29.Nie SM, Emery SR. Science. 1997;275:1102. doi: 10.1126/science.275.5303.1102. [DOI] [PubMed] [Google Scholar]
- 30.Ozbay E. Science. 2006;311:189. doi: 10.1126/science.1114849. [DOI] [PubMed] [Google Scholar]
- 31.Wiley B, Sun YG, Chen JY, Cang H, Li ZY, Li XD, Xia YN. MRS Bull. 2005;30:356. doi: 10.1364/ol.30.003048. [DOI] [PubMed] [Google Scholar]
- 32.Yu DB, Yam VWW. J Phys Chem B. 2005;109:5497. doi: 10.1021/jp0448346. [DOI] [PubMed] [Google Scholar]
- 33.Yang WH, Schatz GC, Vanduyne RP. J Chem Phys. 1995;103:869. [Google Scholar]
- 34.Zhao J, Pinchuk AO, McMahon JM, Li S, Ausman LK, Atkinson AL, Schatz GC. Acc Chem Res. 2008;41:1710. doi: 10.1021/ar800028j. [DOI] [PubMed] [Google Scholar]
- 35.McEachran M, Kitaev V. Chem Commun. 2008:5737. doi: 10.1039/b813519c. [DOI] [PubMed] [Google Scholar]
- 36.Draine BT, Flatau PJ. User Guide to the Discrete Dipole Approximation Code DDSCAT 7.0.arXiv.org. [Google Scholar]
Associated Data
This section collects any data citations, data availability statements, or supplementary materials included in this article.


