

Abstract
The dopamine transporter (DAT) facilitates the regulation of synaptic neurotransmitter levels. As a target for therapeutic and illicit psycho-stimulant drugs like antidepressants and cocaine, DAT has been studied intensively. Despite a wealth of mutational and physiological data regarding DAT, the structure remains unsolved and details of the transport mechanism, binding sites and conformational changes remain debated. A bacterial homologue of DAT, the leucine transporter (LeuTAa) has been used as a template and framework for modeling and understanding DAT. Free energy profiles obtained from Multi-Configuration Thermodynamic Integration allowed us to correctly identify the primary and secondary binding pockets of LeuTAa. A comparison of free energy profiles for dopamine and cocaine in DAT suggests that the binding site of cocaine is located in a secondary pocket, not the primary substrate site. Two recurring primary pathways for intracellular substrate release from the primary pocket are identified in both transporters using the Random Acceleration Molecular Dynamics method. One pathway appears to follow transmembranes (TMs) 1a and 6b while the other pathway follows along TMs 6b and 8. Interestingly, we observe that a single sodium ion is co-transported with leucine during both simulations types.
Keywords: Neurotransmitter, transporter, DAT, LeuT, leucine, dopamine, amphetamine, cocaine, molecular dynamics, MCTI, RAMD
1. Introduction
Neurotransmitter transporters such as the monoamine transporters (MATs) facilitate the regulation of synaptic neurotransmitter levels. These integral membrane proteins which include the dopamine (DAT), serotonin (SERT) and norepinephrine (NET) transporters shuttle their respective neurotransmitter molecules from the synaptic cleft for reuse or destruction into the presynaptic nerve. Dysregulation of the monoamine transporters can have devastating effects on motor function, memory and mood. Diseases and disorders such as: depression, obsessive-compulsive disorder (OCD), epilepsy, autism, attention-deficit hyperactivity disorder (ADHD), Parkinson's and Alzheimer's diseases are associated with the dysfunction of the MATs.1–5 Additionally, the MATs are targets for the therapeutic drugs used to treat these diseases and disorders, in addition to illicit drugs such as cocaine and amphetamine.6 In DAT, it is believed that cocaine blocks the re-uptake of dopamine from the synaptic cleft, thereby allowing dopamine neurotransmitters to accumulate in the nucleus accumbens, the “pleasure center” of the brain.7
DAT (SLC6A3), NET (SLC6A2) and SERT (SLC6A4) belong to the solute carrier 6 (SLC6) gene family.8–10 The membrane-bound MATs are also classified as neurotransmitter:sodium symporters (NSS) which rely on the naturally occurring neuronal Na+ gradient to drive the transport of substrates against their concentration gradient.11 Despite a lack of three-dimensional crystallographic data for the MATs, they are believed to contain 12 transmembrane (TM) helices. In 2005, Yamashita et al.12 published the crystal structure of bacterial MAT homologue, the leucine transporter (LeuTAa). LeuTAa exhibits 20-25% sequence identity and 40-45% sequence similarity to the MATs.13 Despite a relatively low sequence identity, the disparities in the sequences of MATs and LeuTAa are mainly located in the loop regions, while the binding regions display the highest degrees of sequence identity and similarity.14 Identical and similar residues of LeuTAa and DAT are highlighted in Figure 1.
Figure 1.
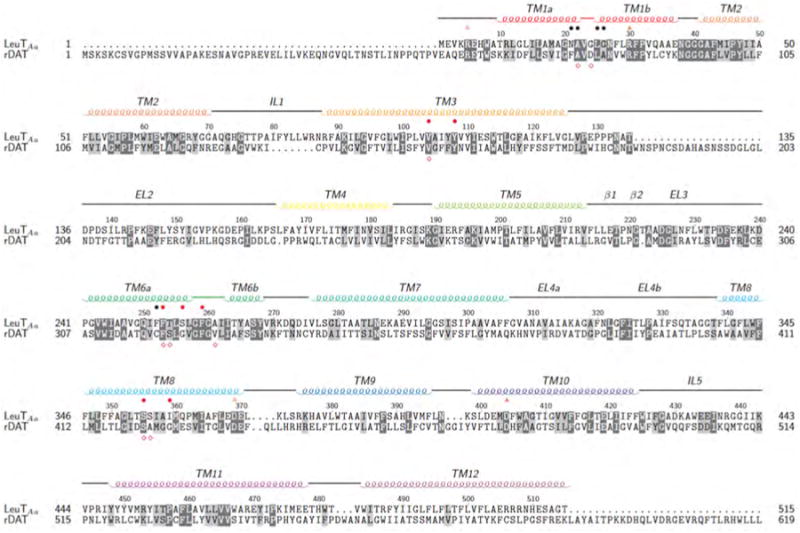
Conserved residues are highlighted in dark grey while similar residues are highlighted in light grey. Above the sequences, orange open triangles indicate the intracellular gates and orange filled triangles indicate the extracellular gates. Residues comprising the primary substrate site (S1) of LeuTAa are marked with black bullets while red bullets indicate interacting residues of the S1 site of LeuTAa.12 Below the sequence, red diamonds indicate residues involved in dopamine binding of DAT.15
The publication of the LeuTAa crystal structure12 provided an invigorating breakthrough for the study of MATs as there is no direct crystallographic data. With the structure of LeuTAa now available, computational techniques can and have been applied to the MATs by using LeuTAa as a template. There have been many studies11,14–29 that set out to investigate the molecular principles behind the transport mechanism, conformational changes, pathways, and sites for the permeation of ligands through the MATs and LeuTAa. Despite this, the fundamental mechanism of transport has not been clearly elucidated for the MATs or their homologue, LeuTAa.
Bound at the primary substrate pocket in the outward-occluded crystal structure of LeuTAa (PDB 2A65) are two sodiums, Na1 and Na2. Na1 is directly coordinated to the leucine substrate, in addition to 1A22, 1N27, 6T254 and 7N286. (This nomenclature identifies the TM helix first, then the residue name and number. For example, 1G20 indicates glycine 20 on TM 1.) Na2, roughly 7.0 Å away from Na1, is coordinated through interactions with 1G20, 1V23, 8A351, 8T354 and 8S355.12 Based on the original crystal structure, Yamashita et al. proposed that the sodium ions are required for transport as they serve an organizational role for leucine in the binding site. Further studies have attempted to tease out the exact roles of Na1 and Na2. One study14 suggested that the Na2 binding site is a structural site that plays a role in substrate binding and local pocket formation. In another study, in which an inward-facing state of LeuTAa was generated, Na2 was observed to be released first (leucine and Na1 release were not observed) to the intracellular milieu after conformational rearrangement (through targeted molecular dynamics).24 Yet another study showed that binding of Na+ in the Na2 site is required to enhance the ion selectivity of Na+ in the Na1 site.17 Another study suggested that the binding and unbinding of sodium at the Na2 site allows the substrate to shift the conformational equilibrium needed for transport by altering the energetic requirements.25
To transport substrates across the membrane, it has been proposed30,31 that LeuTAa follows an alternating access mechanism.32 This model proposes that the substrate binds to one side of the membrane protein, while some energy input drives a conformational change in the protein allowing the substrate to be transported to the other milieu. This transport is proposed to occur if and only if all co-transported components are bound, and not when the primary pocket is partially filled.33 LeuTAa thus alternates between the outward-facing-open (OF-o) and inward-facing-open (IF-o) states, where outward refers to the extracellular milieu and inward refers to intracellular milieu. During this alternating activity, there exists at minimum two other states: outward-facing-occluded (OF-occ) and inward-facing-occluded (IF-occ).24 These occluded states reflect structures where the substrate is bound, but not directly accessible to the extracellular or intracellular environments. While crystallography has captured some of these states,12,13,22,34–40 the mechanism by which LeuTAa alternates between the OF-o, OF-occ, IF-occ, and IF-o states remains unclear.
The transport picture of LeuTAa, and by extension, the MATs, is further clouded by a disparity in results regarding the number of substrates required for transport. Recently, two independent studies have reported on the transport of leucine in LeuTAa. One study indicated that only one substrate is necessary for transport, while the other study concluded that two substrates are needed for transport. The disparity is detailed in a recent review on the topic.41
The hypothesis of a two-substrate transport mechanism arises from the fact that two pockets have been identified in leuTAa. There exists the primary substrate pocket buried midway through the transporter. A second pocket, often referred to throughout the literature as the extracellular vestibule, secondary pocket, inhibitor pocket or (the notation we will use here) the S2 pocket is located roughly 10 Å toward the extracellular milieu. (By this naming convention, the primary pocket becomes the S1 pocket.) The aromatic lid formed by 3Y108 and 6F253 as well as the extracellular salt bridge formed by 1R30 and 10D404 delineates these two pockets, highlighted in Figure 2. In DAT, the location of the S1 and S2 pockets are anticipated to be analogous, separated by a corresponding aromatic lid (3Y156/6F319) and salt bridge (1R85/10D475).
Figure 2.
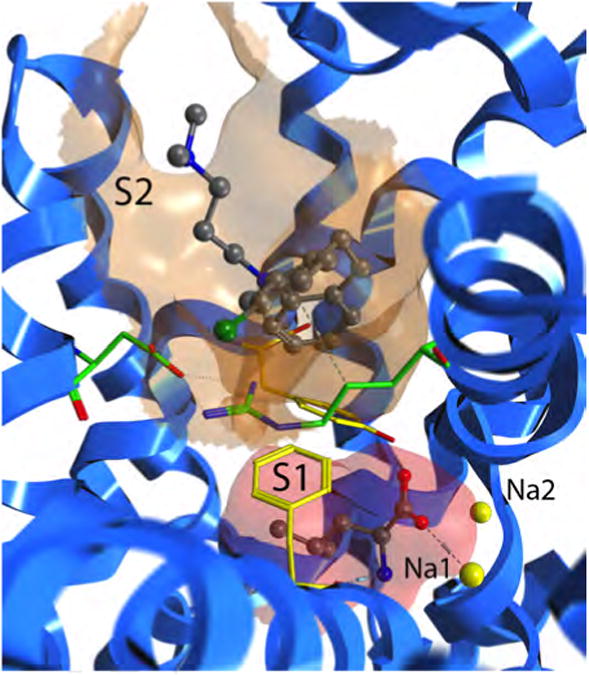
Close-up of the S1 and S2 sites in LeuTAa. The crystal structure of 2Q6H is shown, which is LeuTAa with leucine bound in the S1 pocket and clomipramine bound in the S2 pocket. The S1 pocket is highlighted with an red molecular surface and the S2 pocket is highlighted with an orange molecular surface. The ligands are displayed in gray ball-and-stick models. The aromatic lid formed by 3Y108 and 6F253 as well as the extracellular salt bridge formed by 10D404 and 1R30 are shown in yellow and green stick models, respectively. LeuTAa is shown in blue ribbons.
In terms of the S1 and S2 sites of DAT, the binding mode and pocket of cocaine has long been studied computationally and experimentally.11,15,28,33,42–49 Two recent, independent studies present data regarding the binding location of cocaine in DAT.47,49 Beuming et al.47 performed binding assays and observed cocaine binding to be competitive with dopamine binding. Based on a molecular model and site-directed mutagenesis, they propose that the binding site of cocaine in DAT overlaps with the substrate binding pocket of dopamine. An independent study by Huang et al.49 involving molecular modeling and dynamics simulations suggests that the cocaine binding site is close to, but does not overlap with, the dopamine binding site of DAT. Huang et al. identify the binding pocket of cocaine to be in the “substrate-entry tunnel” (analogous to the S2 site) from the extracellular milieu composed of residues from TMs 1, 3, 6, 8 and 10. They suggest this binding pocket to be, at minimum, the initial binding site for cocaine in DAT. They point out that DAT can naturally accommodate cocaine in this pocket. DAT would need to undergo significant conformational rearrangements in order to expand the substrate pocket to accommodate for the large size of cocaine, compared to dopamine.49
In order to gain insight to the binding sites and permeation pathways of DAT and LeuTAa, we performed two types of specialized molecular dynamics (MD) techniques. In the first MD method, a proposed permeation pathway was selected for the substrate based on the intracellular and extracellular gates of LeuTAa and DAT. Subsequently, the overall free energy score of the substrate in the transporter was calculated over the fixed permeation pathway. In these simulations, we gain insight to the binding site of cocaine, in addition to behavior of Na1 in leucine transporter in LeuTAa. In the second method, substrates were allowed to search for an escape route from the transporters. In collecting many replicates of the escape routes, we can determine a likely permeation pathway for substrates in the transporters. In these simulations we again observe Na1 co-transport with leucine in LeuTAa. We also identify two recurring intracellular pathways in LeuTAa and DAT.
2. Methods
2.1. LeuTAa Structure for MCTI Simulations
The coordinates of LeuTAa were obtained from the Protein Data Bank entry 2A65 (www.rcsb.org, MMDB accession no. 34395) corresponding to the bacterial (Aquifex aeolicus) leucine transporter. This particular structure is missing residues el2N133 and el2A134, in addition to four residues at each N- and C-termini. el2N133 and el2A134 were reintroduced into the structure using the model builder module in Molecular Operating Environment 2008.10.50 Two structures were generated for use in MCTI simulations. The first was only the protein in medium (in vacuum environment); the second structure included the protein in a water sphere with a 25 Å radius. The total system sizes were 8,321 atoms and 36,816 atoms, respectively. These environment choices were made in order to reduce system size and subsequent computational cost of MD simulations.
2.2. DAT Structure for MCTI Simulations
Construction of the molecular model for DAT has been described in detail elsewhere.15 Briefly, the FASTA sequence of the rat DAT protein (SwissProt locus SC6A3 RAT; accession number P23977; NCBI accession number AAB21099) was used as the query in three independent sequence alignments with LeuTAa: Robetta server, 3D-JIGSAW server and the alignment of Yamashita et al.12 The model from the Robetta server was chosen as it produced the best docking energies for dopamine and amphetamine in the software program MOE.51 The AMBER99 all-atom force field was used to add hydrogen atoms and assign partial charges.52 The newly added hydrogen atoms were relaxed via several cycles of energy minimization using a conjugated gradient/truncated Newton optimization algorithm. The convergence criteria for final sidechain refinement was carried out with AMBER99: 0.05 kcal/mol Å and a dielectric constant ε = 3. Since the 2A65 structure was used as a template, the final DAT model represents and outward-facing conformation. Additional dynamics of the DAT molecular model were collected,11 which totaled 35 ns of production dynamics of DAT embedded in a bilayer (described below). The coordinates of DAT were obtained from the 32 ns structure and isolated for use in the MCTI simulations, in vacuum.
2.3. Solvated Protein and Lipid Bilayer Construction for RAMD Simulations
Construction of the embedded DAT and LeuTAa systems has been describe elsewhere.11 Briefly, the LeuTAa crystal structure and DAT outward-facing model were embedded in a 1-palmitoyl-2-oleoyl-sn-glycero-3-phosphoethanolamine (POPE) membrane using the membrane builder plugin of Visual Molecular Dynamics (VMD).53 The protein and POPE membrane were solvated with approximately 32,000 TIP3 waters. Sodium and chloride ions were added to the system, yielding an overall neutral system at approximately 0.2M NaCl. The 32 ns structure (also used for MCTI simulations) if the DAT molecular model was obtained from11 and used for all RAMD simulations involving the dopamine transporter.
One LeuTAa structure was obtained from54 which reflects the initial 2A65 structure after 250 ns of accelerated molecular dynamics (aMD).55 The final protein structure from the aMD simulation was used in this study for RAMD simulations. Coordinates of two inward-facing LeuTAa models were obtained from the Supplemental Information provided by Shaikh and Tajkhorshid24. These will be referred to as M1 and M2. Each of these models were embedded in a POPE membrane and solvated as described above. Structures were minimized, equilibrated and put through a production run of 1 ns using a 2 fs timestep at a constant temperature (310K) and pressure (1 atm) before using them for RAMD simulations.
2.4. Multi-Configuration Thermodynamic Integration
To study the proposed permeation pathway via the extracellular and intracellular gates of LeuTAa 12 and DAT, the Multi-Configuration Thermodynamic Integration (MCTI) method56 was utilized. MCTI has been used to compute the potential of mean force (PMF) around the φ and ψ angles of alanine dipeptide.57 Additionally, this method has been used to calculate the free energy barrier for the OH transfer step of the hydroxylation reaction of p-hydroxybenzoate in the enzyme p-hydroxybenzoate hydroxylase (PHBH).58 The method has also been used to investigate the free energy surfaces of alanine (Ala) and R-methylalanine (Aib) homopeptides.59
The MCTI method uses MD simulations to generate configurations. The method then uses these configurations to smoothly transform one state to another while calculating the change in free energy. The Gibbs free energy difference between the two states is described by the Hamiltonians Hλ=0 (i.e. ligand in S1/S2) and Hλ=1 (i.e. ligand at extracellular/intracellular milieu) and can be obtained from the integral:
| (1) |
where ΔG is the change in Gibbs energy, λ is a coupling parameter and is the ensemble average of the partial derivative of the Hamiltonian with respect to the partial derivatives of λ. By introducing the coupling parameter λ, the Hamiltonian is thus λ-dependent thereby connecting λ to the position and momenta of the particles. Since molecular dynamics are done in discrete steps, the integral is evaluated as a sum of the ensemble averages:
| (2) |
where i counts over the values of λ and Δλi is the difference between each value of λ. This change in λ is carried out at discrete steps called windows. At each window, a molecular dynamics simulation is performed which consists of an equilibration period, followed by a data accumulation stage in order to calculate the free energy.56
Transport of ligands through both the leucine and dopamine transporters was simulated. For LeuTAa:Leu and DAT:DA complexes, the lsubstrate was bound in the primary (S1) pocket of the protein. However, in the DATCOC complex, cocaine was docked into the S2 pocket for the starting structure. For each complex, the structure was equilibrated at a constant temperature (310K) and pressure (1 atm) for 500 ps prior to use in MCTI simulations.
For each complex, a permeation pathway for the substrate was selected from a pocket (S1 or S2) to either the extracellular or intracellular milieu. Two vectors were defined for each complex. The first vector was defined from the geometric center of the ligand through the midpoint of the extracellular gates (1R30/10D404 in LeuTAa, 1R85/10D475 in DAT). The second vector was defined from the geometric center of the ligand through the midpoints of the intracellular gates (1R5/8D369 in LeuTAa, 1R60/8D435 in DAT). These fixed vectors were determined through the use of VMD 1.8.7.53 Geometric centers of the gate residues were determined in VMD, and the midpoint of the two gate residues were manually calculated. The lengths of the vectors were extended at least 7 Å past the protein. This is depicted in Figure 3. The LeuTAa:Leu complex was simulated in both a vacuum and water sphere environment. The DATDA and DATCOC complexes were simulated in vacuum only.
Figure 3.
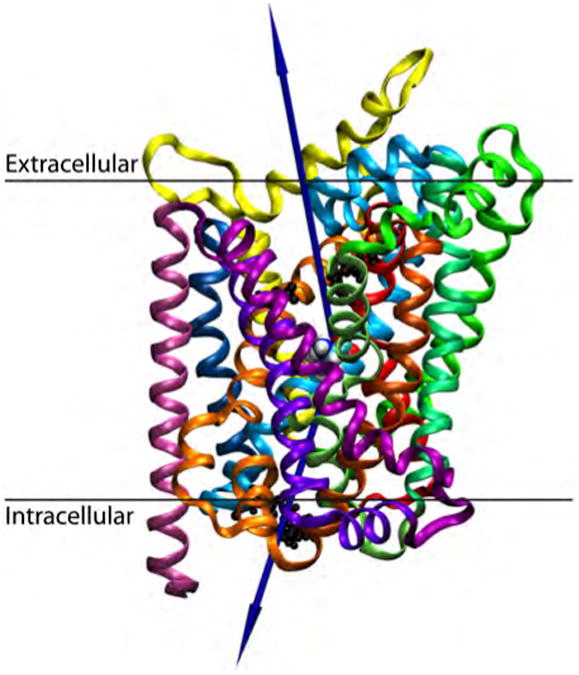
A graphic representation of the LeuTAa:Leu complex for MCTI simulations. The substrate, leucine is shown in the primary pocket in VDW spheres. Intracellular (1R5/8D369) and extracellular (1R30/10D404) salt bridges are highlighted in a black CPK representation. The proposed permeation pathway from the pocket to each milieu is shown with a blue vector. The 12 transmembrane helices are colored as ribbons: TM1, red; TM2, dark orange; TM3, light orange; TM4, yellow; TM5, lime-green; TM6, sea-foam green; TM7, green-cyan; TM8, cyan; TM9, navy-blue; TM10,violet; TM11, purple; TM12, mauve. This coloring scheme for TM helices will be used throughout the figures, unless otherwise noted.
MCTI simulations were carried out using the implementation found in NAMD 2.660. The z-distance option was used to incrementally move ligands from the pocket to both extracellular and intracellular milieus. For each permeation pathway, the vector was split into 250 windows. This resulted in the ligand being moved out of the pocket in 0.18Å increments on average. An accumulation time of 60 ps was used, with 20 ps of relaxation used between each window.
Each MCTI simulation from the pocket to either milieu was 40 ns. For each setup, a total of twenty MCTI simulations were carried out; ten simulations where the substrate was incrementally moved from the pocket to the extracellular milieu and ten simulations where the substrate was incrementally moved from the pocket to the intracellular milieu. In total, 1.6 μs of MCTI MD trajectory data was collected for each transporter. Multiple replicates of the simulations were executed such that the resulting free energy profiles could be averaged and overall noise in the data could be reduced. Simulations were carried out through TeraGrid resources provided by the Pittsburgh Supercomputing Center and National Institute for Computational Sciences.
2.5. Random Acceleration Molecular Dynamics
The Random Acceleration Molecular Dynamics (RAMD)61,62 method, implemented in NAMD60 was used to investigate the unbiased entrance and exit pathways for a variety of ligands and structures relating to the MATs and LeuTAa. Previously, the RAMD method has been used to identify egress routes for ligands from buried active sites in Cytochrome P450cam,61 retinoic acid receptor,63 liver fatty acid binding protein,64 the vitamin D receptor65 and the β2-adrenergic receptor.66
In the RAMD method, a force is applied to the ligand in order to explore possible egress routes. The force constant, k is chosen by the user, and the unit vector, r⃗0 is obtained from a random number generator. The force on the ligand is then given by:
| (3) |
The force, F⃗ is maintained on the ligand for a specified number of steps, m, so long as the ligand maintains a threshold velocity, given by:
| (4) |
The threshold velocity (vmin) has units of Å/fs, where the rmin value is determined by the user, and Δt indicates the timestep used in the simulation.
If the velocity of the ligand falls below the threshold velocity (vmin) the direction in which the force is applied will be changed. A new (random) unit vector will be chosen by the random number generator and applied to Equation 3. This process repeats until the ligand escapes from the complex. In comparison to the MCTI method (where a single, fixed pathway was study), this method allows for an unbiased search for escape routes of the ligand from the complex. Furthermore, the RAMD method enables nanosecond timescales for ligand exit as dissociation kinetics are accelerated in a given RAMD simulation.
RAMD simulations of the following LeuTAa and DAT were carried out. Several LeuTAa structures were chosen for this study. Table 1 summarize the various simulation setups. In R1 and R2, the LeuTAa structure after 250 ns of accelerated MD was used. In R1, the substrate leucine (Leu) was placed only in the S1 pocket. In R2, Leu was docked into both the S1 and S2 pockets. Three other systems were setup using the two inward-facing models (M1 and M2) from Shaikh24. In R3 and R4, Leu was placed only in the S1 pocket. Lastly, R5 represents the M1 inward-facing model with Leu bound at S1 and S2. In all simulations involving LeuTAa, the force in RAMD simulations was applied to the Leu in S1. These simulations were carried out in the lipid bilayer and solvent system described earlier.
Table 1.
Summary of RAMD simulation details and parameters. All RAMD simulations were carried out with an acceleration of 0.1 kcal/mol Å. Occupancy of the S1 and S2 pockets is noted. In all cases (with the exception of R7 and R8) the force in the RAMD simulations was applied to the substrate found in S1. In R7 and R8, no substrate was docked in S1, and thus the force was applied to amphetamine and cocaine in the S2 pockets.
| Setup | Transporter | S1 | S2 | # of Trajectories | # Extra. Egresses | # Intra. Egresses | # Failed Escapes | Simulation Length Range |
|---|---|---|---|---|---|---|---|---|
| R1 | LeuTAa | Leu | - | 40 | 7 (17.5%) | 31 (77.5%) | 2 (5%) | 0.1 - 0.7 ns |
| R2 | LeuTAa | Leu | Leu | 50 | 0 | 27 (54%) | 23 (46%) | 38 ps - 1 ns |
| R3 | LeuTAa M1 | Leu | - | 49 | 0 | 46 (94%) | 3 (6%) | 23 ps - 0.3 ns |
| R4 | LeuTAa M2 | Leu | - | 50 | 0 | 46 (92%) | 4 (8%) | 28 ps - 0.3 ns |
| R5 | LeuTAa M1 | Leu | Leu | 50 | 0 | 49 (98%) | 1 (2%) | 34 ps - 1 ns |
| R6 | DAT | DA | - | 50 | 18 (36%) | 28 (56%) | 4 (8%) | 0.1 - 0.7 ns |
| R7 | DAT | - | AMA | 50 | 44 (88%) | 3 (6%) | 3 (6%) | 46 ps -1 ns |
| R8 | DAT | - | COC | 50 | 50 (100%) | 0 | 0 | 24 - 31 ps |
| R9 | DAT | DA | DA | 49 | 24 (49%) | 20 (41%) | 5 (10%) | 80 ps - 0.9 ns |
| R10 | DAT | DA | AMA | 50 | 32 (64%) | 10 (20%) | 8 (16%) | 80 ps - 0.7 ns |
| R11 | DAT | DA | COC | 49 | 22 (45%) | 11 (22%) | 16 (33%) | 6 ps - 0.1 ns |
For the dopamine transporter, RAMD simulations were carried such that the inhibitors amphetamine (AMA) and cocaine (COC) were docked into the S2 pocket, while the S1 pocket remained empty (R7 and R8, respectively). Dopamine (DA) was docked in S1 pocket for setup R6. For simulations R9-11, dopamine was docked into the S1 pocket for each, while either dopamine, amphetamine or cocaine were docked into the S2 pocket. As in the case for the LeuTAa:Leu:Leu complexes, the substrate in the S1 pocket was the chosen substrate for the force to be applied.
Between 40 and 50 replicates were executed for each setup, as indicated in Table 1. As with the MCTI simulations, the structure of each complex was equilibrated at a constant temperature (310K) and pressure (1 atm) for ∼500 ps before performing the RAMD simulations. All RAMD simulations were also carried out at a constant temperature of 310 K, constant pressure of 1 atm, using periodic boundary conditions for the system and timestep of 2 fs. A force constant of k = 0.1 kcal/mol Å was used for all simulations. This force was maintained for m = 50 steps and the rmin distance was set to 0.02 Å. Thus, the threshold velocity, as given by Equation 4 is equal to 0.01Å/fs. Several values of k,m and rmin were chosen before arriving at those final values. Initial choices were guided by published values given in previous studies using the RAMD method.61–63,66 Large values of k and m led to escapes on very short timescales. If the distant required for the ligand to move was too large (large rmin) the ligand would not move from pocket. Thus, the final values were chosen to promote slower escapes on achievable timescales.
The escape criteria for the simulations was set to a 40 Å from the initial center of mass for the ligand. This distance is chosen based on the overall size and shape of the transporter. Based on intracellular and extracellular egress routes, the bulk is 40 Åfrom the pocket. once the escape criteria is met, the RAMD simulation is complete. Simulations were carried out using NAMD 2.7b260 through TeraGrid resources provided by the National Institute for Computational Sciences.
3. Results and Discussion
3.1. MCTI
The average free energy score as substrates are moved along the proposed permeation pathway are presented in Figures 4 and 5 for the following complexes: LeuTAa:Leu, DAT:DA and DAT:COC. Note that we are not reporting quantitative numbers; rather, we use this as a qualitative approach to identify stop-over sites and sites of interest in the transporters. The timescale of the transport process is estimated to be on the order of 1 ms12 and each individual MCTI simulation was only 40 ns in length. These simulations are informative; however they do not allow for significant conformational changes in the protein.
Figure 4.
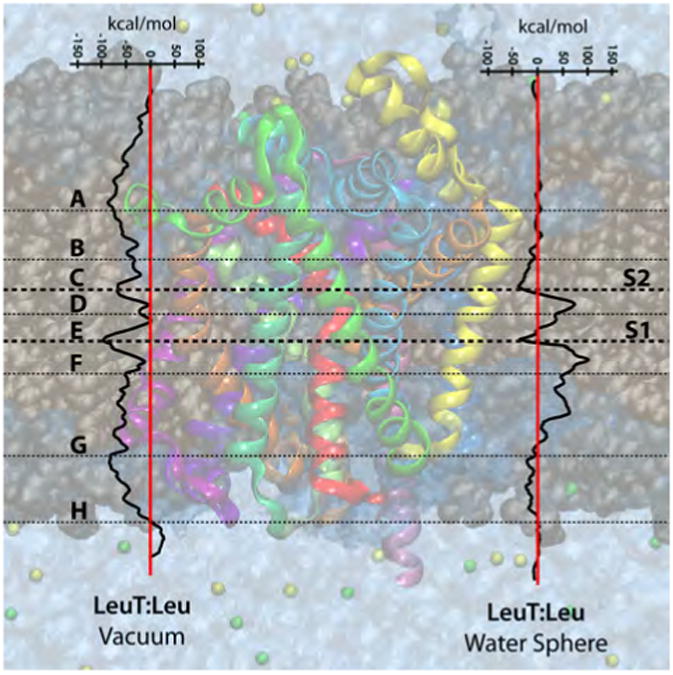
Free energies profiles of the substrate leucine through LeuTAa, as calculated via the MCTI method in both environments (vacuum and water sphere). Identified stopover sites (points of interest) are labeled A-H with horizontal lines depicting their general position in their respective transporter.
Figure 5.
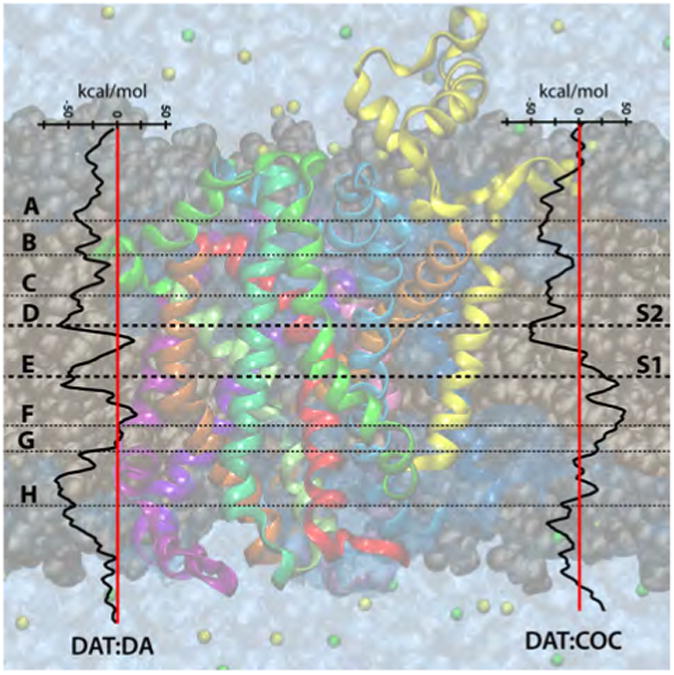
Free energies profiles of the substrate dopamine and inhibitor cocaine in DAT, as calculated via the MCTI method in vacuum. Identified stopover sites (points of interest) are labeled A-H with horizontal lines depicting their general position in their respective transporter.
The sites labeled A-H in Figures 4 and 5 were isolated from the MCTI trajectory files as sites of interest and analyzed in MOE 2009.1051 to identify the interacting residues of the transporter with the substrate at that site. MOE 2009.10 was used to generate all 2D interaction maps for the substrate at the sites (available in Supporting Information). A summary of the residues found to interact with the ligand (leucine, dopamine or cocaine) along the proposed permeation pathway are presented in tabular for in Supporting Information.
3.1.1. Low Free Energy Scores Correspond to S1 and S2 in LeuTAa
In both environments studied for the LeuTAa:Leu complex, relative low free energy scores are observed for the primary (S1) and secondary (S2) substrate pockets, as indicated by site C (S2) and site E (S1) in Figure 4. An increase in free energy score is observed in both environments as Leu is moved from the S2 pocket to the S1 pocket, which can be attributed to breaking of the aromatic lid (3Y108/6F253) that seals off the S1 site from the extracellular milieu. Substrate movement from S1 toward the intracellular milieu (site F) results in an increase in free energy score, attributed to disruption of binding pocket residue interactions. An increase and relative positive free energy score is also observed in both environments (although it is more evident in the vacuum environment) when leucine passes through intracellular gate (1R5/8D369) as represented by stopover site H.
Investigation of interacting residues, in conjunction with the free energy profiles, confirms that the S2 pocket identified in this study is in agreement with work done by Quick et al.22 While there are differences in the profiles for the two environments, the distinct similarities, particularly those of the S1 and S2 sites, gives us confidence that this method can be effectively used to investigate complexes of dopamine and cocaine with a previously validated DAT molecular model.15
3.1.2. Profiles of dopamine and cocaine in DAT differ at S1
Similar features are observed in the DAT:DA free energy profile as in the LeuTAa:Leu profiles. Low free energy scores are observed for dopamine at both S1 (site E) and S2 (site D), as is expected for the natural substrate of DAT. For DA, the magnitude of those free energy scores are similar. A free energy score barrier is observed between those sites, indicating the breakage of the aromatic lid (3Y156/6F319) separating S1 and S2 in DAT.
An important feature of the DAT:COC profile is the striking difference as the inhibitor is moved toward the intracellular milieu from the S2 pocket. Here, a positive free energy score for cocaine in the intracellular half of DAT is expected as cocaine is an inhibitor that is not transported. A relative low free energy score at the S2 site is observed (site D) for cocaine in DAT. However, a higher free energy score is observed for cocaine at the S1 pocket of DAT. Recalling that free energy scores for DA at S1 and S2 were low, and similar, these results suggest that S2 is a more favorable pocket for cocaine in DAT, compared to the S1 pocket.
3.1.3. Cocaine is not stabilized by S1 residues in DAT
Further investigation of the DAT:DA and DAT:COC trajectories and coordinates reveal that cocaine does not participate in side-chain interactions with DAT beyond site C labeled on the DAT:COC free energy profile in Figure 5. Coordinates of dopamine and cocaine in S1 of DAT were extracted from trajectory frames corresponding to the local minima present at stopover site E which reflects the S1 site in DAT. The extracted coordinates were then used for a short MD simulation (1ns) to allow for the macromolecule and amino acid side-chains to relax. The final structures were then loaded into MOE 2009.10, where 2D ligand interactions plots were generated, see Figure 6. At the S1 site, dopamine is stabilized by interactions with 1F76, 1D79, 6V327 and 8S421 and fits comfortably in the binding cavity. By comparison, cocaine at the S1 site is not stabilized by any amino acid side-chain interactions and appears to be quite large for the given cavity size. These results further suggest that the binding site of cocaine is located above the aromatic lid (3Y156/6F319) of DAT in what Huang et al. refer to as the “substrate-entry tunnel”, or what we refer to here as the S2 site.
Figure 6.
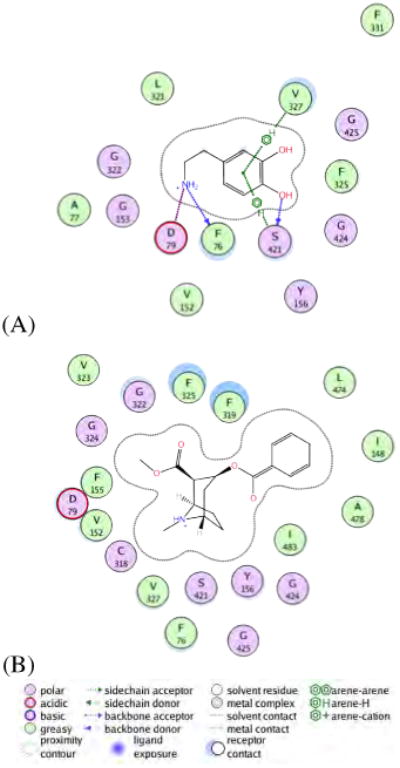
Residue interactions of DAT with dopamine (A) and cocaine (B) at the primary (S1) pocket. Coordinates of dopamine and cocaine in S1 of DAT were extracted from trajectory frames corresponding to the local minima present at stopover site E which corresponds to the S1 site. The apparent lack of residue interactions with cocaine at S1 suggests that cocaine does not favorably bind at the same pocket as dopamine in DAT. 2D interaction maps were generated using MOE 2009.10.
3.1.4. Pocket volumes of S1 and S2 in DAT
The volumes of the S1 and S2 pockets in the presence of dopamine and cocaine were analyzed from extracted coordinates of the ligands at S1 and S2 pockets. Ligand and amino acid side-chains of the four structures were allowed to relax for 1 ns. After MD, the ligands were removed and only the protein structure were used for analysis using POcket Volume MEasurer (POVME).67 In this method, a volume-grid file is generated by defining an inclusion sphere centered about a defined region that encompasses the binding pocket. Points from the volume-grid file that are close to protein atoms are deleted, leaving points that define the binding pocket. Prior to deleting the ligands, their geometric centers were obtained and used as the centers of the inclusion spheres of size 10 Å. A grid-spacing of 1.0 Å was used while a padding of 1.09 Å was used.
The S1 pocket of the DAT:DA complex occupies a volume of 140 Å3. In order for cocaine to bind in the same pocket, S1 must expand to nearly twice the volume, 261 Å3. Analysis of the S2 pocket provided an interesting insight. For the DAT:DA complex, the S2 pocket volume is comparable to the S1 pocket: 141 Å3. The S2 pocket of DAT allowed DA to nestle into the S2 pocket with a similar pocket volume as in S1. By comparison, the pocket volume of S2 in the DAT:COC complex is far greater: 305 Å3. The general flexibility of the “substrate-entry tunnel” and subsequent S2 pocket allows for a bulky inhibitor such as cocaine to bind to DAT, while the interior of the protein at S1 does not provide the flexibility necessary to accommodate and coordinate cocaine.
3.1.5. Co-transport of Na1 with leucine
During all LeuTAa:Leu MCTI simulations, we observed an interesting escorting behavior of the Na+ of Na1 site. Movement of sodium in the Na2 binding pocket was not observed. In Figure 7, we present snapshots of the simulated transport of leucine in LeuTAa. Throughout the transport process, Na1 remains close to leucine while leucine was moved from the binding pocket to either milieu. It is important to note that the MCTI method was not used to move either sodium, and that indeed Na1 was co-transported with leucine during simulated transport.
Figure 7.
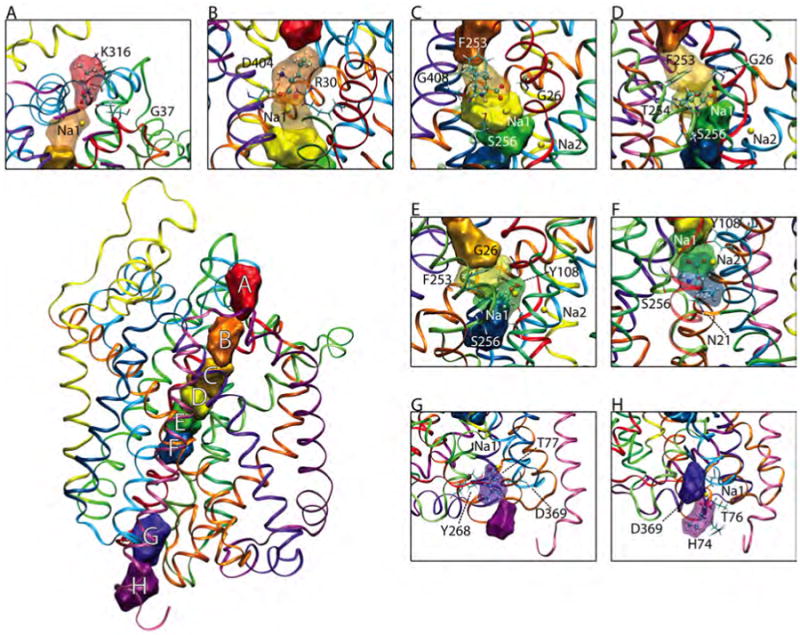
MCTI stop-over sites identified for leucine in LeuT, water sphere environment. Stop-over sites are labeled A-H, represented by a surface representation of the substrate at that particular site, with a 3.5 Å probe radius. Leucine is presented in a ball and stick representation, with the surface representation changed to transparent for clarity. (In some insets, nearby pockets are changed to transparent for added clarity and to highlight proximity and overlaps of the stop-over sites.) Key residues at each site are identified and labeled, drawn in a stick model. Note, “E” is the S1 site while “C” represents the S2 site.
Interestingly, in the case of DAT MCTI simulations, there was no co-transport of Na+ observed with dopamine or cocaine. This observation is consistent with findings44,45,68 that dopamine binds to the DAT in the absence of Na+.
3.2. RAMD
Table 1 provides an overview of the systems studied, generalized egress points and the range of simulation lengths. Initially, pathways were clusters on very general criteria: extracellular escapes, intracellular escapes or failed escapes. A “failed escape” refers to either 1) a simulation in which the substrate does not find an escape pathway during the simulation (e.g. substrate does not leave the pocket) or 2) a simulation in which the escape pathway sampled for the substrate is neither extracellular or intracellular; rather the substrate finds an escape pathway from the pocket out the middle of the protein and in to membrane.
For a given setup, all of the trajectory files from the simulations were analyzed using the Volmap Plugin in VMD 1.8.753 to visualize the escape route of the molecule of interest. The center of mass for the substrate was selected and volume files indicating the substrate occupancy over the trajectory were generated. Individual pathways of a given setup were then clustered based on visual inspection of the volume files and sodium movement to determine one or a few main pathways. Those trajectories which fall into a main pathway category were then analyzed using the Hydrogen Bonds Plugin of VMD 1.8.7. Hydrogen bonds between the substrate and the protein were calculated for each trajectory of a given pathway cluster. In this way, we categorize the pathways observed from 500+ RAMD simulations.
3.2.1. General findings: LeuTAa
In RAMD simulations using the single bound substrate LeuTAa structure (R1), we observe that the majority (77.5%, see Table 1) of escape routes sampled were via an intracellular egress point. Noting that this structure has been through roughly 250 ns of accelerated MD, a large majority of intracellular escapes may indicate that the structure is approaching an inward-facing state. As anticipated, RAMD simulations using either inward-facing model (R3-R5) from Shaikh and Tajkhorshid24 resulted in primarily (92%+) intracellular escapes, with leucine bound only in S1 or leucine bound in both S1 and S2. In the dual-bound 2A65 structure after dynamics (R2), we observe the only successful egresses to be to the intracellular milieu. We do note that 46% of those simulations resulted in failed escapes. This too may suggest that the structure54 is approaching an inward-facing conformation.
After initial clustering, it became apparent that a single intracellular escape pathway was not being sampled. Thus, we classified two primary intracellular escape pathways found in RAMD simulations of all LeuTAa models. Tables 2 and 3 highlight the further classification of intracellular and extracellular escape pathways. Several of these pathways are shown in Figures 8 and 9. After clustering, hydrogen bonding of leucine to LeuTAa was analyzed. Residues not part of the substrate pocket are listed in Tables 2 and 3 for each cluster of pathways LeuTAa and DAT. A complete list of interacting residues can be found in Supporting Information.
Table 2.
Summary of pathways observed in RAMD simulations of the leucine transporter. Setups correspond to those listed in Table 1. Pathway clusters are identified as intracellular (I) or extracellular (E), followed by a number denoting a specific pathway. After analysis, each pathway was assigned to one of two recurring pathways observed: along TMs 6b/8 or along TMs 1a/6b. Observation of sodium movement (Na1 in all cases) with leucine is indicated, as well as how many paths belong to the cluster. Observed residues interacting via hydrogen bonding for each pathway cluster are listed. Note that the residue list omits binding pocket residues (as described in Yamashita et al.:12 N21, A22, L25, G26, V104, Y108, F252, F253, S256, F259, S355, I359) for clarity. A complete list can be found in supporting information.
| Setup | Path | TMs | Na? | # Times | Residues |
|---|---|---|---|---|---|
| R1 | E1 | – | No | 7 | 6T254 |
| I1 | 6b/8 | Yes | 14 | il1T77, 6T254, 6G260, 6A261, 6T264, 8A358, 12L500 | |
| I2 | 1a/6b | No | 14 | 1R5, 6T254, 6G260, 6T264, 6S267, 6Y268, 8A358, 8Q361 | |
| R2 | I1 | 1a/6b | Yes | 8 | 2E62, 2W63, 6T254, 6L255, 7D274 |
| I2 | 1a/6b | No | 9 | 2W63, 6T254, 6L255, 7Q273 | |
| R3 | I1 | 6b/8 | Yes | 31 | 1G24, 1N27, il1G73, il1H74, 6T254, 6A261, 6T264, 6Y265, 6Y268 |
| R4 | I1 | 1a/6b | Yes | 9 | 6T254, 6T264 |
| I2 | 1a/6b | No | 23 | il1G73, il1G75, il1T76, 6T254, 6T264, 6Y265, 8E368 | |
| R5 | I1 | 1a/6b | Yes | 24 | 2W63, 6T254, 6R270, 6T264, 6Y265, 8E360 |
| I2 | 1a/6b | No | 18 | 6T254, 6R270, 7Q273 |
Table 3.
Observed residues interacting via hydrogen bonding for each pathway cluster in DAT. We denote the transmembrane (TM) helix the residue belongs to i.e.,1F76 specifies the F76 residue, belonging to TM1. Clusters are identified as intracellular (I) or extracellular (E), followed by a number denoting a specific pathway. Observation of sodium movement which was NA1 in all cases with the substrate is also indicated, as well as how many paths belong to the cluster.
| Setup | Path | # Times | Residues |
|---|---|---|---|
| R6 | E1 | 14 | 1F76, 1R85, I148, 3S149, 3Y156, 6L321, 6G322, 6F325, el4A382, 10D475 |
| I1 | 15 | 1F76, il1G127, il1A128, 3S149, 3Y156, 6L321, 6G322, 6F325, 8G425, 10E490 | |
| I2 | 7 | 1S72, 1F76, 3S149, 3Y156, 6L321,6G322, 6F325, 8S428 | |
| R7 | E1 | 44 | 1W84, 3Y156, el4A382, el4T383, el4D384, el4G385, 10F471, 10T472, 10D475 |
| R8 | E1 | 34† | 1W84, 1R85, el4D384, el4G385, el4P386, 10D475 |
| R9 | E1 | 16 | 1F76, 3I148, 3S149, 3Y156, 6L321, 6F325, el4T383, 8D420, 8G425, 10T472, 10D475 |
| I1 | 3 | 1F76, 3S149, 3Y156, 6L321 | |
| I2 | 3 | 1F76, 3S149, 3Y156, 6L321, 7N339, 7D344, 7T348, 8G425, | |
| I3 | 3 | 1F76, 3S149, 6F325, 8G425 | |
| I4 | 4 | 1F76, 3S149, 3Y156, 6F325, 8E436 | |
| R10 | E1 | 9 | 1F76, 1R85, 3I148, 3S149, 3Y151, 3Y156, el4T383, 8S421, 9A442, 10D475, 10A478 |
| E2 | 12 | 1F76, 1R85, 3I148, 3S149, 3Y156, 6L321, 6F325, el4A382, 10D475 | |
| I1 | 8 | 1D68, 1S72, 1F76, 3S149, 3Y156, 5L254, 6L321, 7N352, 8D420, 8G424, 8G425, 8S428 | |
| R11 | E1 | 17 | 1F76, 1R85, 3I148, 3S149, 3Y156, 6L321, 6F325 |
| I1 | 4 | 1F76, 3S149, 6L321 | |
| I2 | 7 | 1F76, il1A128, il1W132, 3S149, 3Y156, 6L321, 6F325, 8G425, 8S428, 8E436 |
In 16/50 DAT:COC RAMD runs, no hydrogen bonding between the protein and cocaine was observed. Note that this list omits binding pocket residues (as described in Indarte et al.:15 A77, D79, V152, F319, S320, V327, S421and A422) for clarity. A complete list can be found in supporting information.
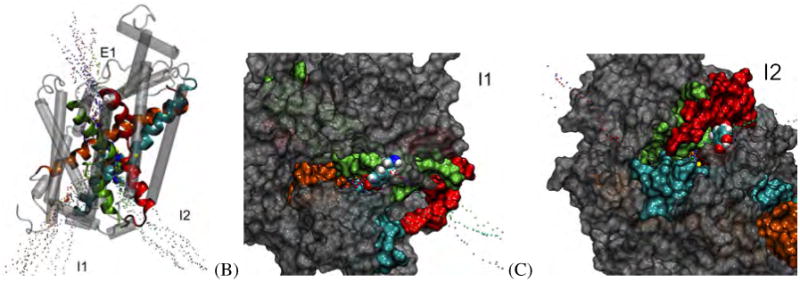
Figure 8.
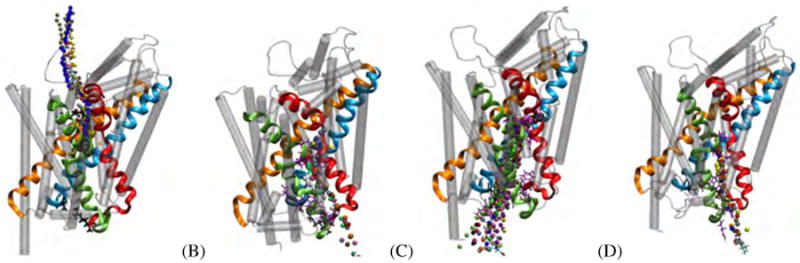
Selection of pathways observed in LeuTAa RAMD simulations. (A) R1E1: Main extracellular pathway. (B) R2I1/R2I2: Main intracellular sub-pathway 1a/6b. (C) R3I1: Main intracellular sub-pathway 6b/8. (D) R5I2: Main intracellular sub-pathway 1a/6b. In each panel, LeuTAa TMs 1, 3, 6 and 8 are colored as red, light orange, sea-foam green and cyan ribbons respectively. The remainder of the TMs are shown are transparent grey tubes, for clarity. Residues lining the pathway are highlighted in purple stick representations. Observed pathways are represented as isosurfaces; each color of pathway indicates a separate run.
Figure 9.
Pathways observed in the DAT:DA RAMD simulations. (A) Three pathways were observed for the DAT:DA complex: One primary extracellular pathway (R6E1), and two main intracellular pathways (R6I1 and R6I2). (B) Snapshot from a trajectory of an R6I1 egress. Dopamine (shown in VDW spheres) follows a pathway that closely follows TM 6b/8. (C) Snapshot from a trajectory of an R6I2 egress. Dopamine follows a pathway that closely follows TM 1a/6b. Pathways of R6I1 can be seen on the left-hand side of this image. In (A), TMs 1, 3, 6 and 8 are colored as red, light orange, sea-foam green and ribbons, respectively; while in (B) and (C) the TMs are colored the same but represented by surfaces with a 1.4 Å probe radius. The remainder of the TMs are shown are transparent grey tubes or surfaces, for clarity. Dopamine is represented by VDW spheres. In all panels, observed pathways are represented as isosurfaces; each color of pathway indicates a separate run.
3.2.2. Pathways: LeuTAa
The main extracellular pathway was observed in RAMD simulations of LeuTAa is shown in Figure 8A. Aside from interacting with residues in the defined binding pocket of LeuTAa, hydrogen bonding was only observed between leucine and T254 of TM6. 6T254 is one of the four residues (in addition to 1A22, 1N27 and 7N286 and the substrate, leucine) that coordinate the sodium of Na1. In fact, across most of the pathways sampled for LeuTAa, 6T254 has been identified as an interacting residue. Based on these observations, it is clear that the coordination of leucine, Na1 and 6T254 play a pivotal role in the release of substrate from the primary pocket.
Two primary intracellular pathways were observed across all simulations of LeuTAa. Pathways from these simulations appear in panels B, C and D of Figure 8. Panels B and D represent the first recurring pathway. This pathway follows along TMs 1a and 6b. The other pathway is represented by panel C, which follows along TMs 6b and 8. In R1, both recurring intracellular pathways were sampled. Interestingly, the 6b/8 pathway (R1I1) was sampled when Na1 was co-transported; yet the 1a/6b pathway (R1I2) was sampled when Na1 was not co-transported. In simulations of the dual-bound LeuTAa structure (R2), only the 1a/6b pathway was sampled. It is important to note that this pathway was sampled in both cases, i.e. with and without Na1 co-transport.
The TM 6b/8 pathway was also sampled heavily in simulations using inward-facing model #1 from Shaikh and Tajkhorshid's,24 represented by setup R3. In this setup, 46 of 49 RAMD jobs resulted in an intracellular egress. Of those 46 pathways, 31 resulted in intracellular egress routes along TMs 6b and 8. Inward-facing M2 from Shaikh and Tajkhorshid's24 was also used (R4) and we observed only the TM 1a/6b pathway to be sampled. Finally, we studied the inward-facing M1, with leucine bound at both the S1 and S2 sites. The resulting pathways, R5I1 and R5I2, are equivalent in terms of pathway sampled (TMs 6b/8), only differing in if Na1 was co-transported or not.
3.2.3. Pathways: DAT
RAMD of the DAT:DA complex resulted in observation of three main pathways for ligand egress. The primary extracellular escape pathway observed is similar to that observed in LeuTAa (R1E1). Similar to LeuTAa, two main intracellular pathways were observed for intracellular escape of dopamine from DAT- R6I1 and R6I2. These pathways are shown in Figure 9. Panels B and C of Figure 9 highlight these two intracellular egress points. The first, R6I1 tends to follow a pathway along TMs 6b/8, while R6I2 tends to follow a pathway along TMs 1a/6b. Path R6I1 was sampled twice as often as R6I2 over the 50 simulations of DAT:DA. RAMD simulations of psycho-stimulant drugs (amphetamine and cocaine) bound in the S2 pocket of DAT were also carried out. In both case (R7 and R8), only extracellular egresses were observed.
The set of simulations of R9-R11 set out to determine the permeation pathway of dopamine in the presence of dopamine, amphetamine or cocaine (R9, R10, R11, respectively) in the S2 pocket. While it should be intuitive that dopamine should not be able to escape to the extracellular milieu from the S1 pocket with a bound substrate or inhibitor in S2, we do observe extracellular egresses in each case of DAT:DA:DA (R9E1), DAT:DA:AMA (R10E1 and R10E2) and DAT:DA:COC (R11E1). We note that the difference in the R10E1 and R10E2 pathways for DAT:DA:AMA differ only slightly regarding maneuvering about amphetamine in S2 (data not shown). The extracellular pathways observed in R9-R11 are consistent with the observed extracellular egresses of DAT:DA (R6E1) and are overall similar to that observed in LeuTAa (R1E1).
In R9, no general consensus was reached for dopamine release to the intracellular milieu from the DAT:DA:DA complex, as evidence of four sub-pathways (R9I1-R9I4) with no strong clustering. Especially compared to such clustered escapes for DA from DAT:DA, this may suggest that DAT does not follow a two-substrate alternating access transport mechanism. In R10, we observe one primary intracellular egress for DA from the DAT:DA:AMA complex. The intracellular pathway, R10I1 is visually equivalent to that of R6I2 of DAT, which follows a pathway that closely follows TM 1a/6b. It should be noted that this pathway was only observed in 8 of 50 RAMD simulations of the DAT:DA:AMA complex.
4. Concluding Discussion
4.1. Insights Regarding the Leucine Transporter
At the S1 and S2 site of LeuTAa, low free energy scores were observed during MCTI simulations. The S2 site identified in this work is in agreement with work done by Quick et al.22 regarding the S2 site of LeuTAa. This success gave us confidence in using the MCTI method for further investigations of the S1 and S2 sites of our15 DAT homology model.
While both types of simulations (MCTI and RAMD) were not designed to investigate sodium transport, we made interesting observations regarding sodium co-transport in numerous simulations. In all MCTI LeuTAa simulations, Na1 was observed to be co-transported. Additionally, in cases when sodium was co-transported in RAMD simulations, the sodium observed to be co-transported was always Na1. Based on the results from these studies and others14,17,24 we suggest the following steps regarding the transport mechanism of leucine in LeuTAa.
Na2 first binds to an outward-facing state of LeuTAa. The binding of Na2 would play a structural role for local rearrangement of the unwound region of TMs 1 and 6 as suggested by Celik et al.14. Additionally, Celik et al. suggest that binding of Na2 provides enhanced selectivity for Na+ at the Na1 site. Upon Na2 binding and structural rearrangements, Na1 and leucine approach the interior of LeuTAa from the extracellular milieu together. Following this, release of Na2 from the S1 region triggers the inward-facing state, as observed in TMD simulations by Shaikh and Tajkhorshid.24 With an inward-facing state then available, Na1 and leucine exit together from the S1 site and make their way to the intracellular milieu.
From both the RAMD and MCTI simulations, the results from this study suggests that Na1 plays an escorting role for leucine transport. It should be noted that Na2 release to the intracellular milieu was not observed, as was in a previous study.24 We maintain that Na2 is likely released before Na1 and leucine. The release of Na2 to trigger transport however, may not have necessary in these simulations as the leucine was being forced out of the S1 site- either along some biased z-vector (MCTI simulations) or in some random direction (RAMD simulations).
During RAMD simulations, two main intracellular pathways were observed in LeuTAa. One pathway appears to follow down TMs 1/6 (R2I1, R2I2, R5I2) and one that follows along TMs 6b/8 (R3I1). Currently, it is difficult to say which of these intracellular pathways is the true intracellular egress route. In a movie provided in the supplemental information of Shaikh and Tajkhorshid's24 inward-facing model of LeuTAa, Na2 appears to be released along a pathway similar to the pathway observed in this study that follows TMs 6b/8. It should be noted that due to the shorter timescale of the RAMD simulations, it is likely that the discussed pathways are “ligand-induced” egress routes as opposed to “conformationally-selected” egress routes.
4.2. Insights Regarding the Dopamine Transporter
At the S1 site of DAT, we observe dopamine to be stabilized by interactions with 1F76, 1D79, 6V327 and 8S421 and fits comfortably in the binding cavity. By comparison, cocaine at the S1 site is not stabilized by any amino acid side-chain interactions and appears to be quite large for the given cavity size. This observation, in addition to the observed differences in the free energy profiles obtained from MCTI simulations, suggest that the binding site of cocaine does not overlap with that of dopamine as has been previously suggested.47 Rather, these results fall in accord with the observation of Huang et al.49 that the binding site of cocaine is located above the aromatic lid (Y156-F319) of DAT in what Huang et al. refer to as the “substrate-entry tunnel”, or what we refer to here as the S2 site.
The intracellular pathways observed for dopamine unbinding from DAT were visually similar to the two main intracellular pathways that were observed for the LeuTAa. Fewer, and less clustered intracellular pathways were sampled for dopamine from the S1 when a substrate or an inhibitor was present in the S2 pocket during RAMD simulations. While this is intuitive for cases of inhibitors (amphetamine and cocaine), this observation for the DAT:DA:DA case may suggest that DAT does not require a second substrate to be bound in the S2 pocket for transport. In fact, any bound ligand in S2 may produce an inhibitory effect. Finally, sodium transport was never observed for DAT, in either MCTI or RAMD simulations, which is consistent with observations that dopamine binds to the DAT in the absence of Na+.44,45,68
Supplementary Material
Highlights.
The binding pocket of cocaine in DAT differs from the binding pocket of dopamine.
A single sodium is co-transported with leucine during the translocation process.
Two primary intracellular escape pathways are identified for substrates of LeuTAa and DAT.
Acknowledgments
This work is supported by the National Institutes of Health, National Science Foundation, Department of Defense, and The U.S. Department of Education under award numbers 5R01DA27806-2, CHE-0723109 (MRI), and P116Z080180. This research was also supported in part by the NSF through TeraGrid resources provided by National Institute for Computational Sciences and the Pittsburgh Supercomputing Center under grant number MCB060059P.
Footnotes
Publisher's Disclaimer: This is a PDF file of an unedited manuscript that has been accepted for publication. As a service to our customers we are providing this early version of the manuscript. The manuscript will undergo copyediting, typesetting, and review of the resulting proof before it is published in its final citable form. Please note that during the production process errors may be discovered which could affect the content, and all legal disclaimers that apply to the journal pertain.
References
- 1.Hahn M, Blakely R. Monoamine transporter gene structure and polymorphisms in relation to psychiatric and other complex disorders. The Pharmacogenomics Journal. 2002;2:217–235. doi: 10.1038/sj.tpj.6500106. [DOI] [PubMed] [Google Scholar]
- 2.Ozaki N, Goldman D, Kaye W, Plotnicov K, Greenberg B, Lappalainen J, Rudnick G, Murphy D. Serotonin transporter missence mutation associated with a complex neuropsychiatric phenotype. Molecular Psychiatry. 2003;8:933–936. doi: 10.1038/sj.mp.4001365. [DOI] [PubMed] [Google Scholar]
- 3.Sutcliffe JS, Delahanty RJ, Prasad HC, McCauley JL, Han Q, Jiang L, Li C, Folstein SE, Blakely RD. Allelic heterogeneity at the serotonin transporter locus (slc6a4) confers susceptability to autism and rigid-compulsive behaivors. Am J Hum Genet. 2005;77:265–279. doi: 10.1086/432648. [DOI] [PMC free article] [PubMed] [Google Scholar]
- 4.Surratt CK, Ukario OT, Ramanujapuram S. Recognition of psychostimulants, antidepressants, and other inhibitors of synaptic neurotransmitter uptake by the plasma membrane monoamine transporters. The AAPS Journal. 2005;7:E739–E751. doi: 10.1208/aapsj070374. [DOI] [PMC free article] [PubMed] [Google Scholar]
- 5.MacDougall I, Griffith R. Pharmacophore design and database searching for selective monoamine neurotransmitter transporter ligands. Journal of Molecular Graphics and Modelling. 2008;26:1113–1124. doi: 10.1016/j.jmgm.2007.10.003. [DOI] [PubMed] [Google Scholar]
- 6.Torres GE, Gainetdinov RR, Caron MG. Plasma membrane monomaine transporters: structure, regulation and function. Nature Reviews. 2003;4:13–25. doi: 10.1038/nrn1008. [DOI] [PubMed] [Google Scholar]
- 7.Ritz MC, Volz TJ, Riddle EL, Gibb JW, Hanson GR. Cocaine receptors on dopamine transporters are related to self-administration of cocaine. Science. 1987;237:1219–1223. doi: 10.1126/science.2820058. [DOI] [PubMed] [Google Scholar]
- 8.Pacholczyk T, Blakely RD, Amara SG. Expression cloning of a cocaine- and antidepressant-sensitive human noradrenaline transporter. Nature. 1991;350:350–354. doi: 10.1038/350350a0. [DOI] [PubMed] [Google Scholar]
- 9.Saier MH. A functional-phylogenetic classification system for transmembrane solute transporters. Microbiology and Molecular Biology Reviews. 2000;64:354–411. doi: 10.1128/mmbr.64.2.354-411.2000. [DOI] [PMC free article] [PubMed] [Google Scholar]
- 10.Ramamoorthy S, Shippenberg TS, Lankupalle JD. Regulation of monoamine transporters: Role of transporter phosphorylation. Pharmacology & Therapeutics. 2011;129:220–238. doi: 10.1016/j.pharmthera.2010.09.009. [DOI] [PMC free article] [PubMed] [Google Scholar]
- 11.Gedeon PC, Indarte M, Surratt CK, Madura JD. Molecular dynamics of leucine and dopamine transporter proteins in a model cell membrane lipid bilayer. Proteins: Struct, Funct, Bioinf. 2010;78:797–811. doi: 10.1002/prot.22601. [DOI] [PMC free article] [PubMed] [Google Scholar]
- 12.Yamashita A, Singh SK, Kawate T, Jin T, Gouaux E. Nature. Vol. 437. London, U. K.: 2005. Crystal structure of a bacterial homologue of na(+) cl(-)-dependent neurotransmitter transporters; pp. 215–223. [DOI] [PubMed] [Google Scholar]
- 13.Zhou Z, Zhen J, Karpowich NK, Goetz RM, Law CJ, Reith MEA, Wang DN. Science. Vol. 317. Washington, DC, U. S.: 2007. Leut-desipramine structure reveals how antidepressants block neurotransmitter reuptake; pp. 1390–1393. [DOI] [PMC free article] [PubMed] [Google Scholar]
- 14.Celik L, Schiott B, Tajkhorshid E. Substrate binding and formation of an occluded state in the leucine transporter. Biophys J. 2008;94:1600–1612. doi: 10.1529/biophysj.107.117580. [DOI] [PMC free article] [PubMed] [Google Scholar]
- 15.Indarte M, Madura JD, Surratt CK. Dopamine transporter comparative molecular modeling and binding site prediction using the leutaa leucine transporter as a template. Proteins Struct, Funct, Bioinf. 2008;70:1033–1046. doi: 10.1002/prot.21598. [DOI] [PubMed] [Google Scholar]
- 16.Joergensen AM, Tagmose L, Joergensen AMM, Boegesoe KP, Peters GH. Molecular dynamics simulations of na+/cl–dependent neurotransmitter transporters in a membrane-aqueous system. ChemMedChem. 2007;2:827–840. doi: 10.1002/cmdc.200600243. [DOI] [PubMed] [Google Scholar]
- 17.Caplan DA, Subbotina JO, Noskov SY. Molecular mechanism of ion-ion and ion-substrate coupling in the na+-dependent leucine transporter leut. Biophys J. 2008;95:4613–21. doi: 10.1529/biophysj.108.139741. [DOI] [PMC free article] [PubMed] [Google Scholar]
- 18.Noskov SY, Roux B. Control of ion selectivity in leut: Two na+ binding sites with two different mechanisms. J Mol Biol. 2008;377:804–818. doi: 10.1016/j.jmb.2008.01.015. [DOI] [PMC free article] [PubMed] [Google Scholar]
- 19.Noskov SY. Molecular mechanism of substrate specificity in the bacterial neutral amino acid transporter leut. Proteins: Struct, Funct, Bioinf. 2008;73:851–863. doi: 10.1002/prot.22108. [DOI] [PubMed] [Google Scholar]
- 20.Shi L, Quick M, Zhao Y, Weinstein H, Javitch JA. The mechanism of a neurotransmitter:sodium symporter-inward release of na+ and substrate is triggered by substrate in a second binding site. Mol Cell. 2008;30:667–677. doi: 10.1016/j.molcel.2008.05.008. [DOI] [PMC free article] [PubMed] [Google Scholar]
- 21.Forrest LR, Rudnick G. The rocking bundle: a mechanism for ion-coupled solute flux by symmetrical transporters. Physiology. 2009;24:377–386. doi: 10.1152/physiol.00030.2009. [DOI] [PMC free article] [PubMed] [Google Scholar]
- 22.Quick M, Lund AM, Winther L Shi, Nissen P, Weinstein H, Javitch JA. Binding of an octylglucoside detergent molecule in the second substrate (s2) site of leut establishes an inhibitor-bound conformation. Proc Natl Acad Sci U S A. 2009;106:5563–5568. doi: 10.1073/pnas.0811322106. [DOI] [PMC free article] [PubMed] [Google Scholar]
- 23.Claxton DP, Quick M, Shi L, de CFD, Weinstein H, Javitch JA, McHaourab HS. Ion/substrate-dependent conformational dynamics of a bacterial homolog of neurotransmitter:sodium symporters. Nat Struct Mol Biol. 2010;17:822–9. doi: 10.1038/nsmb.1854. [DOI] [PMC free article] [PubMed] [Google Scholar]
- 24.Shaikh SA, Tajkhorshid E. Modeling and dynamics of the inward-facing state of a na+/cl- dependent neurotransmitter transporter homologue. PLoS Comput Biol. 2010;6 doi: 10.1371/journal.pcbi.1000905. [DOI] [PMC free article] [PubMed] [Google Scholar]
- 25.Shi L, Weinstein H. Conformational rearrangements to the intracellular open states of the leut and apct transporters are modulated by common mechanisms. Biophys J. 2010;99 doi: 10.1016/j.bpj.2010.10.003. [DOI] [PMC free article] [PubMed] [Google Scholar]
- 26.Zhao C, Caplan DA, Noskov SY. Evaluations of the absolute and relative free energies for antidepressant binding to the amino acid membrane transporter leut with free energy simulations. J Chem Theory Comput. 2010;6:1900–1914. doi: 10.1021/ct9006597. [DOI] [PubMed] [Google Scholar]
- 27.Zhao Y, Terry D, Shi L, Weinstein H, Blanchard SC, Javitch JA. Nature. Vol. 465. London, U. K.: 2010. Single-molecule dynamics of gating in a neurotransmitter transporter homologue; pp. 188–193. [DOI] [PMC free article] [PubMed] [Google Scholar]
- 28.Shan J, Javitch JA, Shi L, Weinstein H. The substrate-driven transition to an inward-facing conformation in the functional mechanism of the dopamine transporter. PLoS One. 2011;6 doi: 10.1371/journal.pone.0016350. [DOI] [PMC free article] [PubMed] [Google Scholar]
- 29.Zhao C, Noskov SY. The role of local hydration and hydrogen-bonding dynamics in ion and solute release from ion-coupled secondary transporters. Biochemistry. 2011;50:1848–1856. doi: 10.1021/bi101454f. [DOI] [PubMed] [Google Scholar]
- 30.Forrest LR, Zhang YW, Jacobs MT, Gesmonde J, Xie L, Honig BH, Rudnick G. Mechanism for alternating access in neurotransmitter transporters. Proc Natl Acad Sci U S A. (Early) 2008:1–6. 6. doi: 10.1073/pnas.0804659105. [DOI] [PMC free article] [PubMed] [Google Scholar]
- 31.Abramson J, Wright EM. Structure and function of na+-symporters with inverted repeats. Current Opinion in Structural Biology. 2009;19:425–432. doi: 10.1016/j.sbi.2009.06.002. [DOI] [PMC free article] [PubMed] [Google Scholar]
- 32.Jardetzky O. Simple allosteric model for membrane pumps. Nature. 1966;211:969–970. doi: 10.1038/211969a0. [DOI] [PubMed] [Google Scholar]
- 33.Xhaard H, Backstrom V, Denessiouk K, Johnson MS. Coordination of na+ by monoamine ligands in dopamine, norepinephrine, and serotonin transporters. J Chem Inf Model. 2008;48:1423–1437. doi: 10.1021/ci700255d. [DOI] [PubMed] [Google Scholar]
- 34.Singh SK, Yamashita A, Gouaux E. Nature. Vol. 448. London, U. K.: 2007. Antidepressant binding site in a bacterial homologue of neurotransmitter transporters; pp. 952–956. [DOI] [PubMed] [Google Scholar]
- 35.Singh SK, Piscitelli CL, Yamashita A, Gouaux E. Science. Vol. 322. Washington, DC, U. S.: 2008. A competitive inhibitor traps leut in an open-to-out conformation; pp. 1655–1661. [DOI] [PMC free article] [PubMed] [Google Scholar]
- 36.Zhou Z, Zhen J, Karpowich NK, Law CJ, Reith MEA, Wang DN. Antidepressant specificity of serotonin transporter suggested by three leut-ssri structures. Nat Struct Mol Biol. 2009;16:652–657. doi: 10.1038/nsmb.1602. [DOI] [PMC free article] [PubMed] [Google Scholar]
- 37.Kroncke BM, Horanyi PS, Columbus L. Structural origins of nitroxide side chain dynamics on membrane protein α-helical sites. Biochemistry. 2010;49:10045–10060. doi: 10.1021/bi101148w. [DOI] [PMC free article] [PubMed] [Google Scholar]
- 38.Piscitelli CL, Gouaux E. Insights into transport mechanism from leut engineered to transport tryptophan. The EMBO Journal. 2011;31:228–235. doi: 10.1038/emboj.2011.353. [DOI] [PMC free article] [PubMed] [Google Scholar]
- 39.Krishnamurthy H, Gouaux E. X-ray structures of leut in substrate-free outward-open and apo inward-open states. Nature. 2012;481:469–474. doi: 10.1038/nature10737. [DOI] [PMC free article] [PubMed] [Google Scholar]
- 40.Wang H, Elferich J, Gouaux E. Strcutures of leut in bicelles define conformation and substrate binding in a membrane-like context. Nat Struct Mol Biol. 2012;19:129–30. doi: 10.1038/nsmb.2215. [DOI] [PMC free article] [PubMed] [Google Scholar]
- 41.Reyes N, Tavoulari S. To be, or not to be two sites: that is the question about leut substrate binding. Journal of General Physiology. 2011;138:467. doi: 10.1085/jgp.201110652. [DOI] [PMC free article] [PubMed] [Google Scholar]
- 42.Kilty J, Lorang D, Amara SG. Clone and expression of a cocaine-sensitive rat dopamine transporter. Science. 1991;254:578–579. doi: 10.1126/science.1948035. [DOI] [PubMed] [Google Scholar]
- 43.Newman AH, Agoston G. Novel benztropine [3a-(diphenylmethoxy)tropane] analogs as probes for the dopamine transporter. Current Medicinal Chemistry. 1998;5:305–319. [PubMed] [Google Scholar]
- 44.Chen N, Sun L, Reith ME. Cationic interactions at the human dopamine transporter reveal binding conformations for dopamine distinguishable from those for the cocaine analog 2 α-carbomethoxy3α-(4-fluorophenyl)tropane. Journal of Neurochemistry. 2002;81:1383–1393. doi: 10.1046/j.1471-4159.2002.00941.x. [DOI] [PubMed] [Google Scholar]
- 45.Li LB, Cui XN, Reith ME. Is na+ required for the binding of dopamine, amphetamine, tyramine and octopamine to the human dopamine transporter? Naunyn Schmiedebergs Arch Pharmacol. 2002;365:303–311. doi: 10.1007/s00210-001-0526-6. [DOI] [PubMed] [Google Scholar]
- 46.Sen N, Shi L, Beuming T, Weinstein H, Javitch JA. A pincer-like configuration of tm2 in the human dopamine transporter is responsible for indirect effects on cocaine binding. Neuropharmacology. 2005;49:780–790. doi: 10.1016/j.neuropharm.2005.08.014. [DOI] [PubMed] [Google Scholar]
- 47.Beuming T, Kniazeff J, Bergmann ML, Shi L, Gracia L, Raniszewska K, Newman AH, Javitch JA, Weinstein H, Gether U, Loland CJ. The binding sites for cocaine and dopamine in the dopamine transporter overlap. Nat Neurosci. 2008;11:780–789. doi: 10.1038/nn.2146. [DOI] [PMC free article] [PubMed] [Google Scholar]
- 48.Kniazeff J, Shi L, Loland CJ, Javitch JA, Weinstein H, Gether U. An intracellular interaction network regulates conformational transitions in the dopamine transporter. J Biol Chem. 2008;283:17691–17701. doi: 10.1074/jbc.M800475200. [DOI] [PMC free article] [PubMed] [Google Scholar]
- 49.Huang X, Gu HH, Zha CG. Mechanism for cocaine blocking the transport of dopamine: insights from molecular modeling and dynamics simulations. Journal of Physical Chemistry:B. 2009;113:15057–15066. doi: 10.1021/jp900963n. [DOI] [PMC free article] [PubMed] [Google Scholar]
- 50.Chemical Computing Group. Molecular Operating Environment (MOE) Vol. 10. 1255 University Strteet, Suite 1600, Montreal, Quebec, Canada: 2008. [Google Scholar]
- 51.Chemical Computing Group. Molecular Operating Environment (MOE) Vol. 10. 1255 University Strteet, Suite 1600, Montreal, Quebec, Canada: 2009. [Google Scholar]
- 52.Ponder JW, Case DA. Force fields for protein simulations. Advances in Protein Chemistry. 2003;66:27–85. doi: 10.1016/s0065-3233(03)66002-x. [DOI] [PubMed] [Google Scholar]
- 53.Humphrey W, Dalke A, Schulten K. VMD: Visual Molecular Dynamics. Journal of Molecular Graphics. 1996;14:33–38. doi: 10.1016/0263-7855(96)00018-5. [DOI] [PubMed] [Google Scholar]
- 54.Thomas JR, Gedeon PC, Grant BJ, Madura JD. Leut conformational sampling utilizing accelerated molecular dynamics and principal component analysis. Biophysical Letters Accepted with minor revisions. 2012 doi: 10.1016/j.bpj.2012.05.002. [DOI] [PMC free article] [PubMed] [Google Scholar]
- 55.Hamelberg D, Mongan J, McCammon J. Accelerated molecular dynamics: A promising and efficient simulation method for biomolecules. Journal of Chemical Physics. 2004;120:11919–11929. doi: 10.1063/1.1755656. [DOI] [PubMed] [Google Scholar]
- 56.Straatsma T, McCammon J. Multiconfiguration thermodynamic integration. J Chem Phys. 1991;95:1175–1188. [Google Scholar]
- 57.Marrone TJ, Gilson MK, McCammon JA. Comparison of continuum and explicit models of solvation: potentials of mean for alanine dipeptide. Journal of Physical Chemistry. 1996;100:1439–1441. [Google Scholar]
- 58.Senn HM, Thiel S, Thiel W. Enzymatic hydroxylation in p-hydroxybenzoate hydroxylase: A case study for QM/MM molecular dynamics. Journal of Chemical Theory and Computation. 2005;1:494–505. doi: 10.1021/ct049844p. [DOI] [PubMed] [Google Scholar]
- 59.Wang Y, Kuczera K. Multidimensional conformational free energy surface exploration: helical states of Alan and Aibn peptides. Journal of Physical Chemistry:B. 1997;101 [Google Scholar]
- 60.Phillips J, Braun R, Wang W, Gumbart J, Tajkhorshid E, Villa E, Chipot C, Skeel R, Kale L, Schulten K. Scalable molecular dynamics with namd. Journal of Computational Chemistry. 2005;26:1781–1802. doi: 10.1002/jcc.20289. [DOI] [PMC free article] [PubMed] [Google Scholar]
- 61.Lüdemann SK, Lounnas V, Wade RC. How do substrates enter and products exit the buried active site of cytochrome p450cam? 1. random expulsion molecular dynamics investigation of ligand access channels and mechanisms. Journal of Molecular Biology. 2000;303:797–811. doi: 10.1006/jmbi.2000.4154. [DOI] [PubMed] [Google Scholar]
- 62.Vashisth H, Abrams CF. Ligand escape pathways and (un)binding free energy calculations for the hexameric insulin-phenol complex. Biophysical Journal. 2008;95:4193–4204. doi: 10.1529/biophysj.108.139675. [DOI] [PMC free article] [PubMed] [Google Scholar]
- 63.Carlsson P, Buredahl S, Nilsson L. Unbinding of retinoic acid from the retinoic acid receptor by random expulsion molecular dynamics. Biophysical Journal. 2006;91:3151–3161. doi: 10.1529/biophysj.106.082917. [DOI] [PMC free article] [PubMed] [Google Scholar]
- 64.Long D, Mu Y, Yang D. Molecular dynamics simulations of ligand dissociation from liver fatty acid binding protein. PLoS One. 2008;4:e6801. doi: 10.1371/journal.pone.0006081. [DOI] [PMC free article] [PubMed] [Google Scholar]
- 65.Peräkylä M. Ligand unbinding pathways from the vitamin d receptor studied by molecular dynamics simulations. European Biophysics Journal. 2009;38:185–198. doi: 10.1007/s00249-008-0369-x. [DOI] [PubMed] [Google Scholar]
- 66.Wang T, Duan Y. Ligand entry and exit pathways in the [beta]2-adrenergic receptor. Journal of Molecular Biology. 2009;392:1102–1115. doi: 10.1016/j.jmb.2009.07.093. [DOI] [PMC free article] [PubMed] [Google Scholar]
- 67.Durrant JD, de Oliveira CA. POVME: An algortihm for measuring binding-pocket volumes. Journal of Molecular Graphics and Modelling. 2011;29:773–776. doi: 10.1016/j.jmgm.2010.10.007. [DOI] [PMC free article] [PubMed] [Google Scholar]
- 68.McElvain JS, Schenk JO. A multisubstrate mechanism of striatal dopamine uptake and its inhibition by cocaine. Biochem Pharmacol. 1992;43:206–222. doi: 10.1016/0006-2952(92)90178-l. [DOI] [PubMed] [Google Scholar]
Associated Data
This section collects any data citations, data availability statements, or supplementary materials included in this article.