

Abstract
For cryo-EM structural studies we seek to image membrane proteins as single particles embedded in proteoliposomes. One technical difficulty has been the low density of liposomes that can be trapped in the ~100 nm ice layer that spans holes in the perforated carbon support film of EM grids. Inspired by the use of two-dimensional (2D) streptavidin crystals as an affinity surface for biotinylated DNA (Crucifix et al., 2004), we propose to use the crystals to tether liposomes doped with biotinylated lipids. The 2D crystal image also serves as a calibration of the image formation process, providing an absolute conversion from electrostatic potentials in the specimen to the EM image intensity, and serving as a quality control of acquired cryo-EM images. We were able to grow streptavidin crystals covering more than 90% of the holes in an EM grid, and which remained stable even under negative stain. The liposome density in the resulting cryo-EM sample was uniform and high due to the high-affinity binding of biotin to streptavidin. Using computational methods, the 2D crystal background can be removed from images without noticeable effect on image properties.
Keywords: 2D crystal, nano-support, cryo-EM, liposome, tethering
1. Introduction
Membrane proteins are involved in many essential biological processes, such as ion and solute transport, energy conversion, and cell signaling. Despite their pivotal roles, only about 170 unique membrane protein structures have been identified (Raman et al., 2006), as compared with over 46,000 known structures for soluble proteins, due to the difficulty of forming crystals for X-ray or electron crystallography. Recently, single-particle electron cryomicroscopy (cryo-EM) has been used to study structures of membrane proteins solubilized in detergents. With the use of detergents, however, there always arises the question of whether the native conformation is maintained.
A natural way to preserve the native conformation of membrane proteins for structural study is to reconstitute them into liposomes (lipid vesicles). The resulting proteoliposomes are applied to perforated carbon films, fast-frozen and imaged using cryo-EM, and we expect that the three-dimensional structure can be reconstructed from the cryo-EM images (Jiang et al., 2001).
During our attempts to image proteoliposomes, we found that there were two technical difficulties. First, the density of proteoliposomes varies with ice thickness and adsorptive forces, so that they are found predominantly near the edges of holes in the perforated carbon film where the quality of acquired images is poor. Second, when only microgram quantities of the membrane protein are available, the proteoliposome concentration is low and few images are obtained. Inspired by the immobilization of biotinylated DNA on two-dimensional (2D) streptavidin crystals (Crucifix et al., 2004), we sought to use these crystals to tether proteoliposomes decorated with biotinylated lipids, which will be valuable to increase the proteoliposome density in acquired cryo-EM images.
Streptavidin, synthesized by Streptomyces avidinii, is a 15 kDa protein of 159 residues (Sano et al., 1995). It is proteolyzed naturally at both ends, and the most stable and well-studied form of this protein (called core-streptavidin) contains 125 to 127 residues. The atomic structure was first determined independently by Weber et al (Weber et al., 1989) and Hendrickson et al. (Hendrickson et al., 1989) using x-ray diffraction. Other forms (full length, biotin-bound complex and mutants) have been studied extensively by X-ray diffraction (Freitag et al., 1997; Freitag et al., 1999; Izrailev et al., 1997) and by electron crystallography (Avila-Sakar and Chiu, 1996; Darst et al., 1991; Kubalek et al., 1991; Le Trong et al., 2006; Wang et al., 1999). The crystal structures show that the protein is a homotetramer of identical subunits with a D2 symmetry. Each subunit contains a β-barrel with the biotin-binding site located at one end. The 2D crystal has a unit cell with a=b=8.23 nm, and γ=90° (Avila-Sakar and Chiu, 1996). Due to the mirror symmetry in the projection map, the reflection spots with indices h+k=2n+1 are absent; thus in projection the crystal appears to have a square lattice with a=b=5.82 nm and γ=90°. We use these parameters in analyzing our projection images.
The 2D streptavidin crystal has been shown to be readily picked up by an EM grid coated with a holey carbon film (Avila-Sakar and Chiu, 1996; Crucifix et al., 2004; Kubalek et al., 1991), and crystal sizes up to a few μm2 have been observed (Crucifix et al., 2004; Kubalek et al., 1991). Crystals fast-frozen in vitreous ice show electron diffraction to atomic resolution (Avila-Sakar and Chiu, 1996), and the 2D crystals can also serve as tethering surfaces, for example for tethering of biotinylated DNA molecules (Crucifix et al., 2004). These authors demonstrated that the crystal information can be removed computationally, allowing 3D models to be obtained by single-particle reconstruction to a resolution of 3 nm.
In the experiments described here, we use this 2D crystal as a nano-support and a tethering template for liposomes, and as a built-in reference for the calibration of the image formation process.
2. Methods
2.1 Growth of 2D streptavidin crystals
Streptavidin was purchased from Sigma-Aldrich (St Louis, MO). Biotinylated dipalmitoyl-phosphatidyethanolamine (biotin-DPPE) and dioleyl-phosphatidlycholine (DOPC) (Avanti, Alabaster, AL) were used as received. Two-dimensional streptavidin crystals were grown at room temperature using a procedure similar to that described by Kubalek et al. (Kubalek et al., 1991). 67 μl of Tris buffer (150 mM NaCl, 50 mM Tris, pH 7.0) containing 0.05–0.40 mg/ml of streptavidin was deposited in a micro-well formed by a polypropylene PCR tube cap. Then 0.5–1.5 μl of a 0.5 mg/ml chloroform/hexane (1:1) solution of biotin-DPPE and DOPC, at a mass ratio of 1:4, was spread on the surface of the protein solution. The PCR caps were placed in a humid chamber and kept at room temperature for 2–20 hrs. A standard 400-mesh EM grid coated with a perforated carbon film made by the stamping method (Chester et al., 2007), was washed with hexane and dried in air for an hour, and then was placed onto the surface of a well for one minute. It was withdrawn, washed with 3 droplets (25 μl) of Tris buffer, and was either negatively stained or frozen for examination by electron microscopy.
2.2 Preparation and tethering of liposomes
Diphytanoyl phosphatidylcholine (DPhPC) (Avanti, Alabaster, AL) was used as received. DPhPC and biotin-DPPE (3600:1 mol/mol) were mixed in chloroform, dried under nitrogen, and re-hydrated in HEPES-buffered KCl solution (135 mM KCl, 5 mM NaCl, 1 mM EDTA, 10 mM HEPES, pH=7.4) to a concentration of 2.9 mg/ml. The lipid suspension was frozen and thawed 10 times, and extruded through an 80-nm polycarbonate membrane filter (Whatman) using a Lipex™ extruder (Northern Lipids Inc.) (Mayer et al., 1986). We expect there to be about 16 biotin-DPPE molecules in each 80 nm liposome. To obtain highly spherical liposomes, we swelled them by repeated osmotic shocks, adding water to the liposome suspension (11%, 14%, 18%, 24% and 33% of the original volume) at 1 hour intervals at room temperature.
After the 2D streptavidin crystal was transferred to the perforated carbon film, the crystal was incubated with liposome suspensions for 0.5–16 minutes, depending on the desired liposome density on the grid. Then the grid was washed with two droplets (25 μl) of 2 times diluted HEPES-buffered KCl solution and one droplet (25 μl) of 3 times diluted HEPES-buffered KCl solution, after which either a negative stain or cryo-EM sample was prepared. For negative stain, 2% uranyl acetate was applied to the sample and blotted away after 1 minute. For a cryo-EM sample, the grid was side-blotted briefly to remove excess KCl solution, and then 6 μl of 5 times diluted HEPES-buffered KCl solution was applied to the grid, and blotted away for 2–5 s using a slip of filter paper (Whatman) at room temperature. The specimen was rapidly frozen by plunging into liquid ethane and stored in liquid nitrogen.
2.3 EM imaging
Images of liposomes within the holes in the carbon film were taken at Brandeis University using a Tecnai F30 microscope at 300 keV with a 30 μm objective aperture and a Gatan Imaging Filter (GIF). The electron dose for each exposure was 1000–3000 e/nm2. Images were taken at 50,000 magnification and 0.2–4.5 μm defocus, and recorded on the GIF 2K × 2K UltraScan 1000 FT (Frame Transfer) camera with an effective pixel size of 0.253 nm. Some data were taken at Yale University using a Tecnai F20 electron microscope at 200 keV using a 20 μm or 30 μm objective aperture. The dose for each exposure was about 2000 e/nm2. Images were taken at 25,000 or 50,000 magnification and 2.0–3.3 μm defocus and recorded on Kodak SO-163 film. Negatives were scanned with a Zeiss SCAI film scanner to an effective pixel size 0.28 nm.
2.4 MD simulations of the solvated streptavidin crystal
MD simulations of the streptavidin crystal were performed on the Bulldog-I computer cluster at Yale University using NAMD2.6 (Kale et al., 1999) with version 27 of the CHARMM force field. The structure of a streptavidin monomer was obtained from the atomic coordinates (PDB code: 1STP). However, because the quaternary structure of the tetramer in 2D crystals differs from that in 3D crystals, we constructed a tetramer (Fig. 1A) by docking monomers to match the high-resolution projection map of the 2D crystal (Avila-Sakar and Chiu, 1996). Water molecules (TIP3) were added around the tetramer to a thickness of about 2 nm in all directions: in total 23,260 water molecules were added, resulting in a system of 76,765 atoms in a cubic box with periodic boundaries. After energy minimization with a conjugate gradient for 10,000 steps, the system was subjected to 0.5 ns of constant pressure and temperature (NPT) simulations (1fs per integration step) at 1 bar and 300 K using the Nosé-Hoover method. The cutoff distance for van der Waals interactions was 1.2 nm, with the pair list distance extended to 1.35 nm. The long-range full electrostatic interactions were evaluated every time step using the particle mesh Ewald method. Harmonic constraints were applied to maintain the tetramer structure, while the water molecules were allowed to move freely. The mean number-density of each atom type was obtained by averaging the trajectories of the last 0.2 ns of the simulation.
Fig. 1.
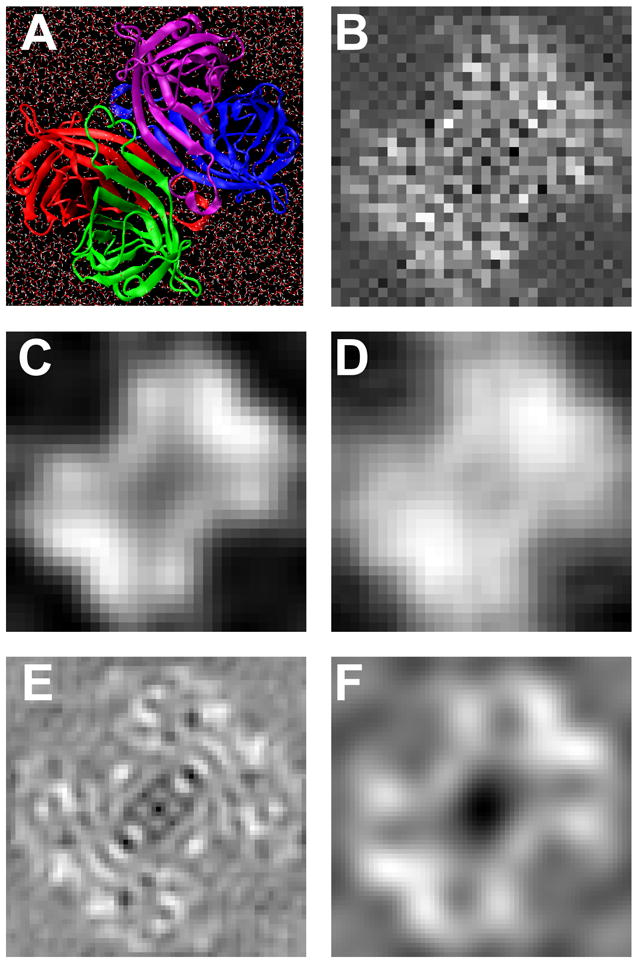
(A) Molecular representation of the hydrated streptavidin tetramer. (B) Projection map (32×32 pixels with a pixel size of 0.182 nm); (C) Projection map was Gaussian-filtered with a half power at 1/1.3 nm−1; (D) Data-derived projection map by merging reflections computed from two images taken at 0.5 and 4.5 μm defocus (shown in Fig. 6) to a resolution of 1/1.3 nm−1. (E) Projection map from electron crystallography (Avila-Sakar and Chiu, 1996), also shown in (F), Gaussian-filtered with a half power at 1/1.3 nm−1. The images are 5.82 nm square.
From the projection ρi(x, y) of the atom density along the z direction we computed the neutral-atom phase shift φn (units of mrad) of electrons passing through the specimen according to
| (1) |
Here Vi is the spatially-integrated, shielded coulomb potential for an isolated, neutral atom (Vi = 0.025, 0.130, 0.108, 0.097, and 0.267 V·nm3 for hydrogen, carbon, nitrogen, oxygen and phosphorous respectively, calculated from published parameters (Kirkland, 1998)); and the interaction parameter σe describes the first-order dependence of the electron phase on the projected electrostatic potential (7.3 and 6.5 mrad/V·nm for 200 and 300 keV electrons respectively) (Kirkland, 1998). The resulting projection maps (Figs. 1B and C) are used as a model for one unit cell of the crystal. The average internal potential is 5.6 and 7.1 V, which for 300 keV electrons results in an electron phase shift of 36.5 and 46.2 mrad per nm of path length for the water and protein regions respectively. In total, there is about 48 mrad more electron phase shift for an electron passing through the 5 nm thick streptavidin protein region than through the neighboring water region.
2.5 Calibration of the image formation process
In cryo-EM, the image intensity is a reflection of the electron phase shift due to electrostatic potentials, including the internal potentials of the atoms in the specimen. In the weak-phase approximation, the Fourier transform Î(s) of the image intensity I(x,y) is most readily expressed in terms of the two-dimensional spatial frequency s, as
| (2) |
where Î0 is the mean image intensity and δ(s) is the two dimensional Dirac delta function. The function φ̂(s) is the Fourier transform of the specimen’s spatially-varying electron phase shift φ(x,y). In the weak-phase approximation, this is the same as the quantum mechanical electron scattering amplitude. The “weak phase” CTF c also depends on the magnitude s of the spatial frequency s according to
| (3) |
Here both the effects of the defocus Δz (underdefocus is taken to be positive) and the spherical aberration coefficient Cs of the objective lens are included. The parameter α, not part of the weak-phase theory, accounts for the observation of a small amount of amplitude contrast in cryo-EM images. (Eqn. (3) is identical to a more conventional expression for the CTF,
given that sin α= Q. Typical values for α are in the range 0.05 to 0.1.)
The scaling factor m is theoretically equal to 1, but in practice it takes a smaller value and varies with spatial frequency; we model it as
| (4) |
where B is the overall amplitude decay factor; it corresponds to the “temperature factor” used in X-ray crystallography, but numerically is one-fourth the value of the latter.
2.6 Determination of CTF parameters
Two methods were used to estimate the defocus and other parameters of the contrast-transfer function (CTF). When a region of carbon film was captured in a cryo-EM image, the CTF parameters were obtained by fits to circularly-averaged image power spectra from this region under the assumption that the amorphous carbon is an object with constant power spectrum in the spatial frequency range of 1/3–1 nm−1. The fit was performed with a Matlab program, and because it assumed no astigmatism, only images with no visible astigmatism were used. From images containing streptavidin crystal, the defocus Δz was determined by minimizing the total number of computed reflections having the wrong phases compared with the atomic model of the 2D crystal. The B factors were determined using Eq. (4) under the assumption that the overall amplitude decay accounts for the decrease of m with spatial frequency. All image processing and other calculations were done in the Matlab programming environment.
3. Results
3.1 Tethering of liposomes
As shown in Fig. 2A, liposomes adsorb to the carbon film and are excluded from the center of the holes in typical cryo-EM samples. To produce a homogeneous distribution of liposomes, 2D streptavidin crystals were employed as a nano-support. As shown in Fig. 2B, POPC liposomes doped with a few biotin-DPPE molecules distributed uniformly over the holes in a perforated carbon film. The crystalline support has a thickness of about 7 nm including the streptavidin and lipids (Fig. 2C), which is thinner than conventional “ultra-thin” carbon films (Gao et al., 2002). Furthermore, the scattering from this substrate is in a periodic rather than random pattern, so that the information can be computationally removed. The overall effect is reduced background noise from the support film.
Fig. 2.

Tethering of liposomes onto 2D crystals. Cryo-EM images of liposomes with no supporting structures (A) and with the 2D crystal nano-support (B). (C) Scale drawing of the tethering system. The 2D crystal layer (5.0 nm) is bound to a lipid monolayer (2.5 nm) which spans a hole in the perforated carbon film (15–30 nm in thickness). A liposome with a small diameter (45 nm) is diagrammed here. Liposomes prefer to stay near the edge of the holes in regular cryo-EM samples. When the 2D streptavidin crystal was used, a homogeneous distribution of liposomes was obtained.
Another benefit of the nano-support arises from the essentially irreversible binding between the 2D crystal and the biotin-DPPE molecules in the liposomes. By varying the incubation time between the liposome suspension and the crystal, the surface density of liposomes can be adjusted as desired (Fig. 3). This is essential for the study of membrane proteins reconstituted into liposomes. Usually, it is difficult to produce large quantities of membrane proteins, resulting in proteoliposome suspensions with low concentrations. The high specific binding enhances the attachment of proteoliposomes onto the nano-support, allowing smaller quantities of reconstituted protein to be used. Compared with a glow discharged carbon film, the average surface density of liposomes was about 2 times higher on the 2D crystal (Fig. 3F).
Fig. 3.

Liposome tethering kinetics. EM images of negatively stained 2D streptavidin crystal (spanning holes in the perforated carbon film) with tethered liposomes (POPC liposomes doped with biotin-DPPE) at low (A), intermediate (B) and high (C–D) magnification. The incubation time in (C) and (D) are 0.5 and 1.0 min respectively. (E) EM images of negatively stained liposomes on a glow-discharged continuous carbon film with an incubation time of 4.0 min. (F) The dependence of the average liposome density on the incubation time. The lines represent the liposome density on 2D crystal (solid line) and carbon film (dashed line), respectively.
3.2 Optimization of crystal growth conditions
Successful use of the 2D crystals depends on the fulfillment of several requirements. Firstly, the crystals have to cover most of the EM grid, so that they will be present in most micrographs. Secondly, the crystal domain size must be large enough in order to have a uniform crystalline pattern in each ~2 μm-diameter hole. Thirdly, the process of growing and transferring the crystals must be reproducible.
Several crystal growth conditions were investigated. We found that when the growth time was short (e.g. 2 hrs), the average crystal domain size decreased as the streptavidin concentration in the subphase under the biotinylated lipid monolayer was increased from 0.05 to 0.2 mg/ml (Figs. 4A, B and C). However, the average domain size increased with the protein concentration when the growth time was 6 hrs, as shown in Fig. 4D. With an overnight growth at a protein concentration of 0.2 mg/ml, individual crystal domains were usually large enough to cover entire 2 μm-diameter holes. Furthermore, the 2D crystal layer covered more than 90% of the holes in an EM grid, and remained intact even in negative stain, as shown in Fig. 3A.
Fig. 4.

Protein concentration and crystal growth time effects on the crystal size. EM images show the negatively stained crystal grown from (A) 0.2 mg/ml (B) 0.1 mg/ml (C) 0.05 mg/ml of streptavidin solutions for 2 hours at room temperature. The black curves outline the domain boundaries, the arrow shows the crystal orientation in each region, and each inset is a 3× closeup of the adjacent region. (D) The dependence of average single crystal size on the protein concentration and growth time. The crystal growth time was varied from 2 hr (dashed line) to 6 hr (solid line) and overnight (data not shown, but the crystal covered entire 2 μm-diameter holes for 0.2 mg/ml of protein concentration). The error bar is the standard deviation of crystal sizes.
3.3 Subtraction of the 2D crystal
A simple method was employed by Crucifix et al. to remove the periodic signal from images (Crucifix et al., 2004). Basically, the image was Fourier transformed to reciprocal space, the peaks on the reciprocal lattice were masked out, and then the inverse Fourier transform was performed. This simple method did not introduce artifacts to a 3D reconstruction of RNA polymerase to 3.0 nm resolution. We applied this method to simulated data of a liposome on the 2D crystal, and found that setting the pixels in the neighborhood of the lattice peaks to a locally averaged amplitude and phase, instead of zero, restores the liposome information better. This improved method was used to remove the crystal information from the cryo-EM images.
Firstly, a cryo-EM image (1024×1024 or 2048×2048 pixels) (Fig. 5) was Fourier transformed. Then a mask having the same reciprocal lattice as the 2D crystal, with a 3-pixel-radius disc at each lattice point, was applied to the Fourier transform. There are several ways to assign values to the masked Fourier pixels, but we found that the following method worked as well as any: the values at the masked points were scaled to be equal to the local background value, computed as the rms of an annulus (inner and outer radii 3 and 4 pixels) surrounding the spot (Fig. 5E) while the phases of those pixels were left unchanged. As shown in Figs. 5C and E, there was no visible crystal residue left in the resultant liposome image.
Fig. 5.

Effect of the crystal lattice removal process on the images of DPhPC liposomes tethered on the 2D crystal. (A) Cryo-EM image of liposomes tethered to a 2D crystal. (B–C) Cryo-EM image of an individual liposome before and after the removal of crystal information. The images were Gaussian-filtered (half power at 2.0 nm) for display. (D–E) The center quarter of the power spectrum of the image before and after masking the spots. (F) Circularly averaged experimental liposome image contrast w (dots) compared with model (line). The image was taken on film, without energy filtering, using the Tecnai F20 electron microscope at 200 keV. The defocus was 2.20 μm and the B factor was estimated to be 1.86 nm2.
As one test of this improved removal method, the circularly-averaged image intensity from DPhPC liposomes was compared with the quantitative model we used previously (Wang et al., 2006). The agreement was excellent, and the estimated values of the dipole potential, 640 ±180 mV, 23 liposomes, which relies on details of the membrane profile, were in good agreement with the published value (510 ± 70 mV, 16 liposomes).
3.4 Quantitative analysis of the crystal and the image formation process
3.4.1 Quantitative model of the 2D crystal
With a quantitative model of the 2D crystal, we wish to calibrate the image formation process by estimating the scaling factor m(s) that multiplies the theoretical CTF (Eq. (2)). The model of the 2D crystal was obtained from a MD simulation of a hydrated streptavidin tetramer (Fig. 1A). In building the tetramer we used the high-resolution projection map determined from electron crystallography and imaging (Avila-Sakar and Chiu, 1996) to inform the docking of the streptavidin monomers. We then used neutral-atom scattering amplitudes to compute the projection map of the 2D crystal model (Fig. 1B). The neutral-atom amplitudes do not completely account for electron scattering from molecules (Wu and Spence, 2003; Zhong et al., 2002). However, lacking a complete parameterization of the scattering from molecular orbitals, we take the neutral-atom factors as a first approximation. The lowpass-filtered version of the model (Fig. 1C) is seen to be similar to the projection map we obtained from a pair of crystal images (Fig. 1D). In addition, our model matches the fine details of the published projection map (Avila-Sakar and Chiu, 1996; compare Figs. 1B and E) although it has much higher intensity in the center of the unit cell when it is filtered (Figs. 1C and F).
3.4.2 Unbending of the 2D crystal
The 2D crystal is strong macroscopically (it survived the harsh negative staining process as shown in Fig. 3A), but fragile microscopically (it shows distortions in the image and the 2D lattice, as shown in Figs. 6C–F). To restore the order of the 2D crystal and increase the signal-to-noise ratio (SNR), an “unbending” (Henderson et al., 1986) technique was implemented in Matlab and applied to the cryo-EM images to achieve higher resolution in 2D crystal structures. Using a Gaussian-windowed reference image containing about 4–16 unit cells from the crystal, a cross-correlation with the micrograph identified the locations of unit cells in a given crystal domain. This lattice served as the reference points for a bilinear interpolation of the location of each micrograph pixel into a new, scaled-up image with 32 × 32 pixels per unit cell. The pixel mapping therefore accounted for both translational and rotational errors in each unit cell. The unbending process increased the SNR of the computed diffraction spots by a factor of 2–10. To quantify the quality of the unbent crystal, IQ maps (Henderson et al., 1986) were calculated and are shown in Figs. 6G and H. Following Henderson et al., we calculate SNR as the ratio of the spot amplitude, after background subtraction, to the rms background. A projection map was generated by merging the data from images at two defocus values (0.5 and 4.5 μm). As shown in Fig. 1D, the data-derived projection map was in good agreement with the lowpass filtered MD model (Fig. 1C).
Fig. 6.

Crystal analysis. (A–B) Overview of images (529 nm square) at 0.52 and 4.54 μm defocus. (C–D) Corresponding close-up of 20×20 unit cells; (E–F) Displacements of centers of arrays of 2×2 unit cells from positions predicted based on a perfect lattice. Vectors are magnified by a factor of 50. (G–H) IQ plots. The solid circles show resolution of 2.0 and 1.0 nm, and the circles in thin line show the CTF zero positions. The size of the symbols is proportional to the strength of the spot, and the numbers are IQ values. The definition of IQ follows Henderson et al (Henderson et al., 1986). As a guideline, an IQ number of 7 (marked by the smallest symbols) is equivalent to a signal-to-noise ratio (SNR) of 1, and an IQ number of 2 is equivalent to a SNR of 3.5. The SNR was calculated as the ratio of the spot amplitude to the rms background value.
3.4.3 Determination of the factor m
The m factor is the ratio of the observed image contrast to that expected from the phase contrast mechanism. We write the real-space image intensity from a 2D crystal as
| (5) |
where the contrast w(x,y) in a square unit cell of dimension a is related to the Fourier amplitudes ŵ(h, k) by
| (6) |
From Eq. (2) the observed Fourier amplitudes ŵ(h,k) are related to the unit cell structure factors f̂(h, k) by
| (7) |
with the magnitude s of the spatial frequency given by . The mean electron intensity, I0, was measured directly from the cryo-EM image taken with a CCD camera and the IMOD software (Kremer et al., 1996), which preserves the pixel read-out values. The structure factors f̂(h, k) were determined from the crystal model generated in Section 2.4. With known CTF parameters and the measurement of the observed Fourier amplitudes, the m factor was determined. To suppress the effect of noise (weak spots) and weak signal (near minima in the CTF), only the strong spots in the Fourier transform of the cryo-EM image were included in the calculation; these amplitudes are displayed in Figs. 7A and B. Because of the centrosymmetric nature of the projection image, the phases are expected to be either 0 or 180°; only the real parts of the computed reflections ŵ(h, k) were considered, and these were flipped in polarity according to the model, leaving the modulations due to the CTF. Specifically, compared in the figures are the data and model Fourier amplitudes computed as
Fig. 7.

Determination of m factors. (A–B) Comparison of the computed reflections from cryo-EM images taken at 0.52 and 4.54 μm defocus and from the model. The real parts of the observed Fourier amplitudes were flipped according to the polarity of the model structure factors, resulting in polarities that reflect the alternating polarities of the CTF. Model structure factors were multiplied by the CTF (with B set to zero). The labels are reflection indices, and the numbers in parenthesis are the spatial frequencies in units of nm−1 corresponding to the reflections. The oval in (B) marks reflection spots having inverted phases compared with the model. (C–D) Contrast-transfer function c corresponding to the images above. The red crosses mark the spatial frequencies of the major reflections and demonstrate the polarity reversals. (E–F) Determination of m0 and B. The solid line is the fitted Gaussian function, with B = 1.42 and 1.54 nm2 respectively. The labels are spatial frequencies in nm−1, and in parentheses are the numbers of computed reflections averaged in each group.
| (8) |
After accounting for the CTF, the m factors were determined as the ratios w̃obs/w̃model at various spatial frequencies and plotted in Figs. 7E and F. We found that values of m decreased as the spatial frequency increased.
Fig. 7B shows two occurrences of weak structure factors having the wrong phases, where the model and experimental values have opposite polarities. The occurrence of the wrong phases was about 1 in 30 for strong amplitudes used in the determination of m factors. It is possible that the wrong phases were due to the MD model since the crystal contacts between unit cells were not included in the MD simulation. However, the current dataset did not provide the ability to assess that possibility. Inverting the phase of the corresponding spots in the MD model image only show minor effects (less than 0.02% of the variance of the pixels), and the changes are distributed throughout the unit cell.
3.4.4 Determination of CTF parameters
The process used to determine m factors was also used to determine the CTF parameters from local regions of cryo-EM images. Estimates of defocus and B could be obtained from regions as small as 200 unit cells, about 100 × 100 nm in size, within holes in the carbon film. The defocus values were determined by minimizing the total number of structure factors having the wrong phases compared with the atomic model. Images taken on film, which due to the larger area included both the holes and the surrounding carbon films, allowed a comparison to be made with the defocus values and B-factors determined from the amorphous carbon surrounding the holes. The defocus values were similar, as shown in Fig. 8C; there was however a discrepancy in B values obtained by the two methods.
Fig. 8.

Analysis of m factors and CTF parameters. (A) m factors from 9 cryo-EM images recorded on a CCD camera using a Tecnai F30 with the defocus from 0.5 to 4.7 μm. The B factor determined from the least-squares fit of a Gaussian function (solid line) is 1.55 nm2. (B) Values of m in four frequency bands (indicated in panel A) as a function of ice thickness, for which the logarithm of beam attenuation serves as a surrogate. Ice thickness does not seem to affect m in these images obtained with an energy filter. (C) Comparison of defocus values determined from crystals and from carbon film. (D) Comparison of B factors determined from crystal and carbon film. The data for (C) and (D) was collected using the Tecnai F20 microscope and recorded on film.
From the carbon-film images the B values were determined by weighted least-squares fitting of the rotationally-averaged power spectrum. Let ϕ̂(s) be the Fourier transform of the scattering due to the carbon film. From eqns. (2) and (4) the power spectrum of an image of the carbon film will be
| (9) |
Commonly the assumption is made that the carbon film represents “white noise”, so that its intrinsic power spectrum |ϕ̂(s)|2 is independent of the frequency s. In this case the decay of ripples (Thon rings) in the power spectrum arises entirely from the exponential function. We found that B values obtained by fitting eqn. (9) to image power spectra are consistently larger than those obtained from analysis of crystals (Fig. 8D). The discrepancy could arise from the assumption of a flat power spectrum of the carbon film. If |ϕ̂(s)|2 actually decreases with frequency the value of B will be overestimated unless this decay is taken into account.
3.4.5 Application of the calibration process
In our previous study (Wang et al., 2006) we performed an absolute calibration of the image formation process using an MD model of a lipid bilayer and applying it to images of liposomes. We now test the calibration from the streptavidin crystal by using it to scale the image of a liposome for direct comparison with theory. Starting with the model image of a streptavidin unit cell, we imposed the CTF and used a least-squares fit to obtain the conversion factor m0 from the scattering amplitude to the image intensity. This conversion factor was used to convert the liposome image contrast to that expected in the case of ideal phase contrast. The theoretical contrast was meanwhile predicted from the lipid-bilayer MD data with the inclusion of the intra-membrane dipole potential as determined previously (Wang et al., 2006). Fig. 5F shows that the agreement between prediction and experiment are excellent, with no parameters being adjusted.
4. Discussion
In this paper we have demonstrated the use of streptavidin crystals both as tethering substrate and as a reference object for image calibration and quality measurement. As shown here and by other researchers (Avila-Sakar and Chiu, 1996; Crucifix et al., 2004; Kubalek et al., 1991), crystals of sufficient quality can readily be grown over holes in a perforated carbon film. We also show that the crystal images can be used to determine contrast-transfer function (CTF) parameters and provide an absolute calibration of the image-formation process.
Streptavidin crystal growth using the lipid monolayer method involves two main processes (Blankenburg et al., 1989). One is the specific binding of streptavidin molecules to the biotin group in biotin-DPPE, and the other is the lateral diffusion of the biotin-streptavidin complexes. The competition of these two processes determines the average crystal domain size. When the protein concentration is low, the interval between successive binding events is long and the bound biotin-streptavidin complexes have more time to diffuse and join existing crystal domains. When the protein concentration is high, there is not enough time for the nascent complex to join existing crystal domains, and the average domain size remains small. This is exactly what was shown in Fig. 4. However, when the crystal growth time is long enough, the small domains will slowly transform to have the same orientation as their neighbors and thus the crystal size increases. For overnight growth of the crystal, the average crystal size was several square microns, which was large enough to cover 2 μm-diameter holes in the carbon film.
Yoshina et al. have demonstrated the use of DNA hybridization to tether liposomes onto glass-supported bilayers (Yoshina-Ishii and Boxer, 2006; Yoshina-Ishii et al., 2005). We tried a similar idea to tether liposomes onto a lipid monolayer. However, the lipid monlayerwas not strong enough to survive the transfer and fast freezing processes. Only about 20% of the holes were covered with the lipid monolayers. Therefore, only the 2D streptavidin crystal was used in this study.
With the extremely specific binding of the streptavidin to biotin (Kd ≈ 10−15 M), the surface density of the tethered liposome inside the holes in a cryo-EM sample was much higher than that without the use of the 2D crystal, and about 2 times higher than the that on glow discharged continuous carbon film (Fig. 3F).
A crucial question in cryo-EM is how to evaluate the quality of individual particle images, because their quality is the major factor in high-resolution single-particle reconstructions. As shown by Gao et al (Gao et al., 2002), a large variability in image quality can exist within a single micrograph. As a built-in reference, the streptavidin crystal provides a direct measurement of the image quality. One can employ a simple image quality control method in which only the images showing “higher-order” reflection spots (say, better than 1 nm) are chosen for further processing. The value of the streptavidin crystal as a quality reference might turn out to be useful even in situations where the particles being imaged are not tethered to the crystal.
In the calibration process an atomic model of the 2D streptavidin crystal was required. It is common to use the atomic coordinates of proteins to build simulated cryo-EM images. These models are however always in error because they lack the surrounding water molecules which largely match the protein’s electron scattering and therefore decrease the contrast at the molecular boundary. We built a new streptavidin tetramer model (Fig. 1C) to match the projection map of the 2D crystal (Avila-Sakar and Chiu, 1996), placed it into a box of water molecules, and carried out an MD simulation to produce a realistic interface between protein and water. A projection map computed from the MD model of the unit cell was in good agreement with the experimental projection map (Fig. 1D).
There is always a concern about the flatness of a 2D crystal. For example, the 2D n-paraffin crystal (~ 4.5 nm thick) could be tilted to about 5 degrees before the reflection spot intensity began to fall off (Henderson and Glaeser, 1985). We investigated the effect of tilting on the m factors by computationally tilting the MD model of the 2D crystal. Tilting up to 10 degrees had no effect on m0, while tilts larger than 10 degrees changed the reflection pattern and inverted some phases. Comparison of the computed reflections between the cryo-EM image and the simulated tilted image leads us to conclude that the crystals analyzed here had tilts of less than 10 degrees.
The scaling factor of the image formation process m0 was found to be in the range of 0.2 to 0.5, disappointingly below unity but consistent with previous quantitative measurements by Henderson and Glaeser (Henderson and Glaeser, 1985). In their work, the structure factors of the 2D crystal were determined from electron diffraction patterns, and compared with structure factors obtained from EM images of the 2D crystal. The structure factor ratios (m factors in this paper) of purple membrane decreased from 0.60 to 0.04 as the spatial frequency increased from 1/2.7 to 1/0.4 nm−1. The authors attributed the small m factors to a reduction in contrast due to inelastic scattering of electrons. In the present work, we employed an energy filter to eliminate inelastically scattered electrons from the images that we used in estimating m. Nevertheless, the value of m0 remained only about half the expected value. The neutral atom scattering assumption that underlies our theoretical projection map might affect the magnitude of the determined m0, but we believe the effect is unlikely to be as large as a factor of two.
The discrepancy is reminiscent of the contrast mismatch factor or “Stobbs factor” in materials science (Howie, 2004; Hÿtch and Stobbs, 1994). This factor is the reciprocal of m0 in our notation; in a recent careful analysis of energy-filtered images of silicon crystals it ranged from 1.5 to 2.3 (Du et al., 2007). The contrast mismatch was thought to arise in thermal diffuse scattering of electrons, in which the small electron energy losses, less than 1eV, do not allow discrimination by energy filtering.
5. Conclusion
The present work demonstrates the benefits of using a 2D streptavidin crystal as a nano-support for cryo-EM studies of liposomes and proteoliposomes. The crystal growth conditions have been optimized to grow reproducibly high quality 2D crystals, which covered more than 90% of the holes on an EM grid. The average crystal domain was large enough to cover an individual hole (a few μm2). Due to the high specific binding between streptavidin and biotin, the required amount of proteoliposomes was small (a few micrograms for a cryo-EM specimen), and the resulting surface density of the tethered proteoliposomes was adjustable via the incubation time of the proteoliposomes with the 2D crystal. The crystal also served as an internal calibration of the image formation process.
Acknowledgments
We thank Drs. Nikolaus Grigorieff and Chen Xu (Department of Biochemistry, Brandeis University) for making available the Tecnai F30 electron microscope and for their help with data collection. We also thank Dr. Wah Chiu (Baylor College of Medicine, Houston, Texas) for providing the structure factors of the 2D streptavidin crystal; Andrew Barthel for the help with crystal growth experiments; Dr. David Chester for discussions of tethering strategies using 2D crystals; and Yi Chen for contributions to the image processing programs. The molecular dynamics simulations made use of the Yale University Life Sciences Computing Center, supported by NIH grant RR19895. Our work was supported by NIH Grant NS21501 to F.J.S.
Footnotes
Publisher's Disclaimer: This is a PDF file of an unedited manuscript that has been accepted for publication. As a service to our customers we are providing this early version of the manuscript. The manuscript will undergo copyediting, typesetting, and review of the resulting proof before it is published in its final citable form. Please note that during the production process errors may be discovered which could affect the content, and all legal disclaimers that apply to the journal pertain.
References
- Avila-Sakar AJ, Chiu W. Visualization of beta-sheets and side-chain clusters in two-dimensional periodic arrays of streptavidin on phospholipid monolayers by electron crystallography. Biophysical Journal. 1996;70:57–68. doi: 10.1016/S0006-3495(96)79597-8. [DOI] [PMC free article] [PubMed] [Google Scholar]
- Blankenburg R, Meller P, Ringsdorf H, Salesse C. Interaction Between Biotin Lipids And Streptavidin In Monolayers - Formation Of Oriented Two-Dimensional Protein Domains Induced By Surface Recognition. Biochemistry. 1989;28:8214–8221. doi: 10.1021/bi00446a037. [DOI] [PubMed] [Google Scholar]
- Chester DW, Klemic JF, Stern E, Sigworth FJ, Klemic KG. Holey carbon micro-arrays for transmission electron microscopy: A microcontact printing approach. Ultramicroscopy. 2007;107:685–691. doi: 10.1016/j.ultramic.2007.01.004. [DOI] [PubMed] [Google Scholar]
- Crucifix C, Uhring M, Schultz P. Immobilization of biotinylated DNA on 2-D streptavidin crystals. Journal Of Structural Biology. 2004;146:441–451. doi: 10.1016/j.jsb.2004.02.001. [DOI] [PubMed] [Google Scholar]
- Darst SA, Ahlers M, Meller PH, Kubalek EW, Blankenburg R, Ribi HO, Ringsdorf H, Kornberg RD. Two-dimensional crystals of streptavidin on biotinylated lipid layers and their interactions with biotinylated macromolecules. Biophysical Journal. 1991;59:387–396. doi: 10.1016/S0006-3495(91)82232-9. [DOI] [PMC free article] [PubMed] [Google Scholar]
- Du K, von Hochmeister K, Phillipp F. Quantitative comparison of image contrast and pattern between experimental and simulated high-resolution transmission electron micrographs. Ultramicroscopy. 2007;107:281–292. doi: 10.1016/j.ultramic.2006.08.003. [DOI] [PubMed] [Google Scholar]
- Freitag S, LeTrong I, Klumb L, Stayton PS, Stenkamp RE. Structural studies of the streptavidin binding loop. Protein Science. 1997;6:1157–1166. doi: 10.1002/pro.5560060604. [DOI] [PMC free article] [PubMed] [Google Scholar]
- Freitag S, Chu V, Penzotti JE, Klumb LA, To R, Hyre D, Le Trong I, Lybrand TP, Stenkamp RE, Stayton PS. A structural snapshot of an intermediate on the streptavidin-biotin dissociation pathway. Proceedings of the National Academy of Sciences of the United States of America. 1999;96:8384–8389. doi: 10.1073/pnas.96.15.8384. [DOI] [PMC free article] [PubMed] [Google Scholar]
- Gao H, Spahn CMT, Grassucci RA, Frank J. An assay for local quality in cryo-electron micrographs of single particles. Ultramicroscopy. 2002;93:169–178. doi: 10.1016/s0304-3991(02)00157-2. [DOI] [PubMed] [Google Scholar]
- Henderson R, Glaeser RM. Quantitative analysis of image contrast in electron micrographs of beam-sensitive crystals. Ultramicroscopy. 1985;16:139–150. [Google Scholar]
- Henderson R, Baldwin JM, Downing KH, Lepault J, Zemlin F. Structure of purple membrane from halobacterium halobium: recording, measurement and evaluation of electron micrographs at 3.5 A resolution. Ultramicroscopy. 1986;19:147–178. [Google Scholar]
- Hendrickson WA, Pahler A, Smith JL, Satow Y, Merritt EA, Phizackerley RP. Crystal-Structure Of Core Streptavidin Determined From Multiwavelength Anomalous Diffraction Of Synchrotron Radiation. Proceedings Of The National Academy Of Sciences Of The United States Of America. 1989;86:2190–2194. doi: 10.1073/pnas.86.7.2190. [DOI] [PMC free article] [PubMed] [Google Scholar]
- Howie A. Hunting the Stobbs factor. Ultramicroscopy. 2004;98:73–79. doi: 10.1016/j.ultramic.2003.08.002. [DOI] [PubMed] [Google Scholar]
- Hÿtch MJ, Stobbs WM. Quantitative comparison of high resolution TEM images with image simulations. Ultramicroscopy. 1994;53:191–203. [Google Scholar]
- Izrailev S, Stepaniants S, Balsera M, Oono Y, Schulten K. Molecular dynamics study of unbinding of the avidin-biotin complex. Biophysical Journal. 1997;72:1568–1581. doi: 10.1016/S0006-3495(97)78804-0. [DOI] [PMC free article] [PubMed] [Google Scholar]
- Jiang QX, Chester DW, Sigworth FJ. Spherical reconstruction: A method for structure determination of membrane proteins from cryo-EM images. Journal Of Structural Biology. 2001;133:119–131. doi: 10.1006/jsbi.2001.4376. [DOI] [PubMed] [Google Scholar]
- Kale L, Skeel R, Bhandarkar M, Brunner R, Gursoy A, Krawetz N, Phillips J, Shinozaki A, Varadarajan K, Schulten K. NAMD2: Greater Scalability for Parallel Molecular Dynamics. Journal of Computational Physics. 1999;151:283–312. [Google Scholar]
- Kirkland EJ. Advancd Computing in Electron Microscopy. Plenum Press; New York: 1998. [Google Scholar]
- Kremer JR, Mastronarde DN, McIntosh JR. Computer visualization of three-dimensional image data using IMOD. Journal of Structural Biology. 1996;116:71–76. doi: 10.1006/jsbi.1996.0013. [DOI] [PubMed] [Google Scholar]
- Kubalek EW, Kornberg RD, Darst SA. Improved Transfer Of 2-Dimensional Crystals From The Air-Water-Interface To Specimen Support Grids For High-Resolution Analysis By Electron-Microscopy. Ultramicroscopy. 1991;35:295–304. doi: 10.1016/0304-3991(91)90082-h. [DOI] [PubMed] [Google Scholar]
- Le Trong L, Humbert N, Ward TR, Stenkamp RE. Crystallographic analysis of a full-length streptavidin with its C-terminal polypeptide bound in the biotin binding site. Journal Of Molecular Biology. 2006;356:738–745. doi: 10.1016/j.jmb.2005.11.086. [DOI] [PubMed] [Google Scholar]
- Mayer LD, Hope MJ, Cullis PR. Vesicles Of Variable Sizes Produced By A Rapid Extrusion Procedure. Biochim Biophys Acta. 1986;858:161–168. doi: 10.1016/0005-2736(86)90302-0. [DOI] [PubMed] [Google Scholar]
- Raman P, Cherezov V, Caffrey M. The membrane protein data bank. Cellular And Molecular Life Sciences. 2006;63:36–51. doi: 10.1007/s00018-005-5350-6. [DOI] [PMC free article] [PubMed] [Google Scholar]
- Sano T, Pandori MW, Chen X, Smith CL, Cantor CR. Recombinant core streptavidins. A minimum-sized core streptavidin has enhanced structural stability and higher accessibility to biotinylated macromolecules. Journal of Biological Chemistry. 1995;270:28204–28209. doi: 10.1074/jbc.270.47.28204. [DOI] [PubMed] [Google Scholar]
- Wang L, Bose PS, Sigworth FJ. Using cryo-EM to measure the dipole potential of a lipid membrane. PNAS. 2006;103:18528–18533. doi: 10.1073/pnas.0608714103. [DOI] [PMC free article] [PubMed] [Google Scholar]
- Wang SW, Robertson CR, Gast AP. Two-dimensional crystallization of streptavidin mutants. Journal Of Physical Chemistry B. 1999;103:7751–7761. [Google Scholar]
- Weber PC, Ohlendorf DH, Wendoloski JJ, Salemme FR. Structural Origins Of High-Affinity Biotin Binding To Streptavidin. Science. 1989;243:85–88. doi: 10.1126/science.2911722. [DOI] [PubMed] [Google Scholar]
- Wu JS, Spence JCH. Structure and bonding in alpha-copper phthalocyanine by electron diffraction. Acta Crystallographica Section A: Foundations of Crystallography. 2003;59:495–505. doi: 10.1107/S0108767303016866. [DOI] [PubMed] [Google Scholar]
- Yoshina-Ishii C, Boxer SG. Controlling two-dimensional tethered vesicle motion using an electric field: Interplay of electrophoresis and electro-osmosis. Langmuir. 2006;22:2384–2391. doi: 10.1021/la0526277. [DOI] [PMC free article] [PubMed] [Google Scholar]
- Yoshina-Ishii C, Miller GP, Kraft ML, Kool ET, Boxer SG. General method for modification of liposomes for encoded assembly on supported bilayers. Journal of the American Chemical Society. 2005;127:1356–1357. doi: 10.1021/ja043299k. [DOI] [PubMed] [Google Scholar]
- Zhong SJ, V, Dadarlat M, Glaeser RM, Head-Gordon T, Downing KH. Modeling chemical bonding effects for protein electron crystallography: the transferable fragmental electrostatic potential (TFESP) method. Acta Crystallographica Section A. 2002;58:162–170. doi: 10.1107/s0108767301020256. [DOI] [PubMed] [Google Scholar]