

Abstract
Full-field measurement of deformation in biological structures such as bones is a promising experimental approach for study of the spatial heterogeneity in mechanical behavior. With the advent of high-resolution, 3-D imaging, digital volume correlation (DVC) allows for the measurement of spatially heterogeneous, 3-D deformation fields throughout entire volumes. For bones such as the vertebra, use of DVC to detect the onset and progression of failure is of direct relevance to the study of osteoporotic fractures. Application of DVC to whole bones, as opposed to machined specimens of bone tissue, involves additional challenges such as the irregular geometry, large data sets, and decreased signal-to-noise ratio. These challenges are addressed in this paper, and the DVC method that results is used to examine yield and post-yield deformations in vertebral compression experiments.
Keywords: image correlation, full-field measurement, vertebra, spine fracture, deformation
1. Introduction
Vertebral fractures are the hallmark of osteoporosis, yet the failure mechanisms involved in these fractures are not well understood. Failure patterns within whole vertebrae are typically estimated from finite element analyses or from images acquired after fracture has occurred. Full-field, experimental measurement of deformations sustained by vertebrae during injurious loading would enable direct visualization of vertebral failure mechanisms as well as the possibility of validating the results of numerical simulations of vertebral fracture. As such, these full-field measurements would have far-reaching impact on predictions of bone failure and on study of the effects of aging, disease, and drug-treatments on failure mechanics in bone.
Several prior studies have used micro-computed tomography (μCT), a high-resolution, 3-D imaging method, in conjunction with mechanical testing to examine full-field deformations in specimens of bone tissue or in whole, intact bones. Initial studies provided only qualitative investigations of the deformations but did demonstrate the tremendous heterogeneity in the deformation fields that occur in trabecular bone and the existence of statistical correlations between the locations of large deformations and characteristics of the local trabecular structure [1–4]. Two of these studies also examined whether, for compression [4] and torsion [3], the apparent-level (macroscale) modulus and strength were different between the stepwise loading that is necessary to allow μCT imaging and the case of continuous loading. No differences were found. Quantitative data on full-field deformations can be garnered by applying methods of volumetric digital image correlation (VDIC), also known as digital volume correlation (DVC), to the image series [5, 6]. Bay et al. extended their own 2-D image correlation approach [7] to 3-D and quantified the accuracy and precision of this 3-D method for cylindrical specimens of human trabecular bone [5, 7]. With this approach, the accuracy of deformation fields predicted by finite element analysis was also assessed [8]. Liu and Morgan [9] subsequently evaluated several different approaches to DVC for multiple types of trabecular bone and found that the accuracy and precision depended on bone type, with the lowest errors for human vertebral trabecular bone and for a global DVC approach. Most recently, Hardisty et al. [10] performed a validation study for DVC applied to simulated deformations in an intact rat vertebra and, similar to previous studies [5, 9], found that the errors are approximately ten to 20 times lower than the yield strain of trabecular bone.
Collectively, the results of the aforementioned studies indicate that DVC is a promising approach for quantitative, full-field measurement of deformations in bone. However, no experimental DVC measurements have been reported for whole, intact bones, as opposed to isolated specimens of trabecular bone. DVC in whole bones involves additional challenges such as the irregular geometry of the volume, the large data sets, and the decreased signal-to-noise ratio that can occur when imaging specimens as large as human vertebrae or proximal femora. As such, the goal of this study was to develop a DVC-based method for whole, intact, human vertebral bodies. The specific objectives were: (1) to quantify the accuracy and precision of this method; and (2) to use this method to characterize failure patterns throughout entire vertebrae as these vertebrae are compressed to failure.
2. Materials and Methods
2.1. Specimen Preparation
Thirty spine segments consisting of L1 with adjacent inter-vertebral discs were harvested from fresh-frozen spines (age range: 41–91 years, mean ± SD: 79.9 ± 11.3, 14 female and 16 male) by making a transverse cut just above the inferior endplate of T12 and another transverse cut just below the superior endplate of L2. The posterior elements were removed in order to allow the spine segment to fit within the loading device whose size was the maximum allowable for the μCT imaging system. The spine segments were kept hydrated at all times and were wrapped in saline-soaked gauze at −20°C when not in use.
2.2. Mechanical Testing and Imaging
The top and bottom endplates of each specimen were potted in circular dishes filled with 2–4 mm of polymethylmethacrylate (PMMA), and the specimen was placed in a radiolucent cup that fits within a custom-designed radiolucent loading device (Fig. 1A). A 22-kN load cell (LLB450, Futek Advanced Sensor Technology, Irvine, CA) was placed in the loading device beneath the specimen and was connected to a digital reader to record the axial load applied at each load increment. The cup was filled with 60% saline and 40% of 25% ethyl alcohol to hydrate the specimen while also slowing decomposition. After ten cycles of preconditioning to 400 N, the vertebra was scanned via μCT (μCT80, Scanco Medical, Brüttisellen, Switzerland) at a resolution 37 μm/voxel. The settings for voltage, current and integration time were 70 kVp, 114 mA, and 300 ms, respectively. The specimen was then compressed axially by turning the top screw cap in a stepwise fashion (1 step = 1 mm applied at 0.25mm/sec). Following a 20-minute hold period to allow for the load to equilibrate, the specimen was imaged at each step using the same settings as the initial scan. Stepwise loading was continued until ultimate load was reached. The specimen was then unloaded and scanned once more.
Fig. 1.
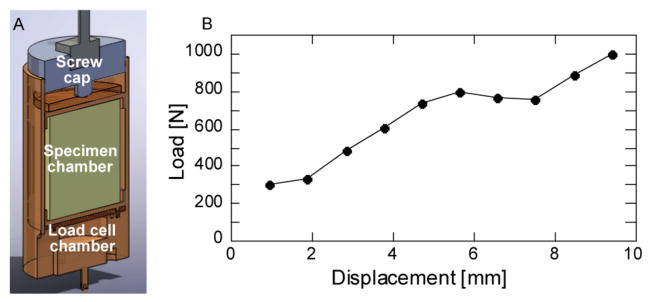
(a) Section view of loading device (load cell and spine segment not shown), (b) Representative load-displacement curve
2.3. Digital Volume Correlation
Given that the geometry of the human vertebra is irregular and varies from one sample to the next, a method for defining the sub-regions to be used for DVC was developed that would take into account the specimen-specific geometry. Use of this method would ensure that all sub-regions would be contained within the bone. Surfaces (*.stl files) of the vertebral body were generated by tracing the outer boundary of the vertebra on each image slice of a scan (IPL, Scanco Medical) (Fig. 2A,B). Image scaling and filtering were applied in order to produce smooth surfaces with reasonable file size (scale factor = 10; Gaussian filter: σ = 2, marching cubes algorithm with average number of vertices iterations = 2). An irregular mesh consisting of hexahedral elements and that conforms to the geometry of the vertebral body was then generated in IA-FEM (The University of Iowa, Iowa City, IA) (Fig. 2C). The elements of this mesh were the sub-regions that were used for the DVC calculations. The elements were of side length ~4.8 mm such that the DVC results would represent continuum-level deformation fields [11].
Fig. 2.
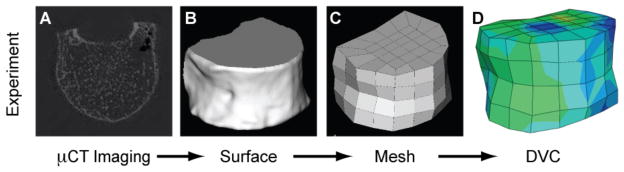
Schematic for generating the 3-D, irregularly shaped volume to be used for DVC analyses of whole vertebral bodies
Pairs of image sets (e.g., images from preload and first load increment, preload and second load increments, etc., or, alternatively, first and second load increments, second and third load increments, etc.) were analyzed using a two-stage DVC technique. In the first stage, the image pairs were aligned with each other using rigid-body image registration (IPL FE, Scanco Medical). The effect of this registration was to remove the rigid-body motion of the vertebra that occurred due to compression of the lower intervertebral disc between the two loading increments being analyzed. In the second stage, a maximum likelihood estimation (MLE) method, which is a gradient-based, iterative optimization technique, was used to calculate the displacement fields. This method was selected based on our prior work that found superior performance for this method as compared to subset-based, cross-correlation and normalized cross-correlation methods in human vertebral trabecular bone [9]. In the MLE method, the nodal displacements were calculated by finding the displacement field u(x) that minimizes the functional π [9, 12]:
| (1) |
where I1 and I2 are image intensities, Ω is image domain, dΩ = dxdydz, and α is a regularization parameter to penalize large displacement gradients [12]. Minimization was carried out using the Gauss-Newton method. An initial guess for nodal displacements is required for this optimization approach. In this study, an initial guess of zero was used since the large component of the displacement due to rigid body motion was removed from the first stage of this DVC technique. Linear interpolation was used for u(x) such that the displacement could vary in a linear manner throughout each element. Strains were then computed from the displacement data using the final nodal displacements and the interpolation functions (Fig. 2D). All calculations using MLE method were performed on a supercomputing system (IBM LS21 blade servers, each with two quad-core 3.0GHz processors sharing 16GB RAM) and required approximately five hours of run-time for each image pair.
The strength of the penalty that is the second term of Eq. 1 depends on the magnitude of α. The appropriate value of α depends on the range of intensity within an image and noise level. To determine the value that would be used for the present study, image sets of known displacement fields, created by artificially shifting image sets by 0, 1, 5, and 10 pixels, were analyzed using different values for α. The value that yielded the most accurate displacement field was chosen as the optimal value. Once this value was chosen, the images with simulated displacement fields were used to assess the accuracy and the precision of the MLE method by calculating the mean bias and root mean square errors, respectively. Errors were also assessed by performing two repeated μCT scans of a vertebra, applying an artificial shift to the second scan, and then performing the two-stage DVC technique on this pair of images.
3. Results
The mean-bias error and root-mean-square error for the displacement were less than 0.025% and 0.35% respectively. However, the mean ± standard deviation of displacement and strain calculated from the case in which the pair of repeated scans was used to simulate a displacement were 21 ± 41 μm and 740 ± 630 με, respectively. This latter estimate of the displacement error corresponded to 0.58 ± 1.12 voxels.
The results of the DVC analyses of the compression experiments revealed that at loading increments close to and just past the yield and ultimate points, high compressive, principal strains were mainly localized near the endplates. These high strains then diffused inward in opposing cone shapes towards the mid-transverse plane (Fig. 3A). Following the ultimate point (Fig. 3B), more of the trabecular bone near the endplates was subjected to higher strains, while the circumference of the mid-transverse plane remained relatively undeformed.
Fig. 3.

Incremental minimum principal strains (strains produced only by the given load increment) shown for two vertebrae: For each sample, the strains are plotted on the vertebra with the anterior right quadrant removed for viewing purposes (top row) and with the right half removed (bottom row) for the load increments marked “A” and “B” on the load-displacement curve. For increment A, the changes in vertebral height are 0.28 mm and 0.75 mm, for Samples I and II, respectively, which corresponds to “global”, incremental strains of −0.011 mm/mm and −0.032 mm/mm, respectively. Similarly for increment B, the global, incremental strains were −0.035 mm/mm and −0.038 mm/mm, respectively. The minimum cross-sectional areas of the two vertebrae were 8.43 mm2 and 23.68 mm2 for Samples I and II, respectively.
In contrast to minimum principal strain, the distributions of each of the normal strain components were more irregular (Fig. 4). Both tensile and compressive normal strains were observed and were generally located near the endplates and circumferential surface. As expected, the highest strain magnitudes were along the superior-inferior direction (z-direction).
Fig. 4.

Incremental normal strain components (strains produced only by the given load increment) shown for two vertebrae. For each sample, the strains are plotted on the vertebra (anterior right quadrant removed for viewing purposes) for the load increment marked “*”on the load-displacement curve.
4. Discussion
In this study a full-field, experimental measurement technique was developed that allows for direct experimental measurement of displacements and strains throughout irregularly shaped volumes such as human vertebrae. This two-stage DVC technique was then used to quantify and visualize deformation patterns throughout human vertebrae as these bones were loaded to failure ex vivo in axial compression, The deformation patterns indicated that vertebral failure, as defined by the yield and ultimate points on the force-deformation curve, occurs as pronounced deformation of the endplates and neighboring trabecular bone and that the deformation progresses inward in a relatively symmetric fashion. This deformation pattern is consistent with a “bi-concave fracture”, which is a type of vertebral deformity that is commonly observed in patient X-rays [13, 14]. This similarity in deformation pattern indicates that the experimental approach presented in this study can provide a mechanistic explanation to the development of biconcave vertebral fractures as well as a means of investigating correspondence between loading conditions and fracture patterns for the full range of vertebral deformities that are observed clinically.
This study introduces an improvement to prior approaches to studying the origin of vertebral fractures. By using DVC together with step-wise loading, we were able to provide some temporal data on the deformation patterns, thereby identifying how a biconcave fracture may initiate and progress. Examination of deformation patterns only after fracture has occurred, such as by either quantitative [7] or qualitative [15] examination of X-rays, would not provide any data on failure initiation. In addition, the DVC results revealed relatively low strains in the cortical shell of the vertebra near the mid-transverse plane. The combination of low strains in this region and the cone-shaped deformation patterns in the interior trabecular bone (Fig. 3) is very similar to deformation fields reported in finite element studies of the vertebra [16], and suggests that the cone-shaped patterns arise either because the trabecular bone in the mid-transverse plane is stiffer than that in other planes or because the cortical shell bears a high fraction of the applied load at this plane. The results also show substantial spatial inhomogeneity in the normal strain components (Fig. 4). Although a uniaxial load was applied to the spine segments, which contain the L1 vertebra and adjacent intervertebral discs, the load distribution across the endplates of the L1 vertebra may not be uniform. How the applied load is transferred to the vertebra depends on parameters such as the quality of the inter-vertebral discs, and the size and shape of osteophytes (“bone spurs”), if present. Inhomogeneity in the strain fields can thus result from a non-uniform load distribution as well as material anisotropy and material inhomogeneity.
This study also has some limitations. The estimates of the accuracy and precision errors of the DVC method were relatively low when computed using simulated images; however, when computed for a pair of repeated scans—a situation that takes into account x-ray beam fluctuations, repositioning errors, and other sources of noise—the errors were much higher. Specifically, the displacement error was nearly 0.5 voxels, and the strain error was just under 10% of the uniaxial compressive yield strain of trabecular bone (−0.77% in compression [17]). These errors are higher than those reported in prior DVC analyses of specimens of trabecular bone [9] and of a rat vertebra [10]. The discrepancy is likely due to two factors. The first is that with the μCT scanner that was used in the present study, achieving a nominal image resolution of 37 μm/voxel required “splitting” each element of the scanner’s CCD detector such that each element provided four separate measurements rather than one average measurement (the typical case). The drawback of this approach is decreased signal-to-noise ratio. The second factor is that when imaging a whole bone, the presence of the comparatively high-attenuation cortical shell on the exterior of the bone can result in decreased signal in the trabecular core. An additional limitation of this study is that the temporal resolution in the DVC data was coarse, providing only approximately two deformation fields in the yield and ultimate regions combined. Smaller loading increments, each with a μCT scan, would address this problem; however, we were limited to approximately 12 loading increments in this study because of the perishable nature of the spine segments and the long duration of the scans.
In spite of these limitations, the measurements obtained in this study demonstrate that DVC applied to entire human vertebral bodies is not only possible but also very revealing as to the potential pathogenesis of clinically observed vertebral fractures. The deformation patterns that were measured corresponded closely to commonly observed fracture patterns and also give support to the accuracy of some prior finite-element predictions of deformation mechanisms. Together, these findings indicate that quantitative, full-field, experimental measurement of deformation in whole bones can provide new insights into the initiation and propagation of failure. These insights may lead to more sensitive and specific indicators of vertebral fracture risk.
Acknowledgments
Funding was provided by NSF BES 0521255 (EFM), NIH R01 AR054620 (EFM), the International Osteoporosis Foundation and Servier Research Group (EFM), and the BU/CIMIT Applied Healthcare Fellowship (AIH). The authors also thank Drs. Assad Oberai and Kadin Tsing.
Nomenclature
- μCT
micro-computed tomography
- DVC
digital volume correlation
- π
objective function
- u(x)
displacement field
- I1, I2
image intensities of for example pre-load and first load increment
- x
nodal displacement
- Ω
image domain
- α
regularization parameter
References
- 1.Nazarian A, Muller R. Time-lapsed microstructural imaging of bone failure behavior. J Biomech. 2004;37(1):55–65. doi: 10.1016/s0021-9290(03)00254-9. [DOI] [PubMed] [Google Scholar]
- 2.Müller R, Gerber SC, Hayes WC. Micro-compression: a novel technique for the nondestructive assessment of local bone failure. Technology and Health Care. 1998;6(5–6):433–444. [PubMed] [Google Scholar]
- 3.Nazarian A, Bauernschmitt M, Eberle C, Meier D, Müller R, Snyder BD. Design and validation of a testing system to assess torsional cancellous bone failure in conjunction with time-lapsed micro-computed tomographic imaging. Journal of Biomechanics. 2008;41(16):3496–3501. doi: 10.1016/j.jbiomech.2008.09.014. [DOI] [PubMed] [Google Scholar]
- 4.Nazarian A, Stauber M, Zurakowski D, Snyder BD, Müller R. The interaction of microstructure and volume fraction in predicting failure in cancellous bone. Bone. 2006;39(6):1196–1202. doi: 10.1016/j.bone.2006.06.013. [DOI] [PubMed] [Google Scholar]
- 5.Bay BK, Smith TS, Fyhrie DP, Saad M. Digital volume correlation: three-dimensional strain mapping using x-ray tomography. Experimental Mechanics. 1999;39(3):217–226. [Google Scholar]
- 6.Leclerc H, PÈriÈ JN, Roux S, Hild F. Voxel-Scale Digital Volume Correlation. Experimental Mechanics. :1–12. [Google Scholar]
- 7.Bay BK. Texture correlation: a method for the measurement of detailed strain distributions within trabecular bone. J Orthop Res. 1995;13(2):258–267. doi: 10.1002/jor.1100130214. [DOI] [PubMed] [Google Scholar]
- 8.Zauel R, Yeni Y, Bay B, Dong X, Fyhrie D. Comparison of the linear finite element prediction of deformation and strain of human cancellous bone to 3D digital volume correlation measurements. Journal of Biomechanical Engineering. 2006;128:1. doi: 10.1115/1.2146001. [DOI] [PubMed] [Google Scholar]
- 9.Liu L, Morgan EF. Accuracy and precision of digital volume correlation in quantifying displacements and strains in trabecular bone. J Biomech. 2007;40(15):3516–3520. doi: 10.1016/j.jbiomech.2007.04.019. [DOI] [PMC free article] [PubMed] [Google Scholar]
- 10.Hardisty MR, Whyne CM. Whole Bone Strain Quantification by Image Registration: A Validation Study. Journal of Biomechanical Engineering. 2009;131:064502. doi: 10.1115/1.3127249. [DOI] [PubMed] [Google Scholar]
- 11.Harrigan TP, Jasty M, Mann RW, Harris WH. Limitations of the continuum assumption in cancellous bone. Journal of Biomechanics. 1988;21(4):269–275. doi: 10.1016/0021-9290(88)90257-6. [DOI] [PubMed] [Google Scholar]
- 12.Richards MS. Quantitative Three Dimensional Elasticity Imaging. Boston University; 2007. [Google Scholar]
- 13.Hurxthal LM. Measurement of anterior vertebral compressions and biconcave vertebrae. American Journal of Roentgenology. 1968;103(3):635. doi: 10.2214/ajr.103.3.635. [DOI] [PubMed] [Google Scholar]
- 14.Genant HK, Wu CY, Vankuijk C, Nevitt MC. Vertebral Fracture Assessment Using a Semiquantitative Technique. Journal of Bone and Mineral Research. 1993;8(9):1137–1148. doi: 10.1002/jbmr.5650080915. [DOI] [PubMed] [Google Scholar]
- 15.Wilson D, Myers E, Mathis J, Scribner R, Conta J, Reiley M, Talmadge K, Hayes W. Effect of augmentation on the mechanics of vertebral wedge fractures. Spine. 2000;25(2):158–165. doi: 10.1097/00007632-200001150-00004. [DOI] [PubMed] [Google Scholar]
- 16.Eswaran SK, Gupta A, Adams MF, Keaveny TM. Cortical and trabecular load sharing in the human vertebral body. J Bone Miner Res. 2006;21(2):307–314. doi: 10.1359/jbmr.2006.21.2.307. [DOI] [PubMed] [Google Scholar]
- 17.Morgan EF, Keaveny TM. Dependence of yield strain of human trabecular bone on anatomic site. Journal of Biomechanics. 2001;34(5):569–577. doi: 10.1016/s0021-9290(01)00011-2. [DOI] [PubMed] [Google Scholar]