Abstract
Biotrophic plant pathogenic fungi differentiate specialized infection structures within the living cells of their host plants. These haustoria have been linked to nutrient uptake ever since their discovery. We have for the first time to our knowledge shown that the flow of sugars from the host Vicia faba to the rust fungus Uromyces fabae seems to occur largely through the haustorial complex. One of the most abundantly expressed genes in rust haustoria, the expression of which is negligible in other fungal structures, codes for a hexose transporter. Functional expression of the gene termed HXT1 in Saccharomyces cerevisiae and Xenopus laevis oocytes assigned a substrate specificity for d-glucose and d-fructose and indicated a proton symport mechanism. Abs against HXT1p exclusively labeled haustoria in immunofluorescence microscopy and the haustorial plasma membrane in electron microscopy. These results suggest that the fungus concentrates this transporter in haustoria to take advantage of a specialized compartment of the haustorial complex. The extrahaustorial matrix, delimited by the plasma membranes of both host and parasite, constitutes a newly formed apoplastic compartment with qualities distinct from those of the bulk apoplast. This organization might facilitate the competition of the parasite with natural sink organs of the host.
A large number of plant pathogenic fungi causing severe yield losses in crop plants are obligate biotrophic parasites such as the mildew fungi, rust fungi, and smut fungi. These parasites live in close contact with their hosts and differentiate special interfaces within the living plant cells. These so-called haustoria are considered to be sites of exchange of information and nutrients between fungus and host plant (1–3). Uptake of nutrients at this interface has been under debate since the discovery of haustoria (4). A detailed characterization of the postulated nutrient uptake mechanisms has been hampered by the fact that fully developed haustoria are formed exclusively in planta, and that their purification leads to a loss of function (5). Therefore, haustoria have been studied mostly by cytological techniques (6–8). These studies provided indirect evidence for a role of haustoria in nutrient uptake without conclusive proof. Only for powdery mildew do we have some evidence that haustoria serve as sugar uptake devices (reviewed in ref. 9).
Molecular biology, however, opened a new dimension to investigate the role(s) of haustoria. An earlier study by our group revealed more than 30 in planta-induced genes (PIGs) that were expressed preferentially in haustoria (10). In this paper, we report on the identification of an additional in planta-induced gene, HXT1. Its gene product, HXT1p, shows homology to a variety of hexose transporters. We present a molecular analysis of the gene, including its regulation and a functional characterization of the HXT1-encoded protein, with cytological data indicating its exclusive localization in the haustorial plasma membrane. The biochemical qualities of HXT1p and its localization suggest that the haustorial complex serves as a new sink, enabling the parasite to compete for host nutrients.
Materials and Methods
Cultivation of Plant and Rust Fungus.
Cultivation of Vicia faba cv. con Amore, inoculation with Uromyces fabae uredospores, germination of spores, and growth of in vitro-grown infection structures were performed as described (10, 11).
Nucleic Acid Manipulations.
Isolation of RNA from infected leaves, infection structures, and isolated haustoria as well as total DNA extraction from germinated spores were performed according to Hahn and Mendgen (10). The haustorium-specific cDNA and genomic DNA libraries were constructed as described (10). Standard molecular procedures were performed according to standard protocols (12). Yeast transformation was done as described (13). Nonradioactive hybridization experiments were performed according to protocols by Roche Diagnostics, except for Northern hybridizations which were done according to Hahn and Mendgen (10). Signal detection was performed with anti-digoxigenin-Ab alkaline-phosphatase conjugate (Roche Diagnostics), CSPD as substrate, and autoradiography. Sequencing was done by using the Big-Dye Terminator Cycle Sequencing Ready Reaction M (PE Applied Biosystems, Foster City, CA) on an ABI 377 HT automated sequencer (GATC, Konstanz, Germany).
Nucleic Acid and Amino Acid Analysis.
Sequencing data were evaluated and analyzed by using CHROMAS 1.45 (Technelysium, Helensvale, Australia) and dna-star (DNAstar, Madison, WI). Homology searches were performed by using the blast algorithm (14). For phylogenetic analysis, sequences were aligned manually by using must (15). Analysis was performed by using the puzzle (16), protml (17), paup (18), and treecon (19) programs.
Plasmid Constructions.
Plasmids pDR195∷HXT1 and pDR195∷HXT1inv were constructed by digesting the full-length cDNA clone λgt10∷HXT1 with NotI and ligation into plasmid pBluescript II KS(+) (Stratagene), followed by transformation into Escherichia coli strain TG1 (20). Plasmid pBluescript II KS(+)∷HXT1 was digested with NotI and ligated into vector pDR195 (21). This procedure yielded plasmids pDR195∷HXT1 and pDR195∷HXT1inv, both containing the complete ORF with HXT1 in the correct or the antisense orientation, respectively.
Plasmids pET32a(+)∷HXT1-M and pET32a(+)∷HXT1-C were constructed by introducing unique BamHI- and HindIII-restriction sites into HXT1 by means of PCR. DNA segments HXT1-M [hydrophilic loop between transmembrane segments (TMS) 6 and 7] and HXT1-C (hydrophilic C terminus after TMS 12) were cloned separately into vector pET32a(+) (Novagen), yielding two independent His-tagged HXT1 fusion proteins.
For electrophysiology experiments, the complete HXT1 ORF was cut out of plasmid pBluescript II KS(+)∷HXT1 via a HindIII/PvuII double digest and ligated into vector pBF1 (W. Frommer, Tübingen, Germany), resulting in plasmid pBF1∷HXT1.
Expression of His-Tagged HXT1p Fusion Proteins and Ab Generation.
Overexpression of fusion proteins encoded by plasmids pET32a(+)∷HXT1-M and pET32a(+)∷HXT1-C was done by using E. coli strain BL21(DE3) and induction with isopropyl β-d-thiogalactoside (22). Purification of the fusion proteins was performed by using immobilized metal ion affinity chromatography under denaturing conditions according to the manufacturers protocol (The QIAexpressionist; Qiagen, Hilden, Germany). Abs were obtained by repeated injection of rabbits with purified fusion protein. Sera, S651 for HXT1p-M and S650 for HXT1p-C, were purified in a two- step procedure. S651 was purified first by negative adsorption against immobilized HXT1p-C fusion protein to remove undesired Abs, including anti-His-Tag Abs. The flow through was collected and applied to a column containing immobilized HXT1p-M fusion protein for a positive adsorption. Adsorbed HXT1p-M-specific Abs were eluted with 2-column volumes of 50 mM glycine/HCl (pH 2.2) and immediately neutralized. S650 serum was processed accordingly with the order of the columns reversed. Purified Abs, S651p for HXT1p-M and S650p for HXT1p-C, were specific for HXT1p in Western blots and immunocytochemistry.
Transport Assays.
Analyses were performed essentially as described (23). Cells grown for 8 h at 30°C in synthetic complete medium without uracil SC medium with 2% (wt/vol) maltose as the carbon source (24) were harvested by centrifugation, washed once in 0.67% yeast nitrogen base (YNB) without amino acids, and resuspended at an OD600 of 10–15 in YNB. Cells were diluted 1:5 into YNB and equilibrated for 5 min at 30°C. 14C-labeled substrate (Hartmann Analytic, Braunschweig, Germany) was added. Aliquots were removed from the assay at different time points, placed onto glass fiber filters (APFC 025 00; Millipore), and immediately washed with 10 ml YNB. Filters were placed in scintillation liquid and counted in a Beckman LS1801 scintillation counter. Determination of kinetic parameters was performed with the final substrate concentration varying between 10 μM and 5 mM (0.1–42 Ci/mol). Competition experiments with glucose as substrate were done by using standard assay conditions (300 μM, 0.7–1.7 Ci/mol), except that competitors were added to a final concentration of 3 mM 4 minutes after the cells were added. Fructose uptake inhibition was tested the same way, except that fructose was present at 800 μM (0.6 Ci/mol); competitors were added to a final concentration of 8 mM. Uncoupling experiments were performed by using 300 μM glucose and a final concentration of 100 μM inhibitor dissolved in the appropriate solvent.
Protein concentrations were determined by the Bradford (25) method, using the Bio-Rad protein assay dye after the micro assay procedure with dilutions of BSA as standard.
Electrophysiology.
Xenopus laevis ovarian tissue was isolated surgically from anesthetized toads. Oocytes were isolated by incubation in 0.2% collagenase with 0.1% trypsin inhibitor for 1 h at room temperature and subsequent liberation in 100 mM K2HPO4 containing 1 mg/ml BSA. Oocytes were injected with 30 ng HXT1-cRNA (1 ng/nl in H2O) by using a microdispenser (Drummond Scientific, Broomall, PA). Oocytes were maintained at 16°C in Barth's medium (pH 7.4) [88 mM NaCl/1 mM KCl/0.41 mM CaCl2/2.5 mM NaHCO3/0.33 mM Ca(NO3)2/0.82 mM MgSO4/7.5 mM Tris⋅HCl] containing 10 μg/ml penicillin G and 10 μg/ml streptomycin.
Measurements of oocyte membrane potentials were performed 5–6 days after cRNA injection in a continuously perfused bath (transport medium: 96 mM cholin chloride/2 mM CaCl2/10 mM MES/Tris, pH 7.5 or 5.0, respectively) at room temperature. Membrane potential measurements were performed by using microelectrodes (filled with 3 M KCl, resistance of ≈5 MΩ) and a VF-180 amplifier (BioLogic, Claix, France). After 5 min of membrane-potential stabilization after microelectrode impalements, the responses to carbohydrate solutions were recorded.
Immunocytochemistry.
For light microscopy, rust-infected leaf pieces (8 days postinfection) were fixed in a mixture of ethanol-acidic acid (3:1) for 1 h, washed in ethanol 3 times, and embedded in a resin consisting of 75% butyl methacrylate and 25% methyl methacrylate, 0.5% benzoin ethyl ether, and 10 mM DTT. The resin was infiltrated in mixtures with ethanol (25%, 50%, 75%, and 100% resin) for 1 day each at 4°C. Polymerization took place at 4°C under UV light. Sections were treated with acetone and 3 times with blocking buffer [0.1% (wt/vol) BSA in TBS (10 mM Tris⋅HCl/150 mM NaCl, pH 7.4)], and incubated with purified anti-HXT1p Ab (1:200) in TBS for 2 h. To detect nonspecific binding, preimmune sera were used as control. After 3 washes in TBS, sections were incubated with secondary Ab (cyanin-3-conjugated goat-anti-rabbit; Rockland, Gilbertsville, PA) diluted 1:400 with TBS for 1 h at 20°C. Samples were examined with a Zeiss Axioplan 2 microscope equipped with a ×100 Plan-Neofluar by using Nomarski differential interference contrast or epifluorescence (filters BP 490, FT 510, and LP565). Images were taken with an AxioCam high-resolution digital camera combined with axiovision software (Zeiss), and superimposed using photoshop (Adobe Systems, Mountain View, CA).
For electron microscopy, infected leaf pieces were infiltrated with 8% (vol/vol) methanol in water under low pressure, immediately high-pressure frozen with the HPM 010 instrument (Balzers), and freeze substituted at −90°C, −60°C, and −30°C in 0.5% OsO4 in acetone as described (26). After infiltration with resin and polymerization at 55°C (26), samples were cut and 60-nm-thick sections were spread on 300 mesh hexagonal nickel grids, immersed into blocking buffer, and incubated with purified anti-HXT1p Ab (1:20). As secondary Ab, 6-nm-gold-goat-anti-rabbit (Aurion, Wageningen, The Netherlands) diluted 1:20 was used. After labeling, sections were stained with osmiophilic thiocarbohydrazine for 1 h, washed with water, treated with 2% OsO4 for 1 h, and washed with water again (27). Sections were evaluated with a Hitachi (Tokyo) H7000 electron microscope operating at 50kV.
Results
Analysis of the HXT1 Gene.
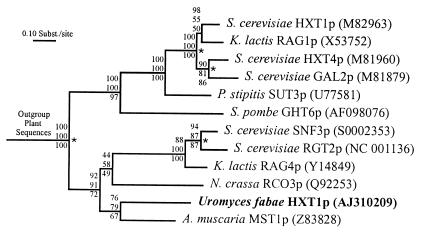
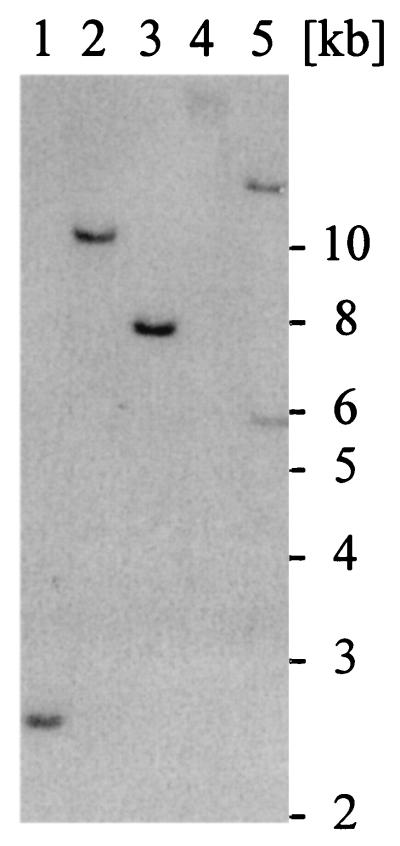
In the course of our search for genes involved in nutrient uptake during the biotrophic phase of the rust fungus U. fabae, we have identified a gene exhibiting high similarity to hexose transporters from a variety of organisms. We have isolated full-length genomic and cDNA clones of gene HXT1 (HeXose Transporter 1) from the respective libraries. The cDNA has a single ORF of 1,569 bp that encodes for a polypeptide of 522 amino acids with a calculated molecular mass of 56.8 kDa. Highest similarities were found to hexose transporters from other fungi (Fig. 1). Similarities were found to hexose transporters from plants, animals, and prokaryotes also (data not shown). HXT1 is most closely related to the recently identified monosaccharide transporter AmMst1 from the ectomycorrhizal fungus Amanita muscaria (28). Within the same cluster fall the Neurospora crassa glucose transporter Rco3, and the Saccharomyces cerevisiae (Rgt2 and Snf3) and Kluyveromyces lactis (Rag4) glucose sensors (29). Other fungal hexose transporters grouped as a second cluster. Based on sequence similarity, HXT1 clearly belongs to the major facilitator superfamily (MFS; ref. 30). Within the MFS, HXT1 falls into the sugar porter subfamily (TC 2.A.1.1). The genomic sequence comprised 3,138 bp with 20 introns. Southern blot analyses performed under high and low stringency conditions indicated that HXT1 is a single-copy gene (Fig. 2).
Figure 1.
Homology of HXT1p to other fungal hexose transporters. Shown is the maximum likelihood tree. Distance-based neighbor-joining and maximum-parsimony methods produced similar topologies. Bootstrap values for maximum likelihood, distance-based neighbor-joining, and maximum-parsimony methods (from top to bottom) are shown at the corresponding branch points. Sequences are identified by species and transporter name. Accession numbers are given in parentheses. The asterisks mark gene-duplication events.
Figure 2.
HXT1 is a single-copy gene. Total DNA of U. fabae was prepared from germinated spores and digested with EcoRI (lane 1), BamHI (lane 2), EcoRV (lane 3), PvuII (lane 4), and PstI (lane 5). Southern blot analysis, using an HXT1-specific cDNA probe, produced single bands in all cases but PstI. For PstI, two bands were obtained because of an internal PstI site at sequence position 4,786. Numbers on the right give the size of the molecular weight marker in kb.
Analysis of HXT1 Expression.
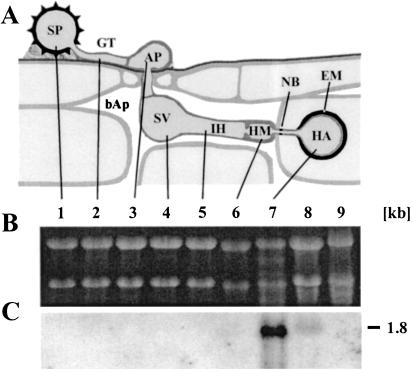
Fig. 3C shows no HXT1 expression in in vitro-grown infection structures up to the haustorial mother cell. A strong hybridization signal was detected with RNA from isolated haustoria, and a much weaker signal was observed for the sample from infected leaves. The negative control with RNA from noninfected leaves showed no signal. The observed expression pattern clearly places HXT1 into a class of genes exclusively, or at least preferentially, expressed in haustoria. This class of genes was characterized as in planta-induced genes (PIGs) by Hahn and Mendgen (10). The much stronger hybridization signals obtained with haustorial RNA samples compared with those from infected leaves suggested that expression of HXT1 might be restricted to haustoria, which represent only a minor fraction of the fungal mycelium. Based on the frequencies of positive clones in a nonamplified cDNA library, HXT1 comprises about 1.2% of the total haustorial mRNA. This is among the highest frequencies found in the haustorium-specific cDNA library (3, 10).
Figure 3.
HXT1 transcripts are found only in haustoria and infected leaves. (A) Schematic representation of rust infection structures. (B) Ethidium bromide-stained denaturing agarose gel (loading control). (C) Northern blot of the gel depicted in B. Lane 1, uredospore (SP); and lane 2, germtube (GT) after 4-h germination. Lanes 3–6, in vitro infection structures harvested at the following stages: 3, appressorium (AP) stage (6-h); 4, substomatal vesicle (SV) stage (12-h); 5, infection hyphae (IH) stage (18-h); 6, haustorial mother cell (HM) stage (21-h). Lane 7, isolated haustoria (HA); lane 8, infected leaves; and lane 9, noninfected leaves. bAp, bulk apoplast; NB, neckband; EM, extrahaustorial matrix. The number on the right gives the size estimate in kb.
Analysis of HXT1p Function.
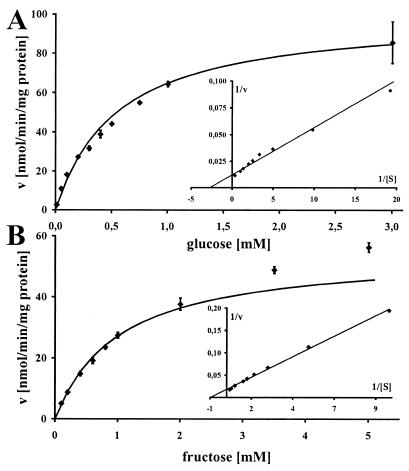
To prove a role of HXT1p in hexose uptake, we chose two different heterologous expression systems. Our first approach was expression of HXT1 in the S. cerevisiae glucose uptake mutant RE700A (31). This strain is deleted for the S. cerevisiae main hexose transporters HXT1–HXT7, and therefore is unable to grow on d-glucose as its sole carbon source. Transformation of RE700A with plasmid pDR195∷HXT1 complemented the glucose uptake defect of this mutant. The expression vector pDR195 alone or plasmid pDR195∷HXT1inv did not do so. Similar results were obtained with d-fructose as the sole carbon source. For d-glucose we calculated a KM of 360 μM and a Vmax of 81 nmol/min/mg of protein (Fig. 4A), and for d-fructose we determined a KM of 1 mM and a Vmax of 55 nmol/min/mg of protein (Fig. 4B). In both cases, Michaelis–Menten graphs were monophasic, and linear transformations produced linear graphs. Lineweaver–Burke transformations (Fig. 4 Insets) produced the best fit with correlation coefficients of 0.999 and 0.997, respectively, and were used to calculate the kinetic parameters.
Figure 4.
HXT1p kinetics with D-glucose (A) or D-fructose (B) as substrate. Michaelis–Menten plots with corresponding Lineweaver–Burke plots (Insets). Radio-labeled sugars were used in the yeast system to obtain transport rates of HXT1p.
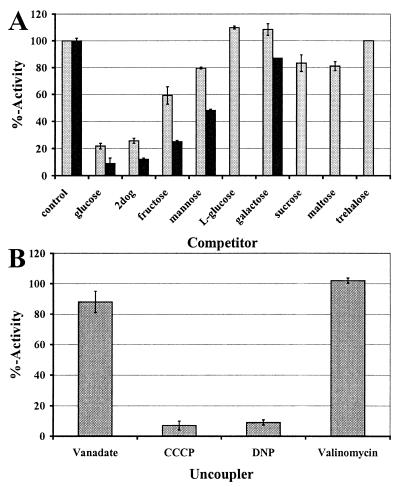
Other monosaccharides as well as disaccharides were tested in competition experiments. Fig. 5A shows that [U−14C]-d-glucose uptake was inhibited by 2-deoxy-d-glucose (2dog), by d-fructose, and by d-mannose. However, only 2dog produced a level of inhibition comparable to the virtual reduction in activity caused by the addition of unlabeled d-glucose. d-mannose on the other hand was only a weak competitor. l-glucose and d-galactose did not inhibit d-glucose uptake. The disaccharide trehalose also did not inhibit, whereas sucrose and maltose showed minor effects. Sucrose and trehalose tested in direct uptake experiments by using [U−14C]-labeled sugars, however, did not show any substantial accumulation (data not shown). With the electrophysiological data, these results indicate that the tested disaccharides are not substrates of HXT1p. d-fructose uptake was inhibited by d-glucose, 2dog, d-fructose, and d-mannose also (Fig. 5A). The inhibition pattern mirrored that of d-glucose inhibition, although effects were pronounced more.
Figure 5.
Competition and uncoupling experiments. (A) Competition experiments using 300 μM D-glucose (gray bars) or 800 mM D-fructose (black bars) and competitor in 10-fold excess in the yeast system. Activity is reported in % of the control without competitor added. The respective control rates were 22.6 ± 6.5 nmol/min/mg of protein (glucose) and 10 ± 0.2 nmol/min/mg of protein (fructose). (B) Uncoupling experiments with 300 μM D-glucose as substrate in the yeast system. Activity is reported in % with respect to the activity obtained by using the respective solvent. The respective control rate (no addition) was 18.7 ± 1.1 nmol/min/mg of protein.
The mode of energization of transport was tested by addition of ATPase inhibitors or uncouplers. Fig. 5B shows that HXT1p activity was not sensitive to the addition of vanadate or valinomycin. Protonophores like carbonylcyanide 3-chlorophenylhydrazone (CCCP) and 2,4-dinitrophenol (DNP), however, showed drastic reductions of d-glucose uptake to less than 10% residual activity. These results demonstrate that HXT1p accumulates d-glucose through a proton-symport mechanism.
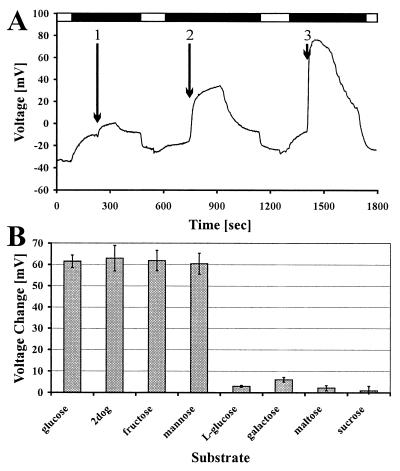
Our second independent approach to characterize HXT1p was by means of electrophysiology. Injection of in vitro-prepared HXT1 cRNA into X. laevis oocytes resulted in a d-glucose concentration-dependent depolarization of the membrane (Fig. 6A). This depolarization occurred only after a pH downshift before d-glucose application. Water-injected control oocytes showed no depolarization in response to the addition of d-glucose. This result again identified HXT1p as an H+/glucose symporter. These experiments also allowed us to test substrate analogs for true transport. Unlike the situation in competition experiments, a depolarization of the membrane in response to application of a substrate analog is direct evidence for that analog being transported. Changes in the membrane potential caused by the addition of other sugars mirrored the results obtained with the yeast inhibition studies. d-glucose, 2-deoxy-d-glucose (2dog), d-fructose, and d-mannose at 5 mM caused identical depolarizations, whereas l-glucose, d-galactose, maltose, and sucrose at the same concentration did not cause any significant changes in membrane potential (Fig. 6B). Therefore, d-glucose, 2dog, d-fructose, and d-mannose must be true substrates for HXT1p.
Figure 6.
Electrophysiological data obtained with the oocyte system. (A) Voltage trace showing the depolarization of the membrane in response to the addition of D-glucose (1:0.1 mM, 2:1 mM, and 3:10 mM). Black bars indicate use of pH 5.0 to create a proton gradient, white bars refer to use of pH 7.5. (B) Membrane depolarization in response to different sugars. Test substances were used at a concentration of 5 mM after pH downshift.
Taken together, the two independent approaches led to very similar results concerning substrate specificity and energization of the transport process mediated by HXT1p. Evidently, the transport is coupled to the cotranslocation of protons. HXT1p shows a clear substrate preference for d-glucose, but 2-deoxy-d-glucose, d-fructose, and d-mannose (with increasing KM values in this order) are transported also.
Analysis of HXT1p Localization.
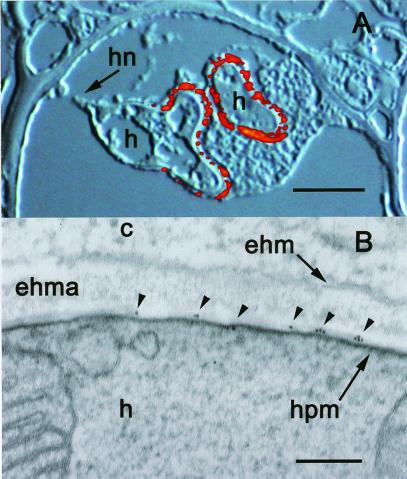
Immunofluorescence microscopy of infected leaves using either of the purified Abs, S650p or S651p, revealed exclusive labeling of haustoria (Fig. 7A). Labeling was strongest in the distal parts of the haustorium and progressively decreased toward the haustorial neck. No specific labeling was found in intercellular hyphae or even haustorial mother cells. Controls with preimmune serum did not show any labeling of infected leaf tissue. The results from immunofluorescence microscopy are therefore in good agreement with the molecular data regarding HXT1 expression (compare Fig. 3C). Electron microscopy, using thin sections of rust-infected leaves and purified Abs S650p or S651p, revealed patches with strong labeling of the haustorial plasma membrane (Fig. 7B). Very little to no labeling was detectable in the extrahaustorial matrix (ehma, Fig. 7B) and the extrahaustorial membrane (ehm, Fig. 7B). Controls with preimmune serum showed no labeling of infected leaf tissue.
Figure 7.
Localization of HXT1p in the periphery of fully developed haustoria and along the haustorial plasma membrane. (A) Superimposed Nomarski differential interference contrast and fluorescence images depicting two haustoria. Labeling of HXT1p with S651p resulted only in fluorescence signals in the periphery of the distal parts of the haustorium; proximal parts and haustorial neck are not labeled (visible on the left haustorium). h, haustorium; hn, haustorial neck. (Bar, 5 μm.) (B) Electron micrograph depicting considerable gold labeling along the haustorial plasma membrane (hpm) only (small arrows), but no labeling over the h, the extra haustorial matrix (ehma), the extrahaustorial membrane (ehm), or the plant cytoplasm (c). (Bar, 0.1 μm.)
Discussion
In this paper we report on the isolation of a hexose transporter gene, HXT1, from the biotrophic rust fungus U. fabae, and the biochemical characterization and localization of its gene product, HXT1p, within the haustorial complex.
Gene HXT1 of U. fabae codes for a membrane protein with substantial similarity to hexose transporters from different organisms. Phylogenetically, HXT1 is most closely related to the monosaccharide transporter AmMst1 from A. muscaria (Fig. 1). A pairwise alignment produced 52% identity and 68% similarity at the protein level (data not shown). Interestingly, A. muscaria is an ectomycorrhizal fungus on Picea abies roots, whereas U. fabae is a biotrophic parasite on V. faba leaves. Both Basidiomycota sequences form a cluster with sequences from Ascomycota. A second cluster, which is dominated by the hexose transporters from S. cerevisiae, is separated from the first cluster by a gene duplication event that occurred early in the evolution of fungi (Fig. 1).
Unlike the situation in S. cerevisiae, which has almost 20 different transporters for d-glucose, we have evidence that HXT1p is encoded by a single-copy gene. Neither Southern blot analysis under low stringency conditions nor nested PCR using three different independent sets of degenerated primers (data not shown) yielded any evidence for additional hexose transporters present in U. fabae in any of the developmental stages tested.
The expression pattern of HXT1 is similar to that of AAT2 (former designation PIG2), a putative amino acid transporter from U. fabae described earlier (Fig. 3C; ref. 32). On the basis of the homology of AAT2 to transporters energized through proton symport (32) and our findings regarding the increased activity of a rust plasma membrane ATPase in haustoria (33, 34), we formulated a model for energized nutrient uptake in haustoria (35). With the energization of AAT2p still unclear, HXT1p is the first secondary transporter to fit the proposed model. Results from both, uncoupling experiments and electrophysiology, demonstrate a proton–substrate symport mechanism for HXT1p. AmMst1, the closest homolog of HXT1p, also seems to operate as a symporter (36). The KM of HXT1p found for d-glucose (360 μM) is considerably lower than the values reported for the various HXT proteins from S. cerevisiae (1.5–100 mM; ref. 37). It is also lower than the numbers reported for various fungal hexose transporters (data summarized by ref. 38). The 360 μM value found for HXT1p, however, is similar to the KM found for AmMst1 (460 μM; ref. 36). AmMst1 also shows a similar substrate specificity as HXT1p, however, affinity of HXT1p to d-fructose is about 4-fold higher (1 mM vs. 4.2 mM). The difference might reflect disparate utilization patterns of hexoses other than d-glucose in the two fungi. It could also be a reflection of the different interfaces the two fungi form with their respective host plants. We have evidence that substrates for HXT1p are at least to some extent produced in the extrahaustorial matrix, most likely through a combined action of fungal and plant invertases (R.T.V., U. Möll, S. Wirsel, K.M., unpublished data). Fructose, too, would have to be removed efficiently from this compartment. However, the extrahaustorial matrix (EM, Fig. 3A) is sealed against the bulk apoplast by the neckband and surrounded by a modified host plasma membrane (39). In the case of A. muscaria, which grows intercellularly between root cortical cells, fructose could also be used by surrounding plant cells, or be diluted in the apoplastic fluid.
The almost exclusive expression of HXT1 in haustoria (Fig. 3C) and the immunological localization of HXT1p to the cytoplasmic membrane of the haustorium (Fig. 7) suggest that this transporter is a key to the biotrophic lifestyle of rusts. Data concerning the uptake of sugars by biotrophic fungi are still scarce and not clear-cut. Source tissue infected by a plant pathogen is thought to be turned into sink tissue (40, 41). With the major plant carbohydrate transport form, sucrose, being diverted directly to the plant pathogen, it seems obvious that the pathogen tries to use this nutrient source. Manners (42) suggested that sucrose is the major metabolite absorbed by powdery mildew. Mendgen and Nass (43), and Aked and Hall (44), however, showed that uptake of glucose is more rapid than uptake of sucrose or fructose in powdery mildew. These data are supported by results from Sutton et al. (45), indicating that glucose is the major carbon source for powdery mildew. Still, these attempts to address the question of host–parasite nutrient transfer carry problems either in assigning the nature of the translocated substance or the localization of the carrier. The present work strongly suggests that active d-glucose and d-fructose uptake in the biotrophic mycelium of the rust fungus U. fabae occurs at least preferentially, if not exclusively, via specialized infection structures, the haustoria. The differences found regarding the affinity of the transporter for different substrates is consistent with the earlier findings of d-glucose being the preferred sugar over sucrose.
The ability of HXT1p from U. fabae to transport d-glucose and d-fructose and the restricted localization to the haustorial plasma membrane leaves only the extrahaustorial matrix as a source for sugars. This work therefore presents compelling evidence for a role of the haustorial complex of rust fungi in sugar uptake.
Acknowledgments
We are grateful to Thomas Roitsch for comments on the manuscript, Henner Brinkmann for assistance with the phylogenetic analysis, and Heinz Vahlenkamp for expert technical assistance with immunocytology. We thank Wolf Frommer for providing the oocyte vector pBF1. This work was supported by a grant provided by the Deutsche Forschungsgemeinschaft to K.M. and R.T.V. (Me 523/24–1), and by the Fonds der Chemischen Industrie.
Footnotes
References
- 1.Heath M C, Skalamera D. Adv Bot Res. 1997;24:195–225. [Google Scholar]
- 2.Bushnell W R. Annu Rev Phytopathol. 1972;10:151–176. [Google Scholar]
- 3.Mendgen K, Struck C, Voegele R T, Hahn M. Physiol Mol Plant Pathol. 2000;56:141–145. [Google Scholar]
- 4.de Bary A. Vergleichende Morphologie der Pilze, Mycetozoen und Bacterien. Leipzig, Germany: Engelmann; 1884. [Google Scholar]
- 5.Hahn M, Mendgen K. Protoplasma. 1992;170:95–103. [Google Scholar]
- 6.Martin T J, Ellingboe A H. Physiol Plant Pathol. 1978;13:1–11. [Google Scholar]
- 7.Mendgen K. Phytopathol. 1981;71:983–989. [Google Scholar]
- 8.Manners J M, Gay J L. New Phytol. 1982;91:221–244. [Google Scholar]
- 9.Hall J L, Williams L E. Aust J Plant Physiol. 2000;27:549–560. [Google Scholar]
- 10.Hahn M, Mendgen K. Mol Plant–Microbe Interact. 1997;10:427–437. doi: 10.1094/MPMI.1997.10.4.427. [DOI] [PubMed] [Google Scholar]
- 11.Deising H, Jungblut P R, Mendgen K. Arch Microbiol. 1991;155:191–198. [Google Scholar]
- 12.Sambrook J, Fritsch E F, Maniatis T. Molecular Cloning: A Laboratory Manual. Plainview, NY: Cold Spring Harbor Lab. Press; 1989. [Google Scholar]
- 13.Elble R. BioTechniques. 1992;13:18–20. [PubMed] [Google Scholar]
- 14.Altschul S F, Gish W, Miller W, Myers E W, Lipman D J. J Mol Biol. 1990;215:403–410. doi: 10.1016/S0022-2836(05)80360-2. [DOI] [PubMed] [Google Scholar]
- 15.Philippe H. Nucleic Acids Res. 1993;21:5264–5272. doi: 10.1093/nar/21.22.5264. [DOI] [PMC free article] [PubMed] [Google Scholar]
- 16.Strimmer K, von Haeseler A. Proc Natl Acad Sci USA. 1997;94:6815–6819. doi: 10.1073/pnas.94.13.6815. [DOI] [PMC free article] [PubMed] [Google Scholar]
- 17.Hasegawa M, Cao Y, Adachi J, Yano T. Nature (London) 1992;355:595. doi: 10.1038/355595a0. [DOI] [PubMed] [Google Scholar]
- 18.Hillis D M, Huelsenbeck J P, Swofford D L. Nature (London) 1994;369:363–364. doi: 10.1038/369363a0. [DOI] [PubMed] [Google Scholar]
- 19.Van de Peer Y, De Wachter R. Comput Appl Biosci. 1997;13:227–230. doi: 10.1093/bioinformatics/13.3.227. [DOI] [PubMed] [Google Scholar]
- 20.Maniatis T, Fritsch E F, Sambrook J. Molecular Cloning: A Laboratory Manual. Plainview, NY: Cold Spring Harbor Lab. Press; 1982. [Google Scholar]
- 21.Rentsch D, Laloi M, Rouhara I, Schmelzer E, Delrot S, Frommer W B. FEBS Lett. 1995;370:264–268. doi: 10.1016/0014-5793(95)00853-2. [DOI] [PubMed] [Google Scholar]
- 22.Studier F W, Moffat B A. J Mol Biol. 1986;189:113–130. doi: 10.1016/0022-2836(86)90385-2. [DOI] [PubMed] [Google Scholar]
- 23.Voegele R T, Marshall E V, Wood J M. In: Bioenergetics: A Practical Approach. Brown G C, Cooper C E, editors. Oxford: IRL; 1995. pp. 17–38. [Google Scholar]
- 24.Sherman F. In: Methods in Enzymology: Guide to Yeast Genetics and Molecular Biology. Guthrie C, Fink G R, editors. Vol. 194. San Diego: Academic; 1991. pp. 3–21. [PubMed] [Google Scholar]
- 25.Bradford M M. Anal Biochem. 1976;72:248–254. doi: 10.1016/0003-2697(76)90527-3. [DOI] [PubMed] [Google Scholar]
- 26.Mendgen K, Welter K, Scheffold F, Knauf-Beiter G. In: Electron Microscopy of Plant Pathogens. Mendgen K, Lesemann D E, editors. Berlin: Springer; 1991. pp. 31–42. [Google Scholar]
- 27.Seligman A M, Wasserkrug H L, Hanker J S. J Cell Biol. 1966;30:424–432. doi: 10.1083/jcb.30.2.424. [DOI] [PMC free article] [PubMed] [Google Scholar]
- 28.Nehls U, Wiese J, Guttenberger M, Hampp R. Mol Plant–Microbe Interact. 1998;11:167–176. doi: 10.1094/MPMI.1998.11.3.167. [DOI] [PubMed] [Google Scholar]
- 29.Özcan S, Johnston M. Microbiol Mol Biol Rev. 1999;63:554–569. doi: 10.1128/mmbr.63.3.554-569.1999. [DOI] [PMC free article] [PubMed] [Google Scholar]
- 30.Marger M D, Saier M H., Jr Trends Biol Sci. 1993;18:13–20. doi: 10.1016/0968-0004(93)90081-w. [DOI] [PubMed] [Google Scholar]
- 31.Reifenberger E, Freidel K, Ciriacy M. Mol Microbiol. 1995;16:157–167. doi: 10.1111/j.1365-2958.1995.tb02400.x. [DOI] [PubMed] [Google Scholar]
- 32.Hahn M, Neef U, Struck C, Göttfert M, Mendgen K. Mol Plant–Microbe Interact. 1997;10:438–445. doi: 10.1094/MPMI.1997.10.4.438. [DOI] [PubMed] [Google Scholar]
- 33.Struck C, Hahn M, Mendgen K. Fungal Genet Biol. 1996;20:30–35. doi: 10.1006/fgbi.1996.0006. [DOI] [PubMed] [Google Scholar]
- 34.Struck C, Siebels C, Rommel O, Wernitz M, Hahn M. Mol Plant–Microbe Interact. 1998;11:458–465. doi: 10.1094/MPMI.1998.11.6.458. [DOI] [PubMed] [Google Scholar]
- 35.Hahn M, Deising H, Struck C, Mendgen K. In: Resistance of Crop Plants Against Fungi. Hartleb H, Heitefuss R, Hoppe H-H, editors. Jena, Germany: Fischer; 1997. pp. 33–57. [Google Scholar]
- 36.Wiese J, Kleber R, Hampp R, Nehls U. Plant Biol. 2000;2:278–282. [Google Scholar]
- 37.Reifenberger E, Boles E, Ciriacy M. Eur J Biochem. 1997;245:324–333. doi: 10.1111/j.1432-1033.1997.00324.x. [DOI] [PubMed] [Google Scholar]
- 38.Jennings D H. The Physiology of Fungal Nutrition. Cambridge, U.K.: Cambridge Univ. Press; 1995. [Google Scholar]
- 39.Heath M C. Can J Bot. 1976;54:2484–2489. [Google Scholar]
- 40.Ayres P G, Press M C, Spencer-Phillips P T N. In: Photoassimilate Distribution in Plants and Crops—Source Sink Relationships. Zamski E, Schaffner A A, editors. New York: Dekker; 1996. pp. 479–499. [Google Scholar]
- 41.Wright D P, Baldwin B C, Shephard M C, Scholes J D. Physiol Mol Plant Pathol. 1995;47:237–253. [Google Scholar]
- 42.Manners J M. Aust J Plant Physiol. 1989;16:45–52. [Google Scholar]
- 43.Mendgen K, Nass P. Planta. 1988;174:283–288. doi: 10.1007/BF00394782. [DOI] [PubMed] [Google Scholar]
- 44.Aked J, Hall J L. New Phytol. 1993;123:277–282. [Google Scholar]
- 45.Sutton P N, Henry M J, Hall J L. Planta. 1999;208:426–430. [Google Scholar]


