

Abstract
“Gyrating-” or “G”-clathrin are coated endocytic structures located near peripheral sorting endosomes (SEs), which exhibit highly dynamic but localized movements when visualized by live cell microscopy. They have been implicated in recycling of transferrin from the sorting endosome directly to the cell surface, but there is no information about their formation or regulation. We show here that G-clathrin comprise a minority of clathrin-coated structures in the cell periphery and are brefeldin A (BFA)-resistant. Arf6-GTP substantially increases G-clathrin levels, probably by lengthening coated bud lifetimes as suggested by photobleaching and photoactivation results, and an Arf6(Q67L)-GTP mutant bearing an internal GFP tag can be directly visualized in G-clathrin structures in live cells. Upon siRNA-mediated depletion of Arf6 or expression of Arf6(T27N), G-clathrin levels rise and are primarily Arf1-dependent, yet still BFA-resistant. However BFA-sensitive increased G-clathrin levels are observed upon acute incubation with cytohesin inhibitor SecinH3, indicating a shift in GEF usage. Depletion of both Arf6 and Arf1 abolishes G-clathrin, and results in partial inhibition of fast transferrin recycling consistent with the latter’s participation in this pathway. Collectively, these results demonstrate that the dynamics of G-clathrin primarily requires completion of the Arf6 guanine nucleotide cycle, but can be regulated by multiple Arf and GEF proteins, reflecting both overlapping mechanisms operative in their regulation and the complexity of processes involved in endosomal sorting.
Keywords: endosome, Arf1, ARNO, endocytosis, GGA, GEF, Transferrin recycling
INTRODUCTION
It is now recognized that while there are multiple pathways for entry of extracellular materials into eukaryotic cells, in most cases they meet in a common structure in the cell periphery, the early or sorting endosome (SE). The SE also receives newly synthesized and cycling intracellular membrane and cargo materials destined for other compartments. Accordingly, multiple fates await SE components including targeting to multivesicular bodies and late endosomes for degradation, retrograde transport to the Golgi and endoplasmic reticulum, as well as recycling to the plasma membrane directly or through an intermediary endocytic recycling compartment (reviewed in (1, 2)).
The diversity of these sorting functions is mirrored by the morphological complexity of the SE network, with discrete vacuolar and tubular domains. In addition, distinct clathrin coated regions on the SE have been recognized. These include unique flat clathrin lattices on the vacuolar domains that function in the initial steps of targeting of receptors and cargoes to multivesicular bodies for ultimate degradation (3–5), as well as clathrin coated tubular regions which have been implicated in recycling and retrograde transport (6–9).
We have previously reported identification of gyrating- or G-clathrin structures just below the plasma membrane and in proximity to peripheral SEs in cells. G-clathrin structures are characterized by highly dynamic yet localized movement, and we have proposed that they comprise coated buds on rapidly waving membrane tubules. They are also endocytic structures that become loaded with internalized transferrin (Tf) after it has accumulated in SEs, suggesting a role in recycling mediated by a transient or gated connection to SEs (10, 11). To begin to dissect mechanisms regulating G-clathrin function, we have asked whether their formation is mediated by ADP-ribosylation factor (Arf) proteins, which regulate many steps of vesicular traffic (reviewed in (12, 13)). In this context, formation of clathrin coats in the TGN containing AP-1 and GGA1 adaptors are mediated by Arf1 (14, 15), but plasma membrane coated pits do not utilize an Arf regulator; it has recently been suggested that a similar function is provided by the inositide binding sites on AP-2 (16, 17). Results reported here provide evidence that for G-clathrin, Arf proteins are indeed involved but it is Arf6 that plays a primary role, functionally consistent with its involvement in other plasma membrane recycling processes. However Arf1 also supports G-clathrin formation; evidence for the involvement of multiple GEFs is also presented, suggesting redundant and potentially interrelated modes of regulation.
RESULTS
The fungal metabolite BFA has been useful in distinguishing between clathrin coated membrane domains in different cellular locations. For clathrin, plasma membrane coated pits and the flat lattices on the vacuolar moiety of SEs are resistant to BFA, while clathrin coated buds on some tubular regions of SEs and on the trans-Golgi network have been shown to be sensitive to the drug (5, 6, 18). To learn how G-clathrin structures in the endosomal region responded, we incubated COS-1 cells with BFA. Fig. 1A shows representative fields of the peripheral cytoplasm of a cell before and after BFA treatment. As expected, addition of BFA caused rapid disappearance of TGN-associated clathrin, resulting in an increase in diffuse signal throughout the cell. In addition, some peripheral clathrin spots disappear, likely corresponding to clathrin-coated buds on endosomes as noted above. However, G-clathrin structures are readily observable in these treated cells by live cell imaging (arrows, Fig. 1A; video S1), as are plasma membrane coated pits (arrowheads). The rapid movements of G-clathrin can also be readily distinguished in maximal projections of 30-frame timestacks (comprising ≈1 sec) as fuzzy and localized ball shape patterns, indicated by circles in Fig. 1A. The comparatively immobile coated pits give sharp spots in these maximal projections, and are indicated by squares. Quantification of images from multiple cells indicates that the proportion of G-clathrin increases substantially on BFA treatment, largely as a result of the disappearance of the non-coated pit peripheral clathrin coated structures, as the absolute number of G-clathrin structures observed remains unchanged or increases slightly. Similar results were observed in COS-7 and HeLa-M cells (data not shown).
Figure 1. G-Clathrin structures are BFA-resistant.

COS-1 cells expressing GFP-clathrin were imaged before and after treatment with BFA (10 μg/ml, 15 min), and G-clathrin structures in the same field were visualized and quantitated using continuous streams (30 msec exposure, 30 frames total).
A) Imaging of a sample field from a single cell. Upper left panel shows a 50 × 50 pixel region (~5.3 μm square) of a single frame while lower left is the maximum projection of the complete stack. Panels on right show corresponding images of the same region of the same cell after 15 min incubation with BFA. Arrows and circles indicate G-clathrin structures in the upper single frame and lower maximum projection panels, respectively, while arrowheads and squares indicate comparatively stationary clathrin structures (coated pits and endosome associated clathrin) in these panels. Bar, 1 μm.
B) Quantitation of G-clathrin increases upon BFA treatment. Cells were treated as described in Fig. 1A. For quantitation, a 50 pixel square region was randomly selected from the periphery of each of six different cells from 3 independent experiments, comprising ~200 structures in total. Moving objects were tracked and those with average speed ≥ 3 μm/s structures were counted as G-clathrin, and are indicated as a proportion of the total number of clathrin structures in each region. Data are presented as mean ± SEM (n=6) and were analyzed by two-tailed unpaired t-test (**p<0.01).
We reported previously that G-clathrin structures are virtually completely colocalized (≈97%) with expressed YFP-GGA1 (10), and we refer to them in this context as G-clathrin/GGA1. Endogenous cellular GGA1 has been visualized in the juxtanuclear TGN region, in structures moving vectorially from the TGN toward the plasma membrane, and in relatively stationary puncta in the cell periphery (19). Membrane recruitment of GGA proteins to these locations is known to be BFA-sensitive (20–22). In contrast, we find that the highly dynamic YFP-GGA1 in the peripheral cytoplasm is resistant to BFA treatment (video S2), consistent with its association with G-clathrin and with the BFA-resistance of the latter demonstrated above.
Since G-clathrin/GGA1 structures persist upon BFA treatment, this implicated BFA-resistant Arf6 and/or GTP-exchange factors (GEFs) in the formation of these coat structures (12, 23). Given the plasma membrane/endosome distribution of Arf6 (24–26), as well as the involvement of Arf1 in GGA-clathrin coat formation (22, 27, 28), we began by expressing GFP-clathrin and either Arf6 or Arf1 in COS-1 cells. As shown in Figure 2, expression of Arf6 increased the population of G-clathrin approximately three-fold, while the effect of Arf1 expression was considerably less.
Figure 2. Effects of Arf1 and Arf6 on G-clathrin and G-GGA1 levels.
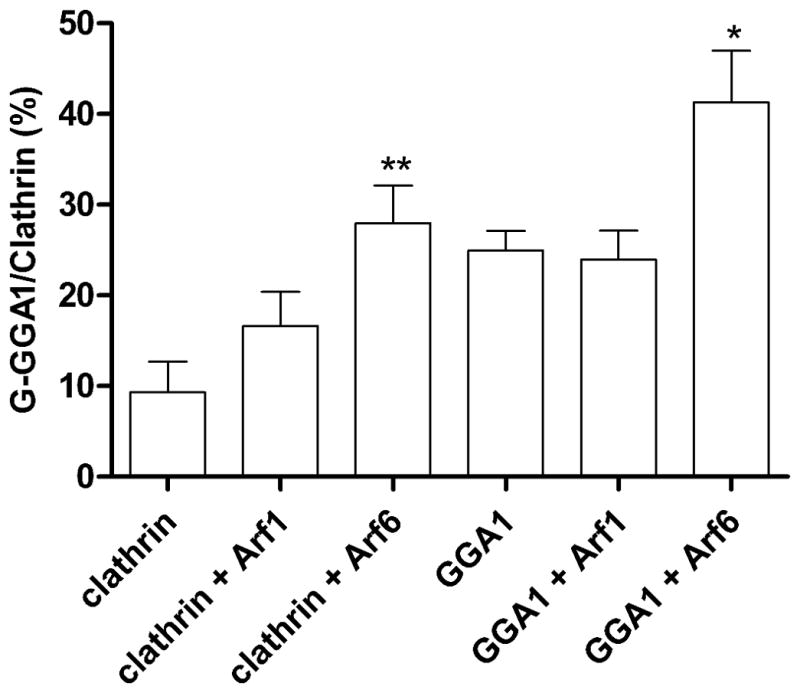
Cells were co-transfected with GFP-clathrin or YFP-GGA1 and with wild-type Arf1 or Arf6 as indicated. G-clathrin structures from 30 frame sequences (30 ms each frame) were analyzed and quantitated as described in Figure 1B. Data represent mean ± SEM (n=6), and were analyzed by one-way ANOVA using Dunnett posttest to compare all columns vs. control. (*p<0.05, **p<0.01).
Similar experiments were performed using YFP-GGA1 as a marker for the G-clathrin/GGA1 structures. Here, we note that expression of YFP-GGA1 alone induces about a two-fold increase in G-clathrin (Fig. 2). Against this background, co-expression of Arf1 elicited no detectable change in G-clathrin/GGA1 levels, while Arf6 still induced a substantial increase in G-clathrin/GGA1 number (Fig. 2). Thus, these observations indicate that the level of G-clathrin at the cell periphery is influenced by the presence of the adaptor protein GGA1, and that Arf6 can further increase the number of these structures, visualized by their incorporation of either fluorescently-tagged clathrin or GGA1.
We next tested the roles of Arf6 and Arf1 in the regulation of G-clathrin formation by examining the effects of co-expression of GFP-clathrin with the “constitutively active” GTPase-deficient mutants [Arf6(Q67L) and Arf1(Q71L)], as well as the “inactive” forms [Arf6(T27N) and Arf1(T31N)]. Arf6(Q67L) expression dramatically increased the population of G-clathrin almost five-fold (Fig. 3A), supporting a role for Arf6-GTP in forming or stabilizing coat structures associated with G-clathrin. Upon expression of an “inactive”, guanine nucleotide non-binding mutant of Arf6 (Arf6(T27N) (29), G-clathrin levels were modestly increased, to an extent comparable to that of wild type Arf6. In contrast, the effect of Arf1(Q71L) was comparable to that of wild-type Arf1, while expression of the “dominant-negative” Arf1(T31N) construct had no effect on G-clathrin levels (Fig. 3A). Together these results indicate that Arf1 plays a minimal role in G-clathrin formation under basal conditions, but that interference with the Arf6 guanine nucleotide cycle may either stabilize or stimulate formation of G-clathrin structures.
Figure 3. Arf6-GTP drives G-clathrin formation, and is incorporated into the coat structures.

A) Arf6 expression increases G-clathrin, especially for the GTP-bound form of Arf6(Q67L), while Arf1 effects are comparatively minimal. Cells were co-transfected with GFP-clathrin and either wild-type Arf6, ARF6(Q67L) or ARF6(T27N), or the corresponding Arf1 constructs, and image streams (30 images, each of 30 ms duration) were taken. The percentage of G-clathrin spots in the regions were calculated as indicated in Figure 1B. D a t a represented mean ± SEM (n=6) and were analyzed by one-way ANOVA with Dunnett posttest (*p<0.05, **p<0.01).
B) The GTP-bound form of Arf6 can be directly visualized as a stable component in G-clathrin structures. Cells were co-transfected with mCherry-clathrin and Arf6(Q67L)-GFP[INT] and simultaneous two-color image streams were obtained (30 images, each of 30 msec duration, boxes are 3.2 μm square). 87% of mCherry-labeled G-clathrin structures were labeled with Arf6(Q67L)-GFP[INT] (data from 6 cells in 3 independent experiments); in the representative image sequence shown, this is indicated by a white point. Also see Video S3.
Given the substantial increase in G-clathrin numbers upon Arf6(Q67L) expression, we asked whether we could obtain direct evidence for the presence of Arf6(Q67L) in these structures using a GFP-tagged construct. For this purpose, we began with a wild-type Arf6 construct containing an internal GFP sequence inserted between Arf6 residues 144-145 (Arf6-GFP[INT]), which has been shown to give superior coupling to effectors (30, 31) and which was generously provided by M. Schwartz (Univ. VA). With this construct, we prepared an Arf6(Q67L) with internal GFP moiety, designated Arf6(Q67L)-GFP[INT]. In cells expressing mCherry-clathrin and Arf6(Q67L)-GFP[INT], we note that virtually complete labeling (≥90%) of plasma membrane coated pits with Arf6(Q67L) was observed (video S3, immobile spots). This is consistent with the recent report that exogenously expressed Arf6 localizes to coated pits (32). We then used simultaneous dual color live cell imaging to evaluate the extent of Arf6(Q67L)-GFP[INT] signal in G-clathrin structures labeled with mCherry-clathrin. Here we found that 87% of G-clathrin structures also contained detectable levels of Arf6(Q67L) (Fig. 3B, and Video S3). Finally, expression of wild-type Arf6-GFP[INT] with mCherry-clathrin also showed occasional colocalization of the two proteins in live cells, but with considerably lower frequency than that of the Arf6(Q67L) protein (52%). Together, these results are consistent with the more dramatic effect of Arf6(Q67L) on the G-clathrin population, and suggest that the GTP-bound form of Arf6 stabilizes the G-clathrin bud.
To examine the role of Arf6 in G-clathrin formation using another approach, we asked whether targeted inhibition of Arf6-directed GEF activity might also yield observable effects on G-clathrin structures. First, we employed a small molecule inhibitor (SecinH3) that has been shown to inhibit cytohesins (33), BFA-resistant GEFs whose targets include Arf6 (reviewed in (12)). Upon incubation of COS1 cells with SecinH3 (6.3 μM) increases in G-clathrin number could be readily detected within 30 min, and after 2 hrs G-clathrin had risen to comprise more than 45% of the clathrin profiles in the cell periphery (Fig. 4). Strikingly, following SecinH3 treatment virtually all G-clathrin structures disappear upon BFA treatment (Fig. 4), indicating that upon cytohesin inhibition a BFA-sensitive GEF is now responsible for their formation. Secondly, we expressed wild-type and catalytically inactive variants of ARNO (cytohesin-2), a known GEF for Arf6 which operates at or near the plasma membrane (34). Exogenous expression of wild-type ARNO did not detectably affect the level of G-clathrin structures (Fig. 4). However, expression of catalytically-inactive ARNO(E156K) resulted in a substantial increase in G-clathrin. Together, these findings support the premise that G-clathrin levels are responsive to the Arf6-GTP-GDP cycle, and that changes can occur on an acute timescale of minutes rather than being a consequence of long-term adaptive responses following exogenous protein expression (or depletion, see below).
Figure 4. Inhibition of the Arf6-GTP·GDP cycle increases G-clathrin.
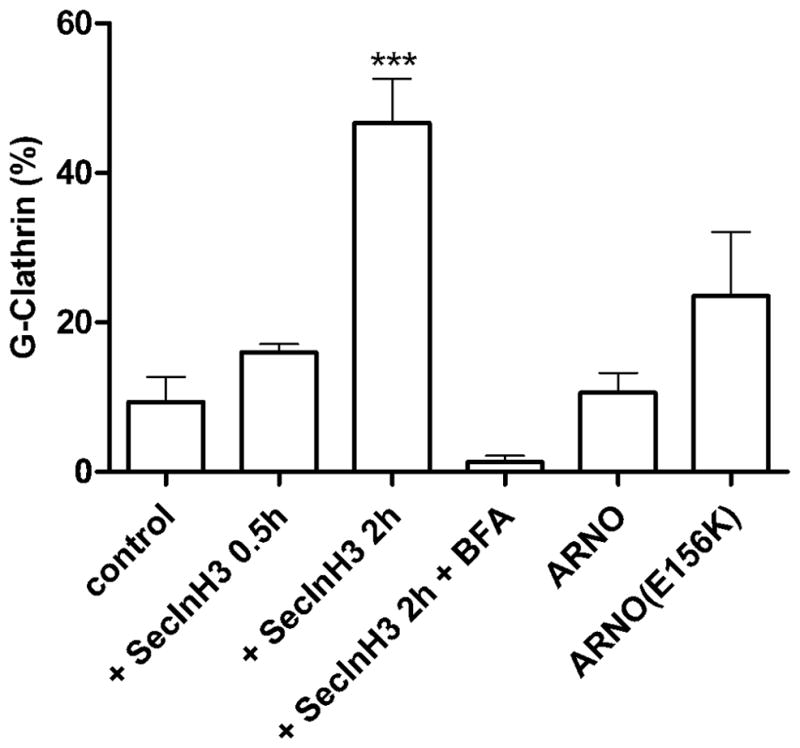
Cells were transfected with GFP-clathrin alone or with GFP-clathrin and either wild-type ARNO or dominant-negative ARNO(E156K) as indicated. Cells transfected with only GFP-clathrin were incubated with SecinH3 (6.25 μM) for 0.5 h or 2 h. After the two hour incubation, BFA (10 μg/ml) was added and the incubation continued for 15 min. In all cases, continuous image streams (30 ms each frame, 30 frames) were taken. The percentage of G-clathrin spots in all cells were calculated as indicated in Figure 1B. Data represent mean ± SEM (n=6) and were analyzed by one-way ANOVA with Dunnett posttest (***p<0.001).
One way in which inhibition of the Arf6 GTP·GDP cycle could increase the number of G-clathrin structures in cells would be to prolong the lifetime of nascent G-clathrin coat structures on tubules, leading to their accumulation. Unfortunately, rigorously measuring complete lifetimes of the highly dynamic G-clathrin structures has not been possible. While we can reliably track some structures for 2–3 sec, and can therefore determine speeds during this timeframe with considerable precision (reference (10) and this report), monitoring G-clathrin structures over longer time periods is inevitably compromised by apparent Z-axis movement that results in disappearance from the plane of focus; even when disappearance is only transient, given other nearby G-clathrin structures this compromises assignment of particle identity. Continuous visualization for extended periods is further limited by the need to balance photobleaching with excitation intensity required to identify G-clathrin structures.
Accordingly we employed an alternative approach utilizing fluorescence recovery after photobleaching (FRAP) to examine the behavior of G-clathrin. Previous studies have shown that clathrin in plasma membrane coated pits, on coated buds in the TGN and on flat lattices on vacuolar portions of sorting endosomes undergo exchange with soluble clathrin triskelia (35–37). To extend these studies, we performed similar experiments on GFP-clathrin in G-clathrin structures in control cells. For quantitation of recovery with minimal photobleaching, we collected brief image streams (1 sec, collecting 30 frames) at 5–20 sec intervals during the recovery phase. Recovery of fluorescence from multiple regions in replicate experiments are collected in Fig. 5, and demonstrate that in control cells G-clathrin recovered with a half-time of 26.3 ± 3.7 sec (extent ≈82%), comparable to that of clathrin coated pits in these cells (t1/2 =24.6 ± 1.2 sec, extent ≈74%; Supplemental Fig. 1). This provides a minimal estimate for G-clathrin lifetime (see Discussion). FRAP of GFP-clathrin in cells expressing unlabeled Arf6(Q67L) revealed a substantially slower rate (t1/2 ≈50.0 ± 9.9 sec, extent ≈84%), implying a longer lifetime for G-clathrin structures. For comparison, G-clathrin recovery times in cells expressing Arf1(T31N), which has no effect on G-clathrin levels in the presence of endogenous Arf6, were identical to controls (Fig. 5).
Figure 5. G-Clathrin with Arf6(Q67L) has slowed FRAP recovery, consistent with longer coated membrane lifetime.
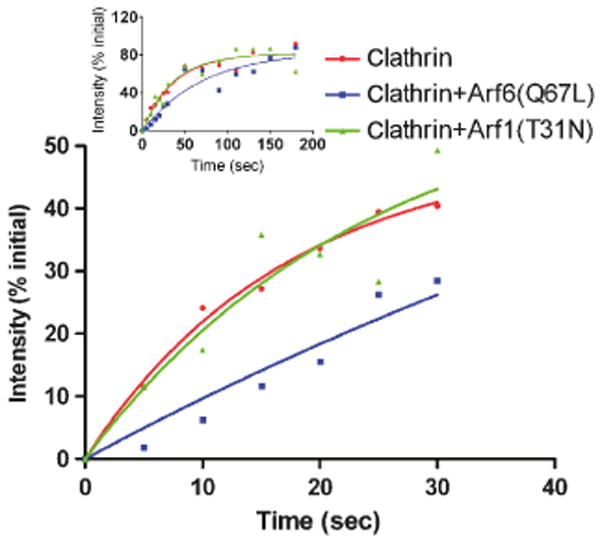
Cells were transfected with GFP-clathrin alone (red, circles) or co-transfected with GFP-clathrin and Arf6(Q67L) (blue, squares) or Arf1() (green, triangles). Following an initial continuous image stream (30 frames at 30 ms exposure), 50 pixel square regions were photobleached and recovery in G-clathrin monitored by capturing 1 sec streams (as above) every 5 s for the first 30s (see Methods for details). Inset: Recovery curves obtained over 180 sec, in which 1 sec streams were taken every 5 s for the first 30s, and then every 20s for the duration.
To gain further insight into this question we also used a photo-activatable form of GFP (38) fused to clathrin which we have previously characterized (39), to ask whether longer lived G-clathrin structures would also be observed upon local photoactivation of PA-GFP-clathrin in cells expressing Arf6(Q67L) than in controls. This indeed was the case: in control cells, photoactivated G-clathrin structures had decreased greatly within ~20s sec, and were near background levels by 40 sec. However in the presence of Arf6(Q67L), discrete G-clathrin structures could regularly be detected for periods in excess of 40 sec after photoactivation, consistent with both slower subunit exchange and longer lifetime under these conditions (video S4).
As an additional approach to investigating the role of Arf protein modulation of G-clathrin, we examined the effect of siRNA-mediated depletion of Arf6 and Arf1 in cells expressing GFP-clathrin. We could achieve 80–90% knockdown of Arf6 (Fig. 6A). This was accompanied by a substantial increase in detectable G-clathrin structures (Fig. 6B), which continue to be BFA-resistant (Fig 6C). These observations suggested that another Arf protein could be contributing to G-clathrin formation in the absence of Arf6. Given the partial effect of Arf1 on G-clathrin noted earlier (Fig. 2), we then used siRNA-mediated depletion to reduce levels of Arf1, or of both Class I Arf proteins (Arf1 + Arf3), but neither condition had a detectable effect on G-clathrin levels (Fig. 6B). However, knockdown of both Arf6 and Arf1, by ≈80% and 95%, respectively (Fig. 6A), resulted in an almost complete inhibition of G-clathrin (Figure 6B), indicating that G-clathrin formation requires either Arf6 or Arf1. To test this notion, we returned to Arf(T27N), which had modestly increased G-clathrin levels in control cells (Fig. 3) and which we ascribe to inhibition of Arf6 and a shift in utilization to Arf1. Consistent with this interpretation, when Arf1-depeleted cells were used, expression of Arf6(T27N) now resulted in decreased G-clathrin levels (Fig. 6B, and Discussion).
Figure 6. siRNA-mediated depletion of Arf6 and Arf1 inhibits G-clathrin formation, and fast recycling of internalized Tf.

A) Knockdown of Arf 6, Arf1 and Arf3. Cells were transfected with GFP-clathrin and with either control siRNA (C) or with siRNAs directed towards Arf6 alone (KD Arf6) or towards Arf1 and Arf6 (KD Arf1+6), or towards Arf1 and Arf3 (KD Arf1+3). Upper: Immunoblot from a representative experiment, with control sample in left lane and indicated siRNA in right lane. Lower: Quantitation of Arf6, Arf1 and Arf3 levels normalized to control, from three independent experiments.
B) G-Clathrin structures in control and siRNA-depleted preparations were quantitated as described in Experimental Procedures and Fig 1B.
C) G-Clathrin structures are BFA-resistant in Arf6-depleted cells. COS-1 cells were depleted of Arf6 and imaged (1 sec continuous stream, 30 frames) before and after BFA treatment (10 μg/ml, 15 min) as described in Methods. The upper left panel shows a single frame before BFA treatment and the lower panel shows the maximum projection 30 frames captured during 1 sec. The right panels show the same region of the cell following BFA treatment, as single frame (upper) and maximum projection (lower). G-Clathrin structures are indicated by arrows in upper panel single frames, and by circular profiles in lower panel projections. Relatively stationary clathrin structures, including coated pits, are indicated by arrowheads in the upper panels and by squares in the corresponding maximum projection in lower panels. Bar, 1 μm.
D) Knockdown of Arf6 and Arf1 inhibits fast recycling of internalized Tf. Cells were treated with control or Arf6 and Arf1 siRNAs, transfected with GFP-clathrin, and recycling of Alexa633-Tf was measured as described in Methods. The figure shows data from 4 independent experiments analyzed using two-way ANOVA with Bonferroni posttest (*p<0.05, **p<0.01).
Our previous work has implicated G-clathrin in Tf recycling to the plasma membrane directly from the sorting endosome (10). Accordingly, we asked whether the absence of detectable G-clathrin structures upon siRNA-mediated depletion of both Arf6 and/or Arf1 would affect recycling of internalized Tf as assayed by flow cytometry. Depletion of either Arf6 or Arf1 individually did not detectably affect Tf recycling (data not shown). However, knockdown of both Arf6 and Arf1 significantly blunted recycling of internalized Tf (Fig. 6D). The rate of fast recycling, estimated from the initial slopes of the curve, indicate ≈28% inhibition. In contrast, no discernible effect on recycling at longer times, which reflects passage through the endocytic recycling compartment (40) was observed.
DISCUSSION
Our previous work has revealed the existence of G-clathrin, a unique population of clathrin coated structures near SEs in the cell periphery that are distinguished by their rapid, localized movement. To begin to dissect the mechanism of G-clathrin formation, we determined the effect of BFA on G-clathrin. That the proportion of G-clathrin in the cell periphery rises substantially upon brief BFA treatment indicates that at any given time G-clathrin comprises only a minority of the total endosomal clathrin population, perhaps 10–15% though this is likely an under-estimate because of the increase in the diffuse clathrin signal that may obscure some weak G-clathrin signal. G-clathrin are distinct from the (BFA-sensitive) clathrin coated regions on endosomal tubules that have been previously reported in ultrastructural studies (6, 7). G-Clathrin are also distinguished from flat clathrin lattices on the vacuolar portions of endosomes which, though BFA-resistant, exhibit much slower movement in live cells, are wortmannin sensitive, and contain EEA1 and Hrs (5, 10). Ultrastructural visualization of G-clathrin is in progress to provide more resolution of the diversity of clathrin structure and function in the endosomal region.
We have previously provided evidence that G-clathrin contributes to fast recycling of cargo such as Tf and HGF/c-Met from SE to the plasma membrane (10, 11). Here using additional approaches we extend this by showing that upon inhibition of G-clathrin formation by depletion of both Arf6 and Arf1, we see reduction in rapid Tf recycling (Fig. 6D). Montagnac et al. also reported partial inhibition of Tf recycling on Arf6 depletion in HeLa cells (32). These distinct but limited effects suggest that G-clathrin contributes to but is not the exclusive pathway of fast Tf recycling in these non-polarized cells.
Involvement of Arf6 in G-clathrin formation was supported by the ability of exogenously expressed wild-type Arf6 to substantially increase G-clathrin number, and the effect was heightened by expression of Arf6(Q67L), the ‘constitutively active’ form with GTP stably bound. The ability to directly detect the internally GFP-tagged form of Arf6(Q67L) in G-clathrin structures confirms a role for Arf6 in G-clathrin formation, as do the depletion experiments (Fig. 3 and 6).
The FRAP and photoactivation experiments on G-clathrin reported here provide insight into G-clathrin dynamics in cells, and allow us to conclude that the overall lifetime of the G-clathrin structures must be at least as long as the observed exchange half-lives (≥24 sec), and much longer than we can reliably track individual structures as noted earlier. In cells expressing Arf6(Q67L), considerably slower G-clathrin fluorescence recovery is observed, consistent with a much longer lifetime (≥50 sec) for G-clathrin/Arf6(Q67L) structures. The converse photoactivation experiments also support this interpretation, demonstrating long persistence as well as restricted, localized movement of photoactivated G-clathrin in the presence of Arf6(Q67L). Together with detection of Arf6(Q67L) in G-clathrin, these experiments indicate that completion of the Arf6 guanine nucleotide cycle is required before Arf6 release and bud scission can be achieved, leading to accumulation of G-clathrin when the cycle is inhibited. Interestingly, unlike the effect on G-clathrin, we find that Arf6(Q67L) expression did not detectably affect clathrin exchange in plasma membrane coated pits (t1/2 ≈25.4 ± 0.8 sec, Fig. S5), consistent with published findings (32) and supporting the inference that the roles of Arf6 in G-clathrin and coated pit formation are fundamentally different. In the latter, Arf6 has been proposed to function only in post-internalization events (32). In contrast, our results for G-clathrin suggest that the role of Arf6 is consistent with the well-characterized role of Arf proteins in coat-mediated membrane budding (12).
Although Arf6-GTP dramatically increases G-clathrin numbers, there are several lines of evidence indicating that Arf1 can mediate their formation as well. Most importantly, the persistence of G-clathrin upon Arf6 depletion, but loss on knockdown of both Arf1 and Arf6, argues that Arf1 can substitute for Arf6. This is supported by the observation that in control cells the ‘dominant-negative’ Arf6(T27N) causes a modest increase in G-clathrin in control cells (Fig. 3A), evidently due to alternate utilization of Arf1 which may not complete the budding cycle as effectively as Arf6. But in Arf1-depleted cells, Arf6(T27N) expression competes with endogenous Arf6, effectively mirroring a double knockdown of both Arf isoforms and resulting in reduced G-clathrin formation (Fig. 6A).
Evidence for Arf1-driven G-clathrin formation is also provided by the modest increase seen on expression of wild-type Arf1 (Fig. 2) or Arf1(Q71L) (Fig. 3A). Further, GGA1 expression also increases G-clathrin levels (Fig. 2). This is reminiscent of GGA1 induction of TGN clathrin, which has been ascribed to Arf1 as well (28, 41). In this context, it is informative that the effects on G-clathrin of GGA1 and Arf1 expression are not additive, consistent with action through a single Arf1-dependent mechanism, while Arf6 expression augments GGA1 effects on G-clathrin, consistent with contributions by both Arf1 and Arf6 (Fig. 2).
Given the ability of both Arf6 and Arf1 to support G-clathrin formation, we considered the possibility that distinct pools of G-clathrin may exist under basal conditions. However, our results provide no evidence to support this interpretation. G-clathrin levels are not detectably affected by either knockdown of Arf1/Arf3 (Fig. 6) or by expression of dominant-negative Arf1(T31N) (Fig. 5). We also cannot find evidence of a BFA-sensitive non-Arf6-mediated pool of G-clathrin, as the absolute number of G-clathrin structures remains constant or even increases slightly upon BFA treatment (Fig. 1 and data not shown). Further, G-clathrin is still BFA-resistant upon depletion of Arf6 or expression of Arf6(T27N), indicating continued BFA-resistant GEF function. Nonetheless, given the limited resolution of the live cell imaging assay for G-clathrin at present, the possibility of multiple pools or species of G-clathrin cannot be rigorously excluded and it will be important to develop higher resolution assays in the future.
Collectively these observations establish a key role for Arf6 in G-clathrin function, extending the latter’s involvement in cargo and receptor recycling (reviewed in (13)). Furthermore, though Arf6 appears to be the primary actor in G-clathrin formation, especially given its lower cellular concentration (42), Arf1 is also functional, supporting the involvement of multiple Arf isoforms in discrete cellular processes (see below). In this context we note that puzzlingly similar effects of both GTP- and GDP- (or nonbinding) forms of Arf6 have also been reported previously (e.g., references (43–45)). Action at separate loci may sometimes explain such observations, but in light of our findings it will be worth considering the possibility of multiple Arf proteins contributing hierarchically to the biological processes in question.
Our work also shows that multiple GEF proteins can mediate G-clathrin formation. Under basal conditions, our findings suggest that a member of the cytohesin family (reviewed in (12)), most likely ARNO, is involved in G-clathrin formation (Fig. 4). ARNO is BFA-resistant (46), is known to be associated with SEs and plasma membrane (47, 48), is potently inhibited by SecinH3 at the relatively low concentrations used here (33), and acts on both Arf6 and Arf1 (34). Indeed, the G-clathrin structures seen upon Arf6 depletion (Fig. 6C) or on expression of Arf6(T27N) remain BFA-resistant (data not shown), suggesting continued ARNO function but a shift in coupling to Arf1. However following SecinH3 inhibition, G-clathrin structures are now BFA-sensitive, revealing a switch in GEF utilization.
The contribution of multiple Arf proteins to individual cellular processes is becoming well recognized (reviewed in reference (13)). In particular, Volpicelli-Daley and colleagues (49) reported that no individual trafficking process studied in intact cells could be detectably inhibited by depletion of only a single Arf isoform; others have suggested that competition generally exists among different Arf isoforms for targeting and function (50). The possibility for cross-activation between Arf6 and Arf1, mediated by ARNO, has also been demonstrated (51) and is of relevance to this work as well. The involvement of multiple Arf and GEF proteins with G-clathrin increases the complexity of a potential regulatory web, but the identification of these factors represents a critical step in elucidating mechanisms governing the function of G-clathrin in membrane trafficking.
MATERIALS AND METHODS
Cell culture, expression and protein depletion
COS1, COS7 or HeLa-M cells were grown and transient expression was performed as described previously with imaging performed 24 hrs following transfection at 25°C for G-clathrin quantitation (10). Antibodies to Arf1, Arf3 and Arf6 were obtained from Santa Cruz (Santa Cruz, CA) and to actin from Cytoskeleton (CO). Colleagues generously provided constructs for Arf1 and Arf1(Q71L) (C. Moore, Univ. Philadelphia), Arf6, Arf6(T27N) and Arf6(Q67L) (C. D’Souza-Schorey, Notre Dame Univ.), wild-type ARNO and ARNO(E156K) (J. Casanova, Univ. Va), Arf6-GFP[INT] (M. Schwartz, Univ. Va). Arf1(T31N) was constructed from the wild-type construct using the QuickChange II protocol (Agilent, Inc.), confirmed by sequencing. Arf6(Q67L)-GFP[INT] was prepared by first subcloning Arf6-GFP[INT] from pUC19 into pcDNA3 using HindIII and EcoRI sites. Then a fragment (1-143) of Arf6(Q67L) was swapped into the same region of Arf6-GFP[INT]pcDNA3 at HindIII and Xhol sites to make Arf6(Q67L)-GFP[INT]pcDNA3. Co-expression of untagged markers with GFP-clathrin or YFP-GGA1 was confirmed by immunofluorescence. For siRNA-mediated depletion, COS1 cells were transfected with marker mCherry and a mixture of four Arf6 siRNAs at 25 nM (5′-CGGCAUUACUACACUGGGA-3′; 5′-UCACAUGGUUAACCUCUAA-3′; 5′-GAGCUGCACCGCAUUAUCA-3′; 5′-GAUGAGGGACGCCAUAAUC-3′) from Thermo Scientific Dharmacon, 3 μg of pSUPER plasmid expressing Arf1 siRNA (5′-ACCGTGGAGTACAAGAACA-3′) and/or Arf3 (5′-ACAGGATCTGCCTAATGCT-3′), a gift from R. Kahn (49)), followed by a second transfection after 48h which included GFP-clathrin instead of mCherry. Cells were analyzed at 72h.
Live cell imaging
COS-1 cells were seeded in glass bottom culture dishes (MarTek) in complete DMEM medium, then replaced with HEPES-supplemented F-12 medium before imaging. For pharmacological treatments, cells were imaged before treatment and then incubated in serum-free DMEM with 10 μg/ml BFA (Santa Cruz, CA) or 6.25 μM SecinH3 (Tocris Bioscience, Bristol, UK) at 37°C for the indicated periods; subsequently cells were changed back to F-12-HEPES containing corresponding reagents and images were acquired on the same cells. Widefield imaging was performed on a Zeiss Axiovert 200M widefield microscope (150X/1.45 NA objective, Olympus) using an Evolve 512M camera (Photometrics, Inc.) controlled by Metamorph software (Universal Imaging, Inc.). Simultaneous imaging of GFP and mCherry signals was accomplished using a Dual-view system (Optical Insights, Inc.). In all cases, imaging conditions ensured that signal loss due to photobleaching throughout the course of each experiment was less than 20%.
Fluorescence recovery after photobleaching (FRAP) and photoactivation (PA) studies of G-clathrin were performed on an Andor Revolution XD system with ALC and FRAPPA units and 100 mW lasers controlled by IQ2 software (Andor™ Techonology, Inc), using a Nikon Ti-E microscope (100X/1.49 NA objective) interfaced to a Yokogawa CSU-X1 spinning disk head with an Andor iXon3 camera for detection at 37°. For FRAP, a 50 pixel (≈6.7 μm) square region was selected toward the periphery of the cell. A one second stream (33 frames at 30 ms/frame) was taken immediately before photobleaching (performed at 100% power, ≤1.0 sec duration). Fluorescence recovery was measured by taking additional one second image streams at the indicated time points. For photoactivation, a 50 pixel square region was selected toward the periphery of the cell; photoactivation was accomplished by brief illumination (405 nm, 20% power, 0.5 sec), followed by acquisition of one second image streams at the indicated time points. Measurement of FRAP of clathrin coated pits was performed in TIRF microscopy mode. A 100 pixel square (≈13.3 μm) region was selected and two images were captured (200 ms exposure, 0.5 s interval) immediately followed by photobleaching (100% power, ~1.0 sec duration). Fluorescence recovery was measured by imaging every sec up to 120 s.
Image analysis
For G-clathrin identification and tracking, six-eight 50 pixel square regions of interest (ROIs) were randomly selected from the periphery of six-eight different cells, containing 150–200 spots in total. Background correction was performed using a Metamorph morphology filter (Close-Open) and image stacks were further processed using Kalman or nd-Safir software (52, 53) for denoising. Moving objects were tracked using Metamorph “Track Points” and those with an average speed ≥ 3 μm/s structures were counted as G-clathrin, consistent with our earlier criteria (10).
For FRAP quantitation, an ROI subjected to photobleaching and an additional non-photobleached ROI (“non-FRAP”) from the same cell (total of twenty different cells from four independent experiments) were background-corrected (Image J, rolling ball correction). For quantitation of recovery, maximum projection images of the first 30 frames were prepared and pixel areas comprising twice the average ROI intensity were counted. These intensities were normalized to pre-bleach levels (set to 100%) and corrected for signal decrease during recovery image acquisition using average intensity decreases in the “non-FRAP” ROIs of the same cell. Prism was used for statistical analysis (Graphpad Software, Inc)
Immunoblotting
Cells were treated with control SiRNA or Arf1, Arf3 and/or Arf6 SiRNA as described above and lysed in 100 mM MES (pH 6.8), 0.1% Triton, 1 mM EGTA, 0.5 mM MgCl2, 0.02% NaN3, containing a proteinase inhibitor cocktail (Sigma Chem Corp., St. Louis). Lysates were centrifuged at 13,000 X g for 20 min at 4°C, and supernatants were blotted with anti-Arf1, anti-Arf6 and anti-α tubulin. Image J was used quantitation of gel densitometry.
Flow cytometry and quantification of Tf recycling
COS-1 cells were transfected with control siRNA or siRNA for Arf1 and Arf6 along with GFP reporter. 72h later, cells were serum starved for 30 min at 37°C in DMEM before being detached by 1 mM EDTA in PBS. Harvested cells were incubated for 5 min in binding medium (DMEM, 1% BSA, 20 mM Hepes) containing 20 μg/ml Alexa633-conjugated human transferrin (Al633-Tf) at 37°C. Subsequently, Tf loading was stopped by rapidly cooling cells on ice, washing once with ice-cold binding medium, and surface-bound Al633-Tf was then removed by washing in ice-cold stripping medium (50 mM glycine, 100 mM NaCl, pH 3) for 2 min. Cells were then neutralized with ice-cold PBS followed by incubation in prewarmed recycling medium (DMEM, 1% BSA, 20 mM Hepes, 50 μM deferoxamine, 2 mg/ml unlabeled Tf) at 37°C for the indicated time. Recycling was terminated by chilling cells on ice, briefly centrifuging and resuspending in cold PBS before analysis on a FACSCalibur system (Becton Dickinson) measuring the fluorescence of GFP and Alexa633. For each sample 10,000 cells were analyzed and data are expressed as a percentage of total cell fluorescence compared to 0 min (before initiation of recycling).
Supplementary Material
FRAP recovery curves were obtained from COS-1 cells expressing GFP-clathrin alone (open circles) or GFP-clathrin and Arf6(Q67L) (closed circles). For details, see Methods.
Same cell imaged before (left panels) and after (right panels) BFA treatment for GFP-clathrin fluorescence. Following BFA, loss of TGN and some immobile clathrin structures are observed, as well as an increase in diffuse, soluble clathrin fluorescence. But rapidly moving G-clathrin persists. Regions in red boxes are enlarged in lower panels. Persistence of the G-clathrin/GGA1 structures is more evident when imaging GGA1, which lacks the background of stationary clathrin structures (see video S2). Continuous image streams, 1 sec in duration and ≈5.3 μm square in upper panels, were captured as described in Fig. 1 and are played at real-time (30 Hz).
Same cell imaged before (left) and after (right) BFA treatment for YFP-GGA1 fluorescence. Following BFA, loss of TGN and some immobile GGA1 structures are observed, as well as an increase in diffuse, soluble GGA1 fluorescence. But rapidly moving G-GGA1 persists. Continuous image streams, each ≈5.3 μm square and 1 sec in duration, were captured as described in Fig. 1 and are played at real-time (30 Hz).
Video shows a montage of a ≈5.3 μm square region of cell expressing Arf6(Q67L)-GFP[INT] (upper left) and mCherry-clathrin (upper right), with merge in lower left panel. Blue boxes indicate regions with colocalized G-clathrin and Arf6. Continuous image streams were captured as described in Fig. 1.
Left panels show a 1 sec continuous image stream of GFP-clathrin fluorescence taken immediately after photoactivation from regions of cells expressing PA-GFP-clathrin alone (upper panels) or PA-GFP-clathrin and Arf6(Q67L) (lower panels): several G-clathrin structures can be visualized in each case. After 40 sec another image stream from the same regions was captured (right panels): G-clathrin structures are not detectable in cells expressing only GFP-clathrin but persist in cells expressing Arf6(Q67L), consistent with the half-times for exchange measured by FRAP and providing direct evidence of much longer G-clathrin lifetime. Each panel ≈5.3 μm square.
Acknowledgments
This work was supported by NIH award GM-49217 (to JHK). We gratefully acknowledge the initial work of Dr. Y. Zhao with BFA and the technical assistance of M. McCauley, as well as the kind gift of reagents and advice from colleagues including J. Casanova and M. Schwartz (Univ. VA), R. Kahn (Emory Univ.), and C. Moore (Univ. Sciences, Philadelphia).
References
- 1.Bonifacino JS, Rojas R. Retrograde transport from endosomes to the trans-Golgi network. Nat Rev Mol Cell Biol. 2006;7:568–79. doi: 10.1038/nrm1985. [DOI] [PubMed] [Google Scholar]
- 2.Jovic M, Sharma M, Rahajeng J, Caplan S. The early endosome: a busy sorting station for proteins at the crossroads. Histol Histopathol. 2010;25:99–112. doi: 10.14670/hh-25.99. [DOI] [PMC free article] [PubMed] [Google Scholar]
- 3.Dell’Angelica EC, Klumperman J, Stoorvogel W, Bonifacino JS. Association of the AP-3 adaptor complex with clathrin. Science. 1998;280:431–4. doi: 10.1126/science.280.5362.431. [DOI] [PubMed] [Google Scholar]
- 4.Raposo G, Tenza D, Murphy DM, Berson JF, Marks MS. Distinct protein sorting and localization to premelanosomes, melanosomes, and lysosomes in pigmented melanocytic cells. J Cell Biol. 2001;152:809–24. doi: 10.1083/jcb.152.4.809. [DOI] [PMC free article] [PubMed] [Google Scholar]
- 5.Sachse M, Urbe S, Oorschot V, Strous GJ, Klumperman J. Bilayered clathrin coats on endosomal vacuoles are involved in protein sorting toward lysosomes. Mol Biol Cell. 2002;13:1313–28. doi: 10.1091/mbc.01-10-0525. [DOI] [PMC free article] [PubMed] [Google Scholar]
- 6.Stoorvogel W, Oorschot V, Geuze HJ. A novel class of clathrin-coated vesicles budding from endosomes. J Cell Biol. 1996;132:21–33. doi: 10.1083/jcb.132.1.21. [DOI] [PMC free article] [PubMed] [Google Scholar]
- 7.Futter CE, Gibson A, Allchin EH, Maxwell S, Ruddock LJ, Odorizzi G, Domingo D, Trowbridge IS, Hopkins CR. In polarized MDCK cells basolateral vesicles arise from clathrin-gamma-adaptin-coated domains on endosomal tubules. J Cell Biol. 1998;141:611–23. doi: 10.1083/jcb.141.3.611. [DOI] [PMC free article] [PubMed] [Google Scholar]
- 8.van Dam EM, Stoorvogel W. Dynamin-dependent transferrin receptor recycling by endosome-derived clathrin-coated vesicles. Mol Biol Cell. 2002;13:169–82. doi: 10.1091/mbc.01-07-0380. [DOI] [PMC free article] [PubMed] [Google Scholar]
- 9.Popoff V, Mardones GA, Tenza D, Rojas R, Lamaze C, Bonifacino JS, Raposo G, Johannes L. The retromer complex and clathrin define an early endosomal retrograde exit site. J Cell Sci. 2007;120:2022–31. doi: 10.1242/jcs.003020. [DOI] [PubMed] [Google Scholar]
- 10.Zhao Y, Keen JH. Gyrating clathrin: highly dynamic clathrin structures involved in rapid receptor recycling. Traffic. 2008;9:2253–64. doi: 10.1111/j.1600-0854.2008.00819.x. [DOI] [PMC free article] [PubMed] [Google Scholar]
- 11.Parachoniak CA, Luo Y, Abella JV, Keen JH, Park M. GGA3 functions as a switch to promote Met receptor recycling, essential for sustained ERK and cell migration. Dev Cell. 2011;20:751–63. doi: 10.1016/j.devcel.2011.05.007. [DOI] [PMC free article] [PubMed] [Google Scholar]
- 12.D’Souza-Schorey C, Chavrier P. ARF proteins: roles in membrane traffic and beyond. Nat Rev Mol Cell Biol. 2006;7:347–58. doi: 10.1038/nrm1910. [DOI] [PubMed] [Google Scholar]
- 13.Donaldson JG, Jackson CL. ARF family G proteins and their regulators: roles in membrane transport, development and disease. Nat Rev Mol Cell Biol. 2012;12:362–75. doi: 10.1038/nrm3117. [DOI] [PMC free article] [PubMed] [Google Scholar]
- 14.Traub LM. Common principles in clathrin-mediated sorting at the Golgi and the plasma membrane. Biochim Biophys Acta. 2005;1744:415–37. doi: 10.1016/j.bbamcr.2005.04.005. [DOI] [PubMed] [Google Scholar]
- 15.Daboussi L, Costaguta G, Payne GS. Phosphoinositide-mediated clathrin adaptor progression at the trans-Golgi network. Nat Cell Biol. 2012;14:239–48. doi: 10.1038/ncb2427. [DOI] [PMC free article] [PubMed] [Google Scholar]
- 16.Yu X, Breitman M, Goldberg J. A structure-based mechanism for Arf1-dependent recruitment of coatomer to membranes. Cell. 2012;148:530–42. doi: 10.1016/j.cell.2012.01.015. [DOI] [PMC free article] [PubMed] [Google Scholar]
- 17.Jackson LP, Kelly BT, McCoy AJ, Gaffry T, James LC, Collins BM, Honing S, Evans PR, Owen DJ. A large-scale conformational change couples membrane recruitment to cargo binding in the AP2 clathrin adaptor complex. Cell. 2010;141:1220–9. doi: 10.1016/j.cell.2010.05.006. [DOI] [PMC free article] [PubMed] [Google Scholar]
- 18.Robinson MS, Kreis TE. Recruitment of coat proteins onto Golgi membranes in intact and permeabilized cells: effects of brefeldin A and G protein activators. Cell. 1992;69:129–38. doi: 10.1016/0092-8674(92)90124-u. [DOI] [PubMed] [Google Scholar]
- 19.Puertollano R, van der Wel NN, Greene LE, Eisenberg E, Peters PJ, Bonifacino JS. Morphology and dynamics of clathrin/GGA1-coated carriers budding from the trans-Golgi network. Mol Biol Cell. 2003;14:1545–57. doi: 10.1091/mbc.02-07-0109. [DOI] [PMC free article] [PubMed] [Google Scholar]
- 20.Dell’Angelica EC, Puertollano R, Mullins C, Aguilar RC, Vargas JD, Hartnell LM, Bonifacino JS. GGAs: a family of ADP ribosylation factor-binding proteins related to adaptors and associated with the Golgi complex. J Cell Biol. 2000;149:81–94. doi: 10.1083/jcb.149.1.81. [DOI] [PMC free article] [PubMed] [Google Scholar]
- 21.Hirst J, Lui WW, Bright NA, Totty N, Seaman MN, Robinson MS. A family of proteins with gamma-adaptin and VHS domains that facilitate trafficking between the trans-Golgi network and the vacuole/lysosome. J Cell Biol. 2000;149:67–80. doi: 10.1083/jcb.149.1.67. [DOI] [PMC free article] [PubMed] [Google Scholar]
- 22.Takatsu H, Yoshino K, Toda K, Nakayama K. GGA proteins associate with Golgi membranes through interaction between their GGAH domains and ADP-ribosylation factors. Biochem J. 2002;365:369–78. doi: 10.1042/BJ20020428. [DOI] [PMC free article] [PubMed] [Google Scholar]
- 23.Zeeh JC, Zeghouf M, Grauffel C, Guibert B, Martin E, Dejaegere A, Cherfils J. Dual specificity of the interfacial inhibitor brefeldin a for arf proteins and sec7 domains. J Biol Chem. 2006;281:11805–14. doi: 10.1074/jbc.M600149200. [DOI] [PubMed] [Google Scholar]
- 24.Peters PJ, Hsu VW, Ooi CE, Finazzi D, Teal SB, Oorschot V, Donaldson JG, Klausner RD. Overexpression of wild-type and mutant ARF1 and ARF6: distinct perturbations of nonoverlapping membrane compartments. J Cell Biol. 1995;128:1003–17. doi: 10.1083/jcb.128.6.1003. [DOI] [PMC free article] [PubMed] [Google Scholar]
- 25.D’Souza-Schorey C, van Donselaar E, Hsu VW, Yang C, Stahl PD, Peters PJ. ARF6 targets recycling vesicles to the plasma membrane: insights from an ultrastructural investigation. J Cell Biol. 1998;140:603–16. doi: 10.1083/jcb.140.3.603. [DOI] [PMC free article] [PubMed] [Google Scholar]
- 26.Gaschet J, Hsu VW. Distribution of ARF6 between membrane and cytosol is regulated by its GTPase cycle. J Biol Chem. 1999;274:20040–5. doi: 10.1074/jbc.274.28.20040. [DOI] [PubMed] [Google Scholar]
- 27.Boman AL, Zhang C, Zhu X, Kahn RA. A family of ADP-ribosylation factor effectors that can alter membrane transport through the trans-Golgi. Mol Biol Cell. 2000;11:1241–55. doi: 10.1091/mbc.11.4.1241. [DOI] [PMC free article] [PubMed] [Google Scholar]
- 28.Puertollano R, Randazzo PA, Presley JF, Hartnell LM, Bonifacino JS. The GGAs promote ARF-dependent recruitment of clathrin to the TGN. Cell. 2001;105:93–102. doi: 10.1016/s0092-8674(01)00299-9. [DOI] [PubMed] [Google Scholar]
- 29.Macia E, Luton F, Partisani M, Cherfils J, Chardin P, Franco M. The GDP-bound form of Arf6 is located at the plasma membrane. J Cell Sci. 2004;117:2389–98. doi: 10.1242/jcs.01090. [DOI] [PubMed] [Google Scholar]
- 30.Hall B, McLean MA, Davis K, Casanova JE, Sligar SG, Schwartz MA. A fluorescence resonance energy transfer activation sensor for Arf6. Anal Biochem. 2008;374:243–9. doi: 10.1016/j.ab.2007.11.03. [DOI] [PMC free article] [PubMed] [Google Scholar]
- 31.Jian X, Cavenagh M, Gruschus JM, Randazzo PA, Kahn RA. Modifications to the C-terminus of Arf1 alter cell functions and protein interactions. Traffic. 2010;11:732–42. doi: 10.1111/j.1600-0854.2010.01054.x. [DOI] [PMC free article] [PubMed] [Google Scholar]
- 32.Montagnac G, de Forges H, Smythe E, Gueudry C, Romao M, Salamero J, Chavrier P. Decoupling of activation and effector binding underlies ARF6 priming of fast endocytic recycling. Curr Biol. 2011;21:574–9. doi: 10.1016/j.cub.2011.02.034. [DOI] [PubMed] [Google Scholar]
- 33.Hafner M, Schmitz A, Grune I, Srivatsan SG, Paul B, Kolanus W, Quast T, Kremmer E, Bauer I, Famulok M. Inhibition of cytohesins by SecinH3 leads to hepatic insulin resistance. Nature. 2006;444:941–4. doi: 10.1038/nature05415. [DOI] [PubMed] [Google Scholar]
- 34.Frank S, Upender S, Hansen SH, Casanova JE. ARNO is a guanine nucleotide exchange factor for ADP-ribosylation factor 6. J Biol Chem. 1998;273:23–7. doi: 10.1074/jbc.273.1.23. [DOI] [PubMed] [Google Scholar]
- 35.Wu X, Zhao X, Baylor L, Kaushal S, Eisenberg E, Greene LE. Clathrin exchange during clathrin-mediated endocytosis. J Cell Biol. 2001;155:291–300. doi: 10.1083/jcb.200104085. [DOI] [PMC free article] [PubMed] [Google Scholar]
- 36.Wu X, Zhao X, Puertollano R, Bonifacino JS, Eisenberg E, Greene LE. Adaptor and clathrin exchange at the plasma membrane and trans-Golgi network. Mol Biol Cell. 2003;14:516–28. doi: 10.1091/mbc.E02-06-0353. [DOI] [PMC free article] [PubMed] [Google Scholar]
- 37.Raiborg C, Wesche J, Malerod L, Stenmark H. Flat clathrin coats on endosomes mediate degradative protein sorting by scaffolding Hrs in dynamic microdomains. J Cell Sci. 2006;119:2414–24. doi: 10.1242/jcs.02978. [DOI] [PubMed] [Google Scholar]
- 38.Patterson GH, Lippincott-Schwartz J. A photoactivatable GFP for selective photolabeling of proteins and cells. Science. 2002;297:1873–7. doi: 10.1126/science.1074952. [DOI] [PubMed] [Google Scholar]
- 39.Zhao Y, Gaidarov I, Keen JH. Phosphoinositide 3-kinase C2alpha links clathrin to microtubule-dependent movement. J Biol Chem. 2007;282:1249–56. doi: 10.1074/jbc.M606998200. [DOI] [PubMed] [Google Scholar]
- 40.Maxfield FR, McGraw TE. Endocytic recycling. Nat Rev Mol Cell Biol. 2004;5:121–32. doi: 10.1038/nrm1315. [DOI] [PubMed] [Google Scholar]
- 41.Knuehl C, Chen CY, Manalo V, Hwang PK, Ota N, Brodsky FM. Novel binding sites on clathrin and adaptors regulate distinct aspects of coat assembly. Traffic. 2006;7:1688–700. doi: 10.1111/j.1600-0854.2006.00499.x. [DOI] [PubMed] [Google Scholar]
- 42.El-Annan J, Brown D, Breton S, Bourgoin S, Ausiello DA, Marshansky V. Differential expression and targeting of endogenous Arf1 and Arf6 small GTPases in kidney epithelial cells in situ. American journal of physiology Cell physiology. 2004;286:C768–78. doi: 10.1152/ajpcell.00250.2003. [DOI] [PubMed] [Google Scholar]
- 43.Altschuler Y, Liu S, Katz L, Tang K, Hardy S, Brodsky F, Apodaca G, Mostov K. ADP-ribosylation factor 6 and endocytosis at the apical surface of Madin-Darby canine kidney cells. J Cell Biol. 1999;147:7–12. doi: 10.1083/jcb.147.1.7. [DOI] [PMC free article] [PubMed] [Google Scholar]
- 44.Claing A, Chen W, Miller WE, Vitale N, Moss J, Premont RT, Lefkowitz RJ. beta-Arrestin-mediated ADP-ribosylation factor 6 activation and beta 2-adrenergic receptor endocytosis. J Biol Chem. 2001;276:42509–13. doi: 10.1074/jbc.M108399200. [DOI] [PubMed] [Google Scholar]
- 45.Hashimoto S, Onodera Y, Hashimoto A, Tanaka M, Hamaguchi M, Yamada A, Sabe H. Requirement for Arf6 in breast cancer invasive activities. Proceedings of the National Academy of Sciences of the United States of America. 2004;101:6647–52. doi: 10.1073/pnas.0401753101. [DOI] [PMC free article] [PubMed] [Google Scholar]
- 46.Chardin P, Paris S, Antonny B, Robineau S, Beraud-Dufour S, Jackson CL, Chabre M. A human exchange factor for ARF contains Sec7- and pleckstrin-homology domains. Nature. 1996;384:481–4. doi: 10.1038/384481a0. [DOI] [PubMed] [Google Scholar]
- 47.Maranda B, Brown D, Bourgoin S, Casanova JE, Vinay P, Ausiello DA, Marshansky V. Intra-endosomal pH-sensitive recruitment of the Arf-nucleotide exchange factor ARNO and Arf6 from cytoplasm to proximal tubule endosomes. J Biol Chem. 2001;276:18540–50. doi: 10.1074/jbc.M011577200. [DOI] [PubMed] [Google Scholar]
- 48.Shmuel M, Santy LC, Frank S, Avrahami D, Casanova JE, Altschuler Y. ARNO through its coiled-coil domain regulates endocytosis at the apical surface of polarized epithelial cells. J Biol Chem. 2006;281:13300–8. doi: 10.1074/jbc.M513723200. [DOI] [PubMed] [Google Scholar]
- 49.Volpicelli-Daley LA, Li Y, Zhang CJ, Kahn RA. Isoform-selective effects of the depletion of ADP-ribosylation factors 1–5 on membrane traffic. Mol Biol Cell. 2005;16:4495–508. doi: 10.1091/mbc.E04-12-1042. [DOI] [PMC free article] [PubMed] [Google Scholar]
- 50.Popoff V, Langer JD, Reckmann I, Hellwig A, Kahn RA, Brugger B, Wieland FT. Several ADP-ribosylation Factor (Arf) Isoforms Support COPI Vesicle Formation. J Biol Chem. 2011;286:35634–42. doi: 10.1074/jbc.M111.261800. [DOI] [PMC free article] [PubMed] [Google Scholar]
- 51.Cohen LA, Honda A, Varnai P, Brown FD, Balla T, Donaldson JG. Active Arf6 recruits ARNO/cytohesin GEFs to the PM by binding their PH domains. Mol Biol Cell. 2007;18:2244–53. doi: 10.1091/mbc.E06-11-0998. [DOI] [PMC free article] [PubMed] [Google Scholar]
- 52.Racine V, Sachse M, Salamero J, Fraisier V, Trubuil A, Sibarita JB. Visualization and quantification of vesicle trafficking on a three-dimensional cytoskeleton network in living cells. J Microsc. 2007;225:214–28. doi: 10.1111/j.1365-2818.2007.01723.x. [DOI] [PubMed] [Google Scholar]
- 53.Boulanger J, Kervrann C, Bouthemy P, Elbau P, Sibarita JB, Salamero J. Patch-based nonlocal functional for denoising fluorescence microscopy image sequences. IEEE Trans Med Imaging. 2010;29:442–54. doi: 10.1109/TMI.2009.2033991. [DOI] [PubMed] [Google Scholar]
Associated Data
This section collects any data citations, data availability statements, or supplementary materials included in this article.
Supplementary Materials
FRAP recovery curves were obtained from COS-1 cells expressing GFP-clathrin alone (open circles) or GFP-clathrin and Arf6(Q67L) (closed circles). For details, see Methods.
Same cell imaged before (left panels) and after (right panels) BFA treatment for GFP-clathrin fluorescence. Following BFA, loss of TGN and some immobile clathrin structures are observed, as well as an increase in diffuse, soluble clathrin fluorescence. But rapidly moving G-clathrin persists. Regions in red boxes are enlarged in lower panels. Persistence of the G-clathrin/GGA1 structures is more evident when imaging GGA1, which lacks the background of stationary clathrin structures (see video S2). Continuous image streams, 1 sec in duration and ≈5.3 μm square in upper panels, were captured as described in Fig. 1 and are played at real-time (30 Hz).
Same cell imaged before (left) and after (right) BFA treatment for YFP-GGA1 fluorescence. Following BFA, loss of TGN and some immobile GGA1 structures are observed, as well as an increase in diffuse, soluble GGA1 fluorescence. But rapidly moving G-GGA1 persists. Continuous image streams, each ≈5.3 μm square and 1 sec in duration, were captured as described in Fig. 1 and are played at real-time (30 Hz).
Video shows a montage of a ≈5.3 μm square region of cell expressing Arf6(Q67L)-GFP[INT] (upper left) and mCherry-clathrin (upper right), with merge in lower left panel. Blue boxes indicate regions with colocalized G-clathrin and Arf6. Continuous image streams were captured as described in Fig. 1.
Left panels show a 1 sec continuous image stream of GFP-clathrin fluorescence taken immediately after photoactivation from regions of cells expressing PA-GFP-clathrin alone (upper panels) or PA-GFP-clathrin and Arf6(Q67L) (lower panels): several G-clathrin structures can be visualized in each case. After 40 sec another image stream from the same regions was captured (right panels): G-clathrin structures are not detectable in cells expressing only GFP-clathrin but persist in cells expressing Arf6(Q67L), consistent with the half-times for exchange measured by FRAP and providing direct evidence of much longer G-clathrin lifetime. Each panel ≈5.3 μm square.