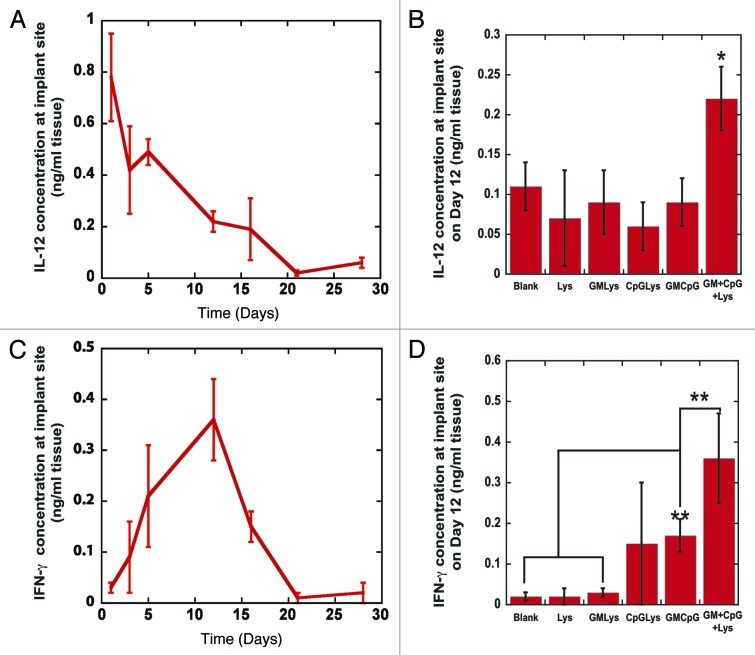
Figure 3.
Kinetics of IL-12 and IFN-γ production at vaccine site. (A) The concentrations of IL-12 at the implant site of PLG vaccines as a function of time post-implantation. (B) The in vivo concentration of IL-12 at the implant site of blank matrices (Blanks), PLG vaccines (GM+CpG+LYS) or matrices loaded with either Lysate alone (Lys) or Lysate with 3000ng of GM-CSF (GM+Lys) or Lysate with100 μg PEI-CpG-ODN (CpG+Lys) or the combination of GM-CSF and PEI-CpG-ODN (GM+CpG) at Day 12 after implantation into the backs of C57BL/6J mice. (C) The concentration of IFN-γ at the implant site of PLG vaccines as a function of time post-implantation. (D) The in vivo concentration of IFN-γ at the implant site of blank matrices (Blanks), PLG vaccines (GM+CpG+LYS) or matrices loaded with either Lysate alone (Lys) or Lysate with 3000ng of GM-CSF (GM+Lys) or Lysate with100 μg PEI-CpG-ODN (CpG+Lys) or the combination of GM-CSF and PEI-CpG-ODN (GM+CpG) at Day 12 after implantation into the backs of C57BL/6J mice. Values in A, B, C and D represent mean and standard deviation (n = 4 or 5). *p < 0.05** p < 0.01 as compared with controls.

