Abstract
Digital breast tomosynthesis (DBT) is a limited-angle tomographic x-ray imaging technique that reduces the effect of tissue super position observed in planar mammography. An integrated imaging platform that combines DBT with near infrared spectroscopy (NIRS) to provide co-registered anatomical and functional imaging is under development. Incorporation of anatomic priors can benefit NIRS reconstruction. In this work, we provide a segmentation and classification method to extract potential lesions, as well as adipose, fibroglandular, muscle and skin tissue in reconstructed DBT images that serve as anatomic priors during NIRS reconstruction. The method may also be adaptable for estimating tumor volume, breast glandular content, and for extracting lesion features for potential application to computer aided detection and diagnosis.
I. Introduction
Mammogrphy provides a two-dimensional (2-D) projection image of the three-dimensional (3-D) breast that results in tissue superposition. This could lead to callbacks for additional imaging, missed cancers and false positives. Digital breast tomosynthesis [1] is a limited angle tomographic x-ray imaging technique that acquires multiple projections over an angular range of ~ ±15°. The acquired projections are reconstructed to ~1 mm thick slices parallel to the x-ray imaging detector using analytical or iterative methods [1–5]. Breast simulating phantom studies and clinical trials have shown the benefits of DBT [1, 5–7]. However, DBT provides anatomical images only. Near Infrared Spectroscopy (NIRS) allows non-invasive imaging of total hemoglobin, oxygen saturation, water content, optical scattering, and lipid concentration [8] through 10 cm of breast tissue. These properties are important physiological parameters that can characterize breast tissue and offer contrast in tumors [9, 10]. Increased total hemoglobin is likely in malignant versus benign lesions because of the leaky, more densely packed vasculature in breast cancers. Additionally, increased metabolism of malignant tumors could decrease hemoglobin oxygen saturation. However, NIRS exhibits poor spatial resolution due to excessive light scatter. Incorporating anatomic priors has shown to improve the spatial resolution and the quantitative accuracy of NIRS reconstruction [11–13]. Hence, we and others [14] are exploring the potential of a combined DBT-NIRS system.
II. Method
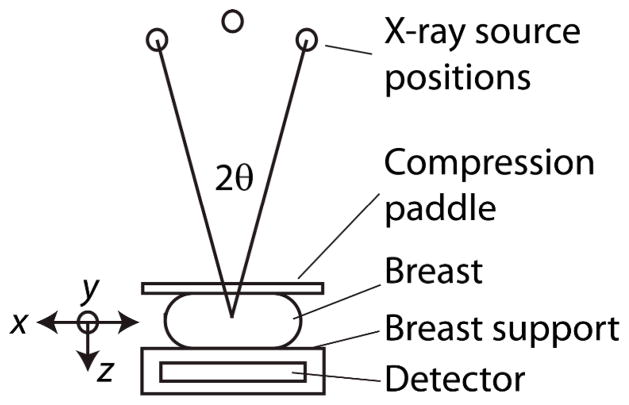
Segmentation and classification of reconstructed digital breast tomosynthesis images is non-trivial due to the severity of out-of-slice artifacts arising from angular under-sampling. In addition, DBT images contain more x-ray scatter than mammography due to the lack of an anti-scatter grid during acquisition of projections. X-ray scatter causes artifacts and quantitative inaccuracies in the reconstructed DBT images. Hence, a six-step process was developed and applied to anonymized images from a prior institutional review board (IRB)-approved, HIPAA-compliant clinical study [6]. Fig. 1 shows the imaging geometry (not drawn to scale) and the labeled axes that define the image coordinate system. Sequentially, the steps involved are: (1) angular-constrained bilateral filtering along the x-z plane; (2) unsharp masking along the x-y plane; (3) anisotropic diffusion filtering along the x-y plane; (4) background correction along the y-z plane; (5) fuzzy c-means based segmentation of the 3-D image stack; and (6) morphological operations for void filling of segmented areas. Rationale for each step is provided in their description below. All steps were implemented in MATLAB 7.7.0 (R2008) on an Intel Pentium workstation (2.67GHz dual quad-core processors, 24GB RAM, 64-bit Windows XP).
Fig. 1.
Imaging geometry for DBT acquisition (not drawn to scale), over the angular range of 2θ. The labeled axes define the orientation in which the filters are applied.
A. Angular-constrained bilateral filtering
The out-of-slice artifacts in DBT reconstructions appear as laterally shifted low-intensity copies of objects from slices other than in focus, with their intensity reducing as a function of distance from the slice in focus. If the reconstructed slices are stacked and viewed along the x-z plane, they appear as “X”-shaped artifacts. Fig. 2a shows an x-z plane from a clinical case that was reconstructed to 56 slices (z-axis) of 1 mm thickness. We chose a nonlinear edge-preserving bilateral filter [15–17] applied along the x-z plane to reduce these out-of-slice artifacts. Specifically, the bilateral filter proposed by Chen [16] was modified by incorporating a 2θ angular constraint corresponding to the acquisition angular range. Fig. 2b and 2c show the 23×23 Gaussian filter kernels before and after application of the 2θ = 30° constraint. Fig. 2d shows the corrected x-z plane corresponding to Fig. 2a that demonstrates a reduction in out-of-plane artifacts.
Fig. 2.
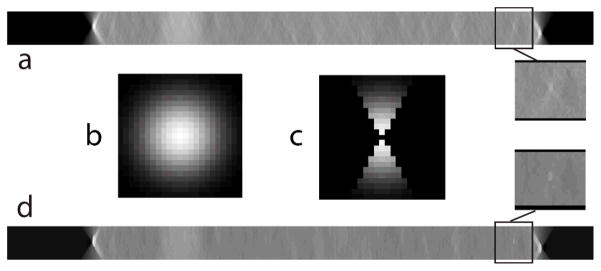
a. Shows an x-z plane image from the 3-D DBT image stack for a clinical case. b. 23 × 23 Gaussian kernel used in the bilateral filter before modification. c. Modified Gaussian kernel with an angular constraint of 2θ corresponding to the angular range during projection view acquisition. d. x-z plane after application of the angular-constrained bilateral filter that shows a reduction in out-of-plane artifacts. Zoomed (1.5×) regions of interest before and after application of the filter are shown.
B. Unsharp masking
We applied an unsharp masking technique along the x-y plane to provide edge enhancement. The images were low pass filtered with a 5×5 Gaussian kernel, followed by subtraction of the low pass filtered image from the original image. Addition of the resultant image with a weight of 2 provided edge enhancement. This above process could also increase the high frequency noise in the images. Hence, we used anisotropic diffusion filtering for noise regularization.
C. Anisotropic diffusion filtering
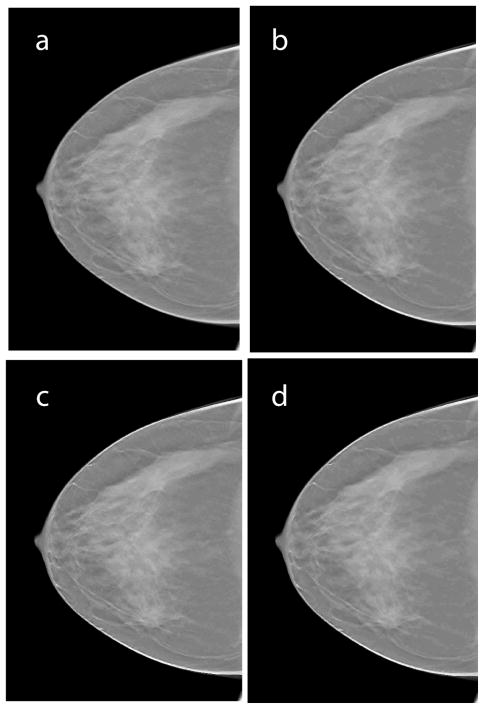
We applied an edge-preserving, iterative, anisotropic diffusion filter described by Perona and Malik [18] for noise regularization along the x-y plane. After multiple attempts, we found that a diffusion constant value of 30 that controls the sensitivity to gradients, with 5 iterations, yielded desired results. This filtering step is necessary to minimize the effect of noise while preserving the edges for segmentation. Fig 3 shows a slice (x-y plane) of the clinical case prior to and after application of each of the aforementioned steps. Visually, the filtered images showed reduced noise and do not appear to distort lesion features. This is particularly important if the techniques proposed in here were to be adapted for lesion feature extraction in computer aided detection and diagnosis.
Fig. 3.
Shows a single slice (x-y plane) of the reconstructed clinical case where the lesion is prominent prior to and after application of each of the following steps: a. reconstructed slice prior to filtering; b. after angle-constrained bilateral filtering; c. after unsharp masking; d. after anisotropic diffusion filtering. Visually the filtered images showed reduced noise and did not distort lesion features.
D. Background correction
Inclusion of x-ray scatter in DBT reconstructed images results in quantitative inaccuracies and cupping artifacts, wherein the slices (x-y plane) at the periphery of the breast have, on average, increased intensity relative to, those in the center of the breast. This effect coupled with substantial out-of-slice artifacts could be problematic for segmentation. If they are not accounted for and corrected, lesion contrast could be sufficient even in the top and bottom most slices (x-y plane) which are composed of skin, that could be segmented as part of the lesion. Hence, a background correction method is necessary.
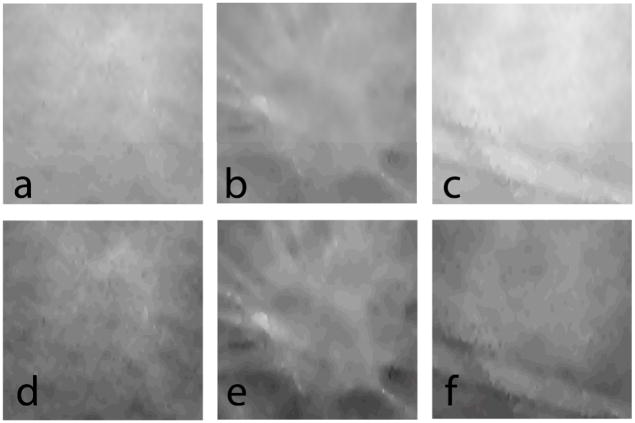
The user provides the input (single mouse click) on the location of the lesion from which the volume of interest (VOI) encapsulating the lesion was extracted. Within the VOI, normalizing the signal intensity in each slice (x-y plane) by its average computed over all slices corrected for fluctuations in mean signal intensity across slices. Fig. 4 shows three slices (x-y plane) extracted from the volume of interest prior to and after normalization.
Fig. 4.
Three slices (x-y plane) extracted from the volume of interest (VOI) encapsulating the lesion: a. top slice that is in contact with the compression paddle; b. slice that best represents the lesion; and c. bottom slice that is contact with the breast support. (a–c) are prior to and (d–f) are after VOI normalization.
Chan [19] described a background correction technique that was used with a method for computer-aided classification of mammograms. We applied a similar correction along the y-z plane. Fig. 5 shows a slice extracted from the VOI where the lesion is prominent, before and after application of the background correction.
Fig. 5.
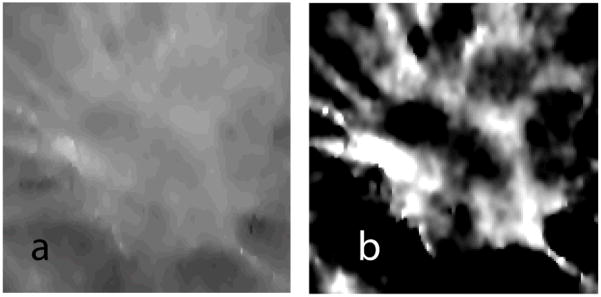
A slice (x-y plane) containing the lesion extracted from the VOI before (a), and after (b) background correction.
E. Fuzzy C-Means (FCM) segmentation
Fuzzy C-Means (FCM) clustering algorithm is a widely used automated and unsupervised technique for medical image segmentation [20]. Several investigators have applied this technique for lesion segmentation in digital mammography and breast MRI [19, 21, 22]. In our implementation, the FCM clustering algorithm classifies pixels with similar gray levels into a cluster. After initial arbitrary assignment of the center of a cluster, it is iteratively updated by minimizing an objective function that is dependent on the Euclidean distance of gray levels to the center of the cluster. We applied this FCM clustering method to segment the 3-D VOI into two clusters representing the background tissue and the lesion. This clustering generated a rough 2-D binary mask for each slice that needed further refinement. Fig. 6(a) shows the results of FCM clustering applied to a representative slice (x-y plane) of the VOI shown in Fig. 5(b).
Fig. 6.
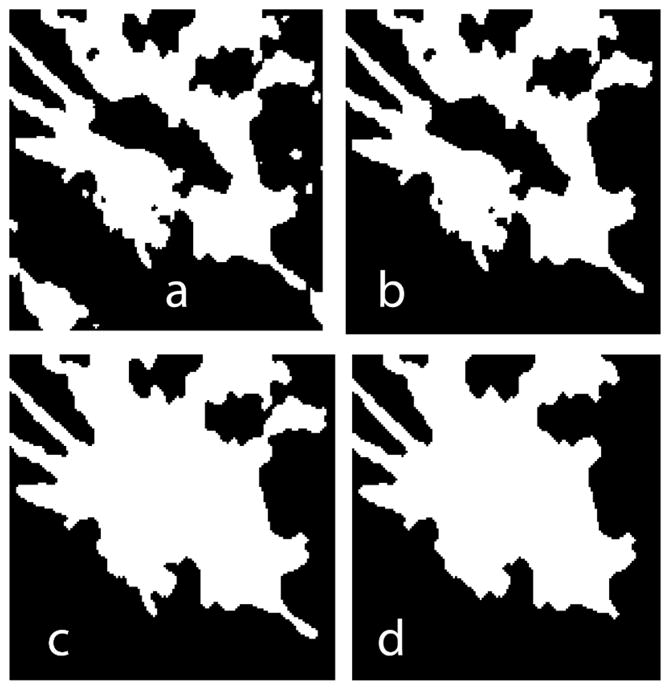
A slice (x-y plane) containing the lesion extracted from the VOI (a) after FCM-clustering based segmentation, (b) after area filtering to remove isolated segments, (c) after 3-D void filling, and, (d) final smooth mask.
F. Additional morphological operations
Masks generated from FCM clustering may result in isolated pixels that correspond to pixel gray levels similar to the lesion. Hence, additional morphological operations are required. The morphological operations performed were area filtering to extract the largest connected label to represent the lesion; 3-D void filling; removal of salt and pepper noise by morphological binary opening followed by binary closing; and, residual removal and mask smoothing by binary erosion followed by binary dilation. Fig. 6b through Fig. 6d shows the result after each step.
In addition to FCM-based segmentation of the lesion, application of the FCM clustering algorithm on each anisotropic diffusion filtered slice (x-y plane, similar to that shown in Fig. 3d) yielded segmentation for adipose, fibroglandular, skin, and muscle tissues. It was necessary to segment the lesion from the background independently of other tissues, as the gray level of the lesion is similar to fibroglandular tissue. Fig. 7a shows a representative DBT reconstructed slice prior to segmentation. Fig. 7b shows the segmented slice color-coded to represent skin (cyan), adipose (red), fibroglandular (yellow), muscle (magenta), and lesion (blue).
Fig. 7.
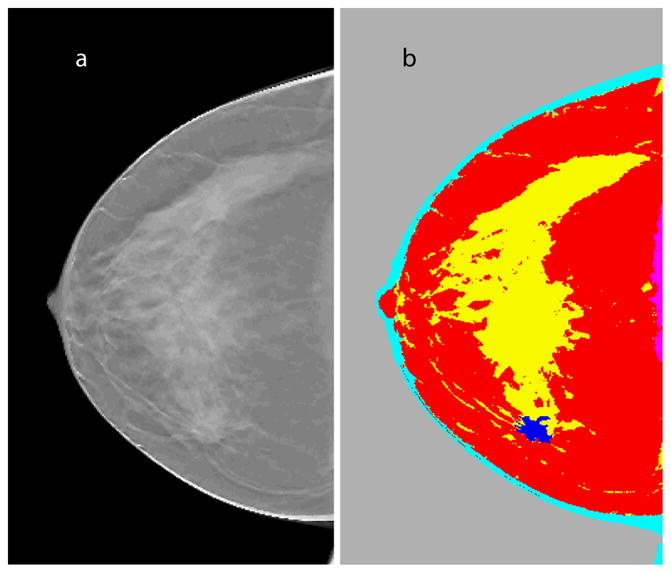
a. Representative slice (x-y plane) from DBT reconstruction that prominently shows the lesion; b. segmented slice color-coded to represent skin (cyan), adipose (red), fibroglandular (yellow), muscle (magenta), and lesion (blue).
III. Conclusion
The method presented here demonstrates a strategy for segmenting DBT images that are challenging due to out-of-slice artifacts and inclusion of x-ray scatter. The only user input required is the identification of the location of a possible lesion. Segmentation and classification of tissue types is fully automated. To date, the method has been applied to seven clinical datasets. Visually, the lack of lesion distortion suggests that the proposed technique may be adaptable for initial image processing as part of a computer-aided detection or diagnosis technique. We are pursuing additional refinements including improved estimation of skin layer thickness and determining filter parameters that are best suited for the task. Quantitative validation such as verifying the estimated tumor volume and glandular fraction content, and suitability of the method to provide NIRS anatomic priors are subjects of ongoing investigations.
Acknowledgments
The authors thank Steven P. Poplack, M.D., Dartmouth-Hitchcock Medical Center and Sarwat Hussain, M.D., University of Massachusetts Medical Center for reviewing the clinical images. The authors also thank Kenneth Brooks, Ph.D., and Chris Ruth, Ph.D., Hologic, Inc., for providing the clinical data.
This work was supported in part by the National Institutes of Health (NIH) and the National Cancer Institute (NCI) Grants R01 CA139449 and R01 CA128906. The contents are solely the responsibility of the authors and do not represent the official views of the NIH or the NCI.
Contributor Information
Srinivasan Vedantham, Department of Radiology, University of Massachusetts Medical School, Worcester, MA 01655 USA.
Linxi Shi, Department of Radiology, University of Massachusetts Medical School, Worcester, MA 01655 USA.
Andrew Karellas, Department of Radiology, University of Massachusetts Medical School, Worcester, MA 01655 USA.
Kelly E. Michaelsen, Thayer School of Engineering, Dartmouth College, Hanover, NH 03755 USA
Venkataramanan Krishnaswamy, Thayer School of Engineering, Dartmouth College, Hanover, NH 03755 USA.
Brian W. Pogue, Thayer School of Engineering, Dartmouth College, Hanover, NH 03755 USA
Keith D. Paulsen, Email: Keith.D.Paulsen@dartmouth.edu, Thayer School of Engineering, Dartmouth College, Hanover, NH 03755 USA
References
- 1.Niklason LT, Christian BT, Niklason LE, Kopans DB, Castleberry DE, OpsahlOng BH, Landberg CE, Slanetz PJ, Giardino AA, Moore R, Albagli D, DeJule MC, Fitzgerald PF, Fobare DF, Giambattista BW, Kwasnick RF, Liu JQ, Lubowski SJ, Possin GE, Richotte JF, Wei CY, Wirth RF. Digital Tomosynthesis in breast imaging. Radiology. 1997 Nov;205:399–406. doi: 10.1148/radiology.205.2.9356620. [DOI] [PubMed] [Google Scholar]
- 2.Wu T, Moore RH, Rafferty EA, Kopans DB. A comparison of reconstruction algorithms for breast tomosynthesis. Med Phys. 2004 Sep;31:2636–47. doi: 10.1118/1.1786692. [DOI] [PubMed] [Google Scholar]
- 3.Chen Y, Lo JY, Dobbins JT., 3rd Importance of point-by-point back projection correction for isocentric motion in digital breast tomosynthesis: relevance to morphology of structures such as microcalcifications. Med Phys. 2007 Oct;34:3885–92. doi: 10.1118/1.2776256. [DOI] [PubMed] [Google Scholar]
- 4.Zhang Y, Chan HP, Sahiner B, Wei J, Goodsitt MM, Hadjiiski LM, Ge J, Zhou C. A comparative study of limited-angle cone-beam reconstruction methods for breast tomosynthesis. Med Phys. 2006 Oct;33:3781–95. doi: 10.1118/1.223754. [DOI] [PMC free article] [PubMed] [Google Scholar]
- 5.Suryanarayanan S, Karellas A, Vedantham S, Baker SP, Glick SJ, D’Orsi CJ, Webber RL. Evaluation of linear and nonlinear tomosynthetic reconstruction methods in digital mammography. Acad Radiol. 2001 Mar;8:219–24. doi: 10.1016/S1076-6332(03)80530-5. [DOI] [PubMed] [Google Scholar]
- 6.Poplack SP, Tosteson TD, Kogel CA, Nagy HM. Digital breast tomosynthesis: initial experience in 98 women with abnormal digital screening mammography. AJR Am J Roentgenol. 2007 Sep;189:616–23. doi: 10.2214/AJR.07.2231. [DOI] [PubMed] [Google Scholar]
- 7.Suryanarayanan S, Karellas A, Vedantham S, Glick SJ, D’Orsi CJ, Baker SP, Webber RL. Comparison of tomosynthesis methods used with digital mammography. Acad Radiol. 2000 Dec;7:1085–97. doi: 10.1016/s1076-6332(00)80061-6. [DOI] [PubMed] [Google Scholar]
- 8.Srinivasan S, Pogue BW, Brooksby B, Jiang S, Dehghani H, Kogel C, Wells WA, Poplack S, Paulsen KD. Near-Infrared Characterization of Breast Tumors In-Vivo using Spectrally-Constrained Reconstruction. Tech Cancer Res Treat. 2005;4:513–526. doi: 10.1177/153303460500400505. [DOI] [PubMed] [Google Scholar]
- 9.Cerussi A, Shah N, Hsiang D, Durkin A, Butler J, Tromberg BJ. In vivo absorption, scattering, and physiologic properties of 58 malignant breast tumors determined by broadband diffuse optical spectroscopy. Journal of Biomedical Optics. 2006 Jul-Aug;11:044005. doi: 10.1117/1.2337546. [DOI] [PubMed] [Google Scholar]
- 10.Pogue BW, Jiang S, Dehghani H, Kogel C, Soho S, Srinivasan S, Song X, Tosteson TD, Poplack SP, Paulsen KD. Characterization of hemoglobin, water, and NIR scattering in breast tissue: analysis of intersubject variability and menstrual cycle changes. Journal of Biomedical Optics. 2004;9:541–52. doi: 10.1117/1.1691028. [DOI] [PubMed] [Google Scholar]
- 11.Brooksby B, Dehghani H, Pogue BW, Paulsen KD. Near infrared (NIR) tomography breast image reconstruction with a priori structural information from MRI: algorithm development for reconstructing heterogeneities. IEEE J STQE. 2003;9:199–209. [Google Scholar]
- 12.Guven M, Yazici B, Intes X, Chance B. Diffuse optical tomography with a priori anatomical information. Physics in Medicine & Biology. 2005 Jun 21;50:2837–58. doi: 10.1088/0031-9155/50/12/008. [DOI] [PubMed] [Google Scholar]
- 13.Carpenter CM, Pogue BW, Jiang S, Dehghani H, Wang X, Paulsen KD, Wells WA, Forero J, Kogel C, Weaver JB, Poplack SP, Kaufman PA. Image-guided optical spectroscopy provides molecular-specific information in vivo: MRI-guided spectroscopy of breast cancer hemoglobin, water, and scatterer size. Opt Lett. 2007 Apr 15;32:933–5. doi: 10.1364/ol.32.000933. [DOI] [PubMed] [Google Scholar]
- 14.Zhang Q, Brukilacchio TJ, Li A, Stott JJ, Chaves T, Hillman E, Wu T, Chorlton M, Rafferty E, Moore RH, Kopans DB, Boas DA. Coregistered tomographic x-ray and optical breast imaging: initial results. Journal of Biomedical Optics. 2005 Mar-Apr;10:024033. doi: 10.1117/1.1899183. [DOI] [PubMed] [Google Scholar]
- 15.Smith SM, Brady JM. SUSAN - A new approach to low level image processing. International Journal of Computer Vision. 1997 May;23:45–78. [Google Scholar]
- 16.Chen J, Paris S, Durand F. Real-time edge-aware image processing with the bilateral grid. ACM Transactions on Graphics - Proceedings of ACM SIGGRAPH 2007. 2007 Jul;26 [Google Scholar]
- 17.Tomasi C, Manduchi R. Bilateral filtering for gray and color images. Sixth International Conference on Computer Vision; Bombay. 1998. p. 839. [Google Scholar]
- 18.Perona P, Malik J. Scale-space and edge detection using anisotropic diffusion. IEEE Trans Pattern Anal Mach Intell. 1990;12:629–639. [Google Scholar]
- 19.Chan HP, Wei D, Helvie MA, Sahiner B, Adler DD, Goodsitt MM, Petrick N. Computer-aided classification of mammographic masses and normal tissue: linear discriminant analysis in texture feature space. Physics in Medicine and Biology. 1995 May;40:857–76. doi: 10.1088/0031-9155/40/5/010. [DOI] [PubMed] [Google Scholar]
- 20.Bezdek JC, Keller J, Krishnapuram R, Pai NR. Fuzzy Models and Algorithms for Pattern Recognition and Image Processing. Norwell, MA: Kluwer Academic Publishers; 1999. [Google Scholar]
- 21.Sahiner B, Chan HP, Wei D, Petrick N, Helvie MA, Adler DD, Goodsitt MM. Image feature selection by a genetic algorithm: application to classification of mass and normal breast tissue. Med Phys. 1996 Oct;23:1671–84. doi: 10.1118/1.597829. [DOI] [PubMed] [Google Scholar]
- 22.Chen W, Giger ML, Bick U. A fuzzy c-means (FCM)-based approach for computerized segmentation of breast lesions in dynamic contrast-enhanced MR images. Academic Radiology. 2006 Jan;13:63–72. doi: 10.1016/j.acra.2005.08.035. [DOI] [PubMed] [Google Scholar]


