Abstract
Purpose
The aim of this study was to characterize tumor growth of N1S1 cells implanted into the liver of Sprague Dawley rats in order to determine if this model could be used for survival studies. These results were compared with tumor growth after implantation with McA-RH77777 cells.
Materials and Methods
N1S1 cells or McA-RH77777 cells were implanted into the liver of Sprague Dawley rats (n=20 and n=12, respectively) using ultrasound (US) and tumor growth was followed using US. Additionally, we compared the serum profile of 19 cytokines in naïve rats to tumor bearing rats.
Results
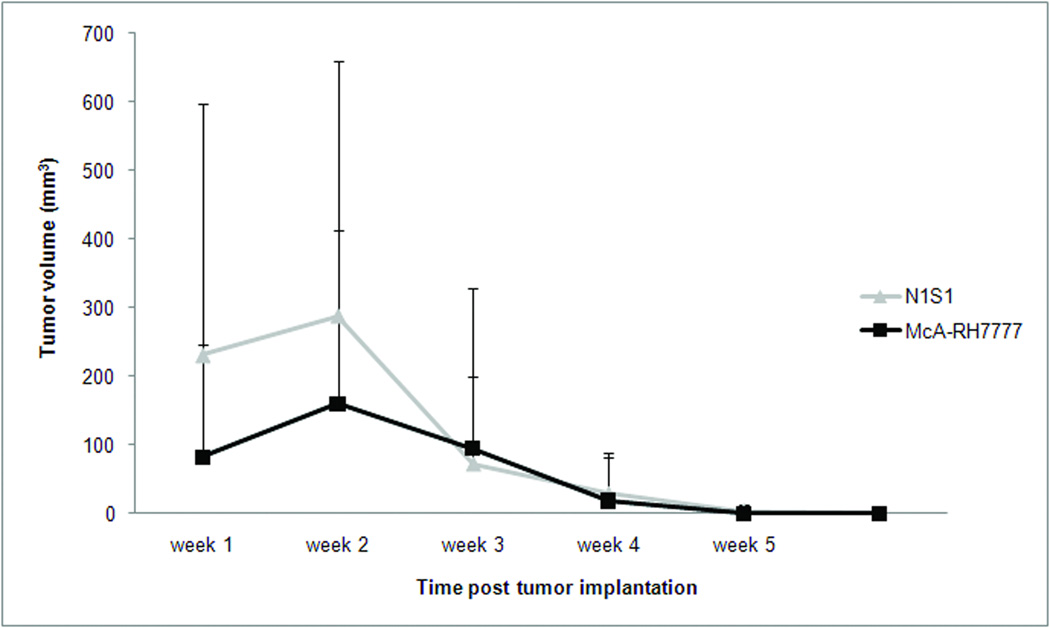
Both types of tumors were visible on US imaging 1 week after tumor implantation, but the mean tumor volume of N1S1 tumors was larger compared to McA-RH7777 tumors (231 mm3 versus 82.3 mm3, respectively). Tumor volumes in both groups continued to increase reaching a mean tumor volume of 289 mm3 and 160 mm3 in the N1S1 and McA-RH7777 group, respectively, 2 weeks post tumor implant. By week 3, tumor volumes had declined considerably, and 6 (50%) tumors in the McA-RH7777 had spontaneously regressed, versus 2 (10%) tumors in the N1S1 group. Tumor volumes continued to decrease over the following 3 weeks, and complete tumor regression of all tumors was seen 5 weeks and 6 weeks after tumor implantation in the McA-RH7777 and N1S1 group, respectively. In an N1S1 implanted rat, multiple cytokines that have been shown to correlate with the ability of the tumor to survive in a hostile environment were increased by up to 50%, whereas the average increase in cytokine levels was 90%. These findings suggest that the net cytokine environment favors an anti-tumor immune response. A similar trend was observed in a rat with a McA-RH77777 tumor, and the increase in cytokine levels was considerably more pronounced with an average increase of 320%.
Conclusion
We therefore conclude that this model cannot be used for survival studies, and should only be used with great caution in short-term studies that involve cancer therapies.
Introduction
Interventional oncologic treatments have become the mainstay of therapy for patients with unresectable hepatocellular carcinoma (HCC). Preclinical studies of the antitumor activity of novel interventional oncologic treatments for HCC require the selection of model systems that can answer specific questions regarding the interactions between thermal and chemoablative therapies and HCC tissue on the molecular level (1–2). Failure to consider whether a model can answer these questions often impedes or impairs advancement of the therapy. Thus, it is important to develop appropriate and readily available translational animal tumor models for interventional oncologic studies.
The N1S1 rat HCC model is a syngeneic orthotopic rodent model that has been used as a suitable animal model for interventional studies in HCC (3–4). This model is particularly valuable for biologic research because the tumor cells can be propagated in vitro, so bench assays can be performed before animal experiments, using the same tumor cells that will grow in vivo (5). This permits comprehensive molecular study of the effects of treatment on the tumor cells. Additionally, the model allows complex catheterization techniques used clinically in interventional radiology which is not possible in established models of liver cancer in smaller animals. Further, it can be easily imaged by conventional radiological methods, is relatively inexpensive and does not require immune suppression. Finally, most HCC develop in the presence of underlying liver disease. In Sprague Dawley rats, cirrhosis can be modeled by using common bile duct ligation (4, 6–7). However, the studies performed using the N1S1 model employed endpoints that required sacrifice of the animals within a maximum of 4 weeks of tumor implantation (8–14).
The aim of this study was to characterize tumor growth of N1S1 cells implanted into the liver of Sprague Dawley rat using Ultrasound (US), in order to determine whether this model could be used for growth kinetics and survival studies. These results were compared with tumor growth after implantation with non-syngeneic McA-RH77777 rat hepatoma cells. Additionally, we compared the serum profile of 19 cytokines in naïve rats with those of tumor bearing rats in both models.
Materials and Methods
Tumor cell lines and cell culture reagents
N1S1 and McA-RH77777 rat hepatoma cell lines were obtained from the American Type Culture Collection (Manassas, VA, USA). The N1S1 cell line was propagated in Iscove’s Modified Dulbecco’s Medium supplemented with 10% fetal bovine serum (FBS). The McA-RH77777 cell line was propagated in Dulbecco’s Modified Eagle’s Medium supplemented with 10% FBS. N1S1 cells were originally derived from carcinogenicity studies using Sprague Dawley rats whose diet included 4-dimethylaaminoasobenzene and McA-RH77777 cells were originally derived from carcinogenicity studies using Buffalo rats whose diet included N-2 fluorenylphthalamic acid (3, 15). Basement membrane matrix (matrigel) was obtained from BD Biosciences (Franklin Lakes, New Jersey, USA).
Animals
All animal handling and experimental procedures were conducted in accordance with the Guidelines of the Animal Care and Use Committee at our institution. A total of 32 adult Sprague Dawley rats weighing 200–300 grams (Charles River, Germantown, MD) were used for this study. 20 rats were implanted with N1S1 cells, and 12 rats were implanted with McA-RH77777 cells. Rats were maintained in laminar flow rooms at constant temperature and humidity, with food and water given ad libitum.
Percutaneous US-guided tumor implantation
Anesthesia was induced with a gas mixture of 2–5% isoflurane in 95% oxygen and maintained with 0.25–4% isoflurane via a nose cone. The rats were placed in a supine position, and the abdominal area was shaved and disinfected with betadine. The implantation site was identified using percutaneous ultrasonography (10 MHz sterile probe, VEVO2100, VISUAL SONICS Inc., Toronto, Ontario, Canada) via a low subcostal sonic window. An US-guided puncture with a 27 gauge needle was then performed 5–8 mm right lateral to the midsternal line directly adjacent to the probe surface with a 45° angle track. After the needle was advanced 3–5mm past the liver capsule, the angle track was adjusted to becoming parallel with the hepatic margin. The needle was then advanced an additional 4-6mm to the center of the thickest portion of the left lobe, followed by a slow injection (30–40 seconds) of a 100 ul of inoculation mix. Before tumor implantation, the cell viability of the tumor cells was confirmed with a trypan blue viability assay. Inoculation mix consisted of 50% cell suspension and 50% matrigel, with a total of 2.0–2.5 × 10⁶ cells injected per rat. The viability of each batch of cells was determined with a Trypan blue viability assay just prior to injection and only suspensions with >90% viability were used. After tumor cell injection, the needle was retracted and US probe compression of the implantation area was performed for 10 seconds to minimize postprocedural bleeding. A final ultrasonographic image was taken during probe compression in order to verify accurate implantation. Tumor size was measured on a weekly basis using ultrasound, and tumor volumes were plotted for data analysis. The histology of the liver tumors induced by N1S1 tumor implantation was determined in 6 rats. These rats were sacrificed 2 weeks (n=2), 4 weeks (n=2) and 7 weeks (n=2) post tumor implantation, to represent a growing tumor, a regressing tumor and a regressed tumor, respectively (Table 1). After sacrifice, the liver was fixed in formalin and sections were stained with hematoxylin and eosin (H&E) and evaluated under a light microscope. All other rats (n=14 N1S1 rats and n=12 McA-RH7777 rats) were followed until complete tumor disappearance (Table 1).
Table 1.
Study protocol
| Number of animals sacrificed | |||||
|---|---|---|---|---|---|
| Tumor Type | Week 2 | Week 4 | Week 7 | Complete tumor regression |
Total |
| N1S1 | N=2 | N=2 | N=2 | N=14 | N=20 |
| McA-RH7777 | N=0 | N=0 | N=0 | N=12 | N=12 |
Cytokine antibody array and assays
Blood serum samples were obtained in naïve rats and from the tail vein of rats implanted with an N1-S1 tumor (n=1) or McA-RH7777 tumor (n=1), post-implant day 14 (with ultrasound confirmation of tumor presence), and post-tumor regression (in the same rat). The blood samples were left to clot at room temperature for approximately 1 hour before being centrifuged at 3000 rpm for 10 minutes at 4°C. The obtained serum was then stored at −80°C. A commercially available antibody array (RayBio Rat Antibody Array I Kit, Ray Biotech Inc., Norcross, GA) was used for multiplex analysis of 19 rat cytokines (GM-CSF, granulocyte macrophage colony stimulating factor; CNTF, ciliary neurotrophic factor; VEGF, vascular endothelial growth factor; Fractalkine; IFN-γ, interferon-gamma; IL-1α, interleukin-1 α; IL-1β, interleukin-1β; IL-4, interleukin-4; IL-6, interleukin-6; IL-10, interleukin-10; LIX, lipopolysaccharide-inducible CXC chemokine; Leptin; MCP-1, monocyte chemoattractant protein-1; MIP-3α, macrophage-inflammatory protein-3α; β-NGF, nerve growth factor β; TNF-α, tumor necrosis factor α; TIMP-1, tissue inhibitor of metalloproteinase 1; CINC-2, cytokine induced neutrophil chemoattractant-2; CINC-3, cytokine induced neutrophil chemoattractant-3) according to the manufacturer’s instructions. Briefly, membranes were placed in an eight-well tray with blocking buffer added and then incubated at room temperature for 30 minutes. 1 ml of diluted serum samples was then added to the membrane for a 2 hour incubation period at room temperature. The samples from each container were then decanted and washed with wash buffer at room temperature. Membranes were then incubated with biotin-conjugated antibodies at room temperature for 2 hours, followed by washing. Each membrane was then incubated with HRP-conjugated streptavidin at room temperature for 2 hours, followed by washing and incubation with detection buffer at room temperature for 2 minutes. Excess detection reagent was drained and the membrane was then exposed to x-ray film and the signal intensities were quantified using densitometry and normalized using positive controls consisting of biotin-conjugated IgG.
Results
The average procedure time for tumor implantation in this study was 4 minutes, and none of the animals required additional anesthesia after the initial administration. There was no procedural mortality; and no bleeding, bile leaks or wound infections were observed. One week after tumor implantation, a tumor that was located in the chosen area of the left lobe of the liver was visible on US imaging in all animals.
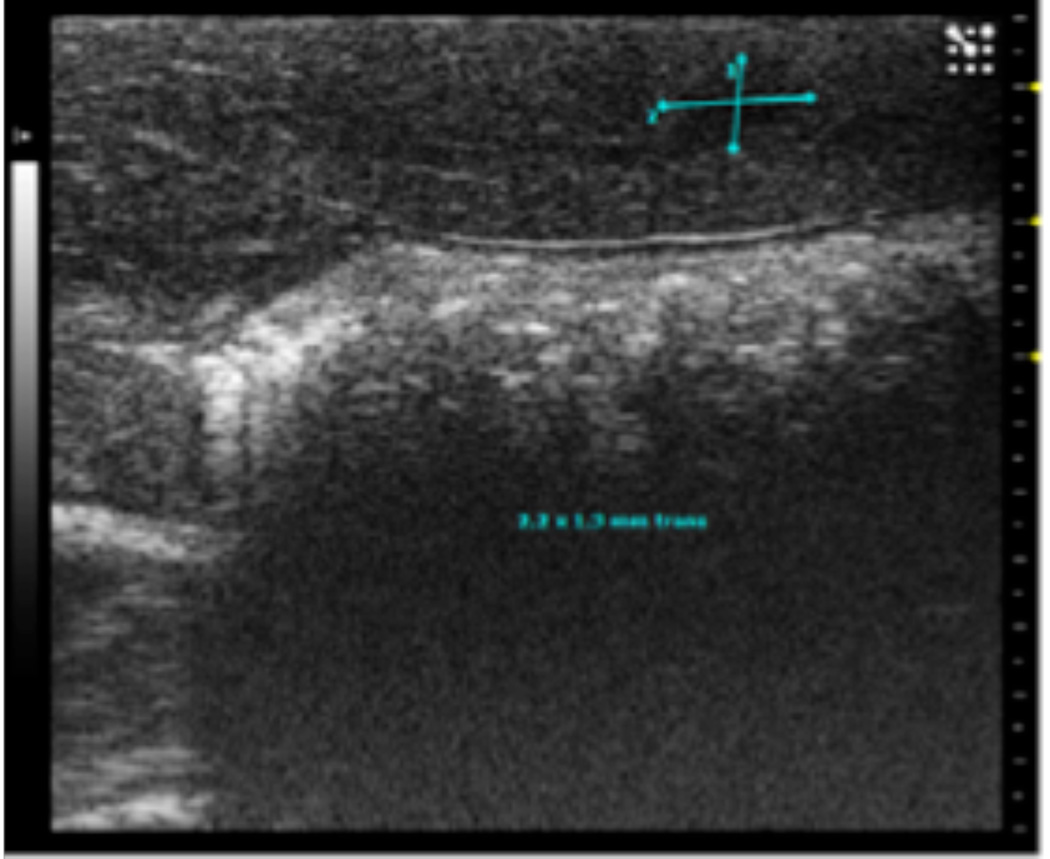
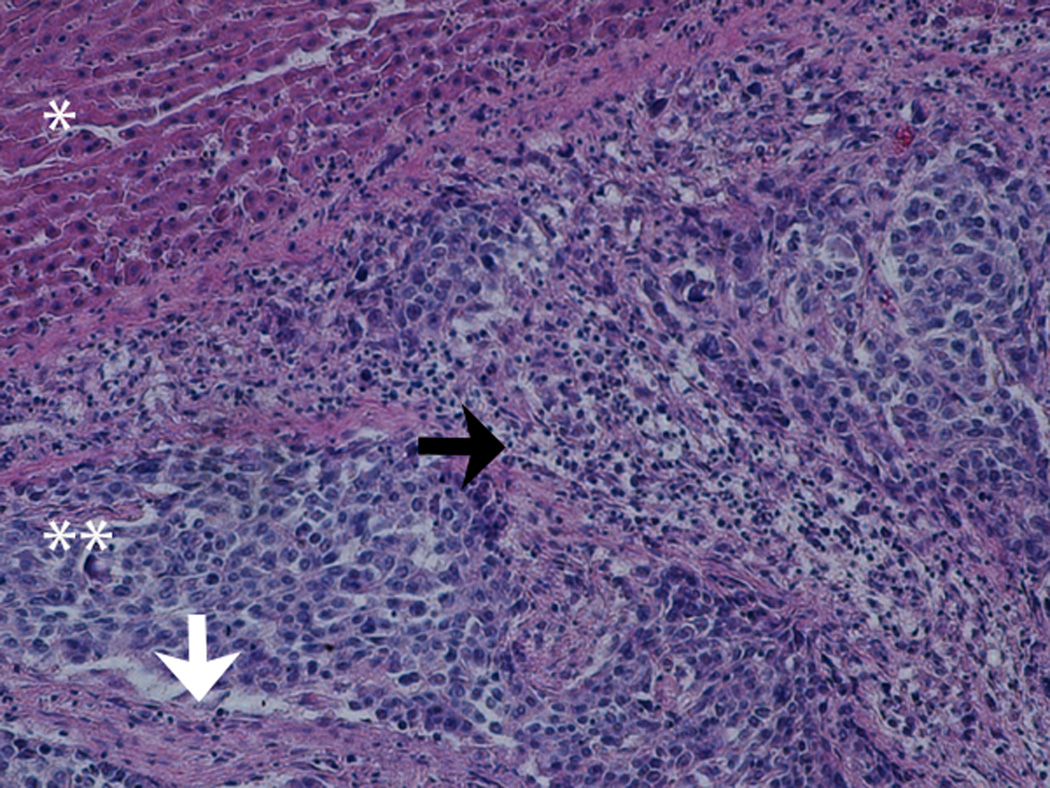
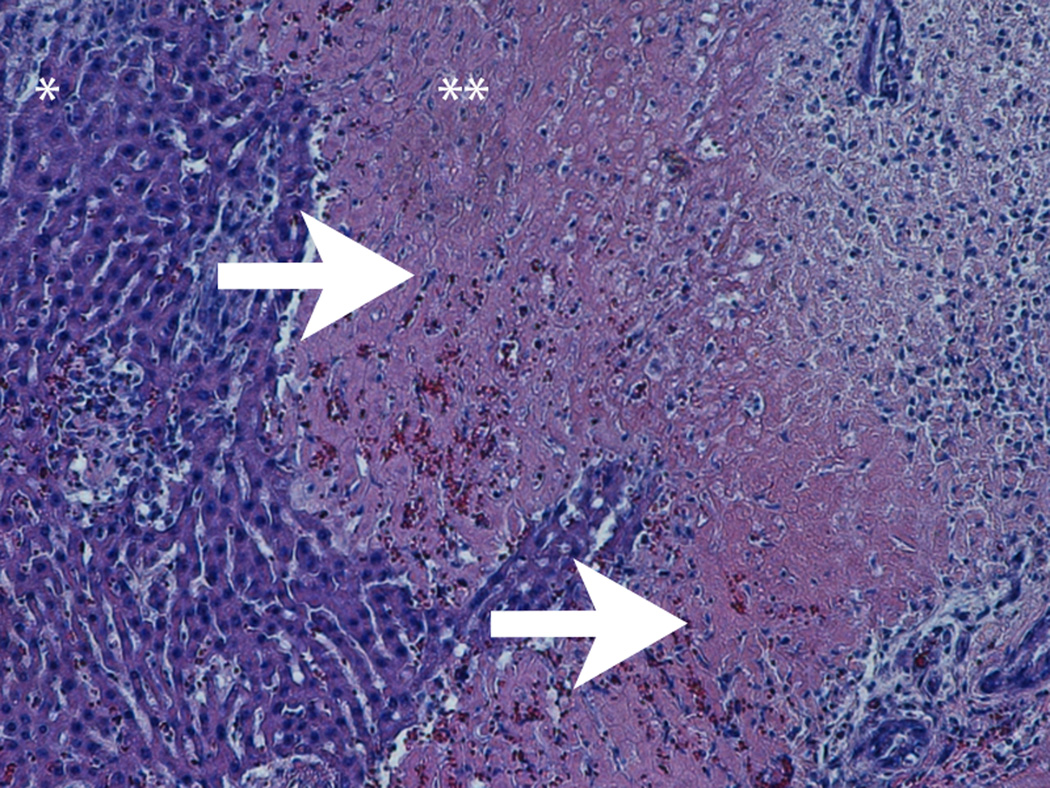
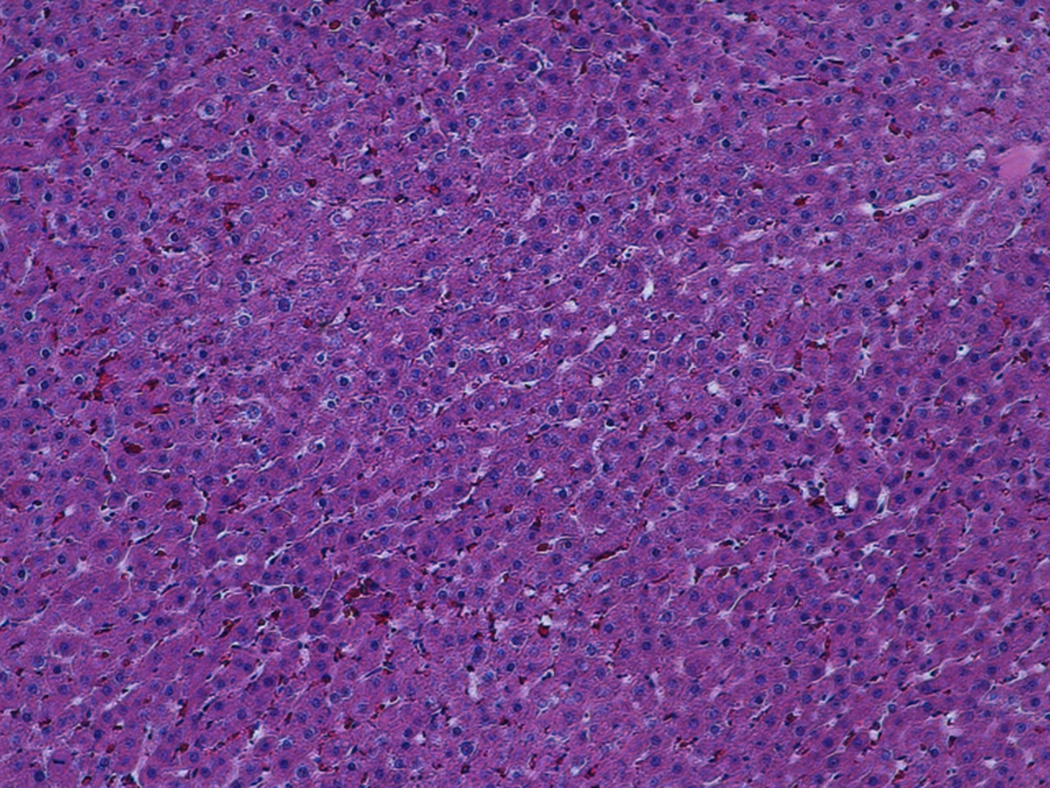
At the early stage of tumor development, the tumors appeared as hypoechoic nodules on US imaging (Figure 1A). Tumors continued to grow during the second week post-implant, and remained hypoechoic, however distinctly less so than what had been observed during the first week post-implant. Examination of H&E stained slides of the tumor showed that at that stage, the tumor was composed of anaplastic round cells with small areas of necrosis, fibrosis and infiltrating immune cells (Figure 1B). During weeks 3-4, the appearance of the tumors noticeably shifted to isoechoic in nature, and tumor size steadily decreased. Examination of H&E stained slides of the tumor showed large areas of necrosis and fibrosis (Figure 1C). By week 5, the tumors were almost completely regressed and replaced with a small patch of residual hyperechoic fibrous tissue, which disappeared by week 6. Examination of H&E stained slides of the liver at that stage revealed normal liver parenchyma with no residual tumor or inflammation (Figure 1D).
Figure 1.
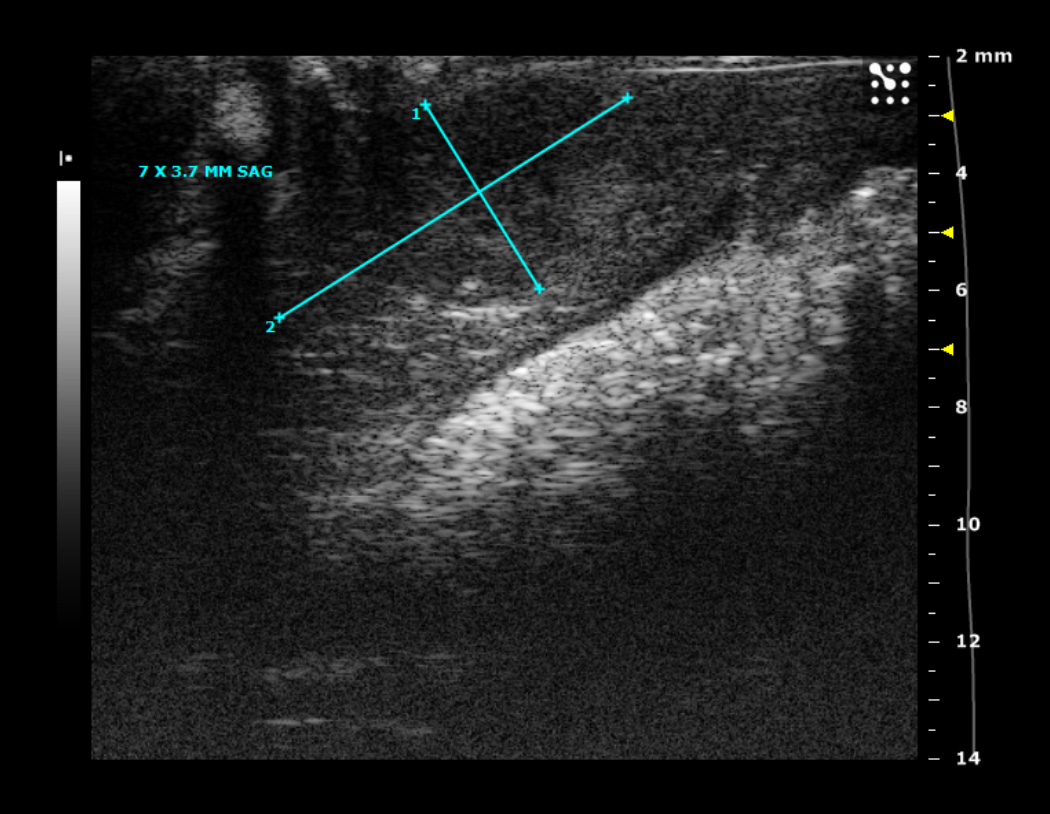
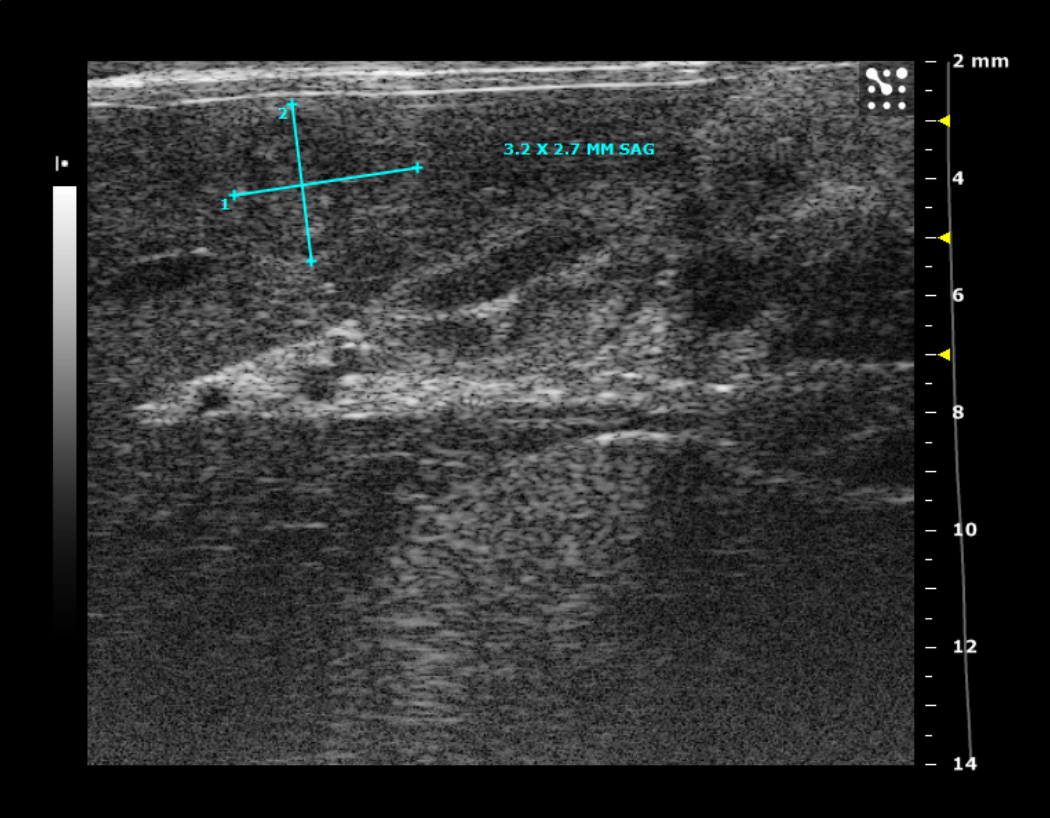
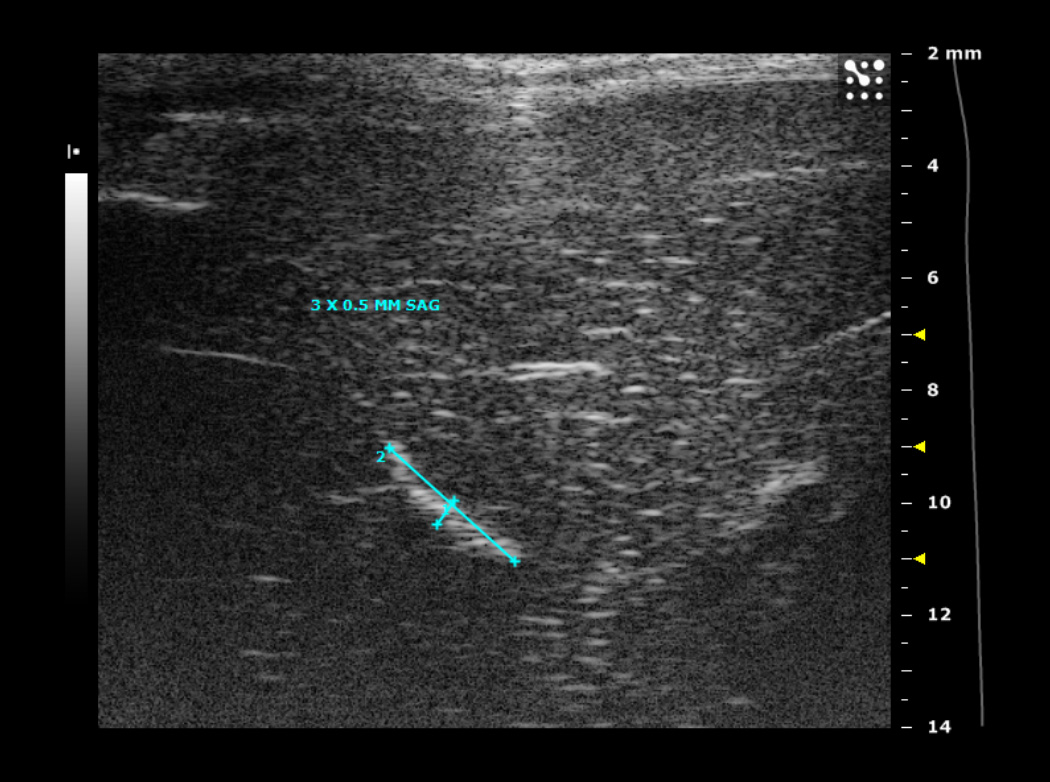
1A. Typical ultrasound images of an N1S1 liver tumor in the sagittal (sag) plane 1, 2, 3 and 4 weeks after tumor implantation. Notice the tumor size increased from 2.2 by 1.3 mm (in the sagittal plane) on imaging in week 1, to 7 by 3.7 mm in week 2, followed by a steady decrease in tumor size by week 3.
1B-D. H&E stained slides of the liver and tumor. (B) Representative slide, 2 weeks post tumor implantation. Liver (*) with tumor (**) composed of anaplastic round cells, with small areas of necrosis and fibrosis (white arrow) and infiltrating immune cells (black arrow). (C) Representative slide, 4 weeks post tumor implantation. Liver (*) with tumor (**) showing large areas of necrosis and fibrosis (white arrows). (D) Representative slide, 7 weeks post tumor implantation. Normal liver parenchyma with no residual tumor or inflammation.
The tumor growth curves of liver tumors established from both cell lines are shown in Figure 2. Both types of tumors were visible on US imaging 1 week after tumor implantation, but the mean tumor volume of N1S1 tumors was larger compared to McA-RH77777 tumors (231 mm3 versus 82.3 mm3, respectively). Tumor volumes in both groups continued to increase reaching a mean tumor volume of 289 mm3 and 160 mm3 in the N1S1 and McA-RH77777 group, respectively, 2 weeks post tumor implant. By week 3, tumor volumes had declined considerably, and 6 (50%) tumors in the McA-RH77777 had spontaneously regressed, versus 2 (10%) tumors in the N1S1 group (Table 2). Tumor volumes continued to decrease over the following 3 weeks, and complete tumor regression of all tumors was seen 5 weeks and 6 weeks after tumor implantation in the McA-RH77777 and N1S1 group, respectively.
Figure 2.
Tumor volume as determined by weekly ultrasound imaging in rats implanted with N1S1 (n=20) and McA-RH77777 (n=12) cells. Data are presented as mean +/− SD
Table 2.
Number of rats with complete regression of the tumor on weekly ultrasound imaging
| Tumor regression (number (%)) |
|||||
|---|---|---|---|---|---|
| Tumor Type | Week 2 | Week 3 | Week 4 | Week 5 | Week 6 |
| N1S1 (n=20) | 0 (0) | 2 (10) | 6 (30) | 15 (45) | 20 (100) |
| McA-RH7777 (n=12) | 0 (0) | 6 (50) | 10 (83) | 12 (100) | |
In order to determine the immune alterations associated with the spontaneous tumor regression we observed in our rat liver cancer models, we performed a cytokine analysis of the serum of naïve rats and rats with N1S1 and McA-RH77777 tumors (Figure 3). Our analysis showed that in the rat with a McA-RH77777 tumor, the serum levels of all cytokines tested had at least doubled when compared to baseline cytokine levels in the same rat, indicating an immune response had been mounted. Multiple cytokines that have been shown to correlate with the ability of the tumor to survive in a hostile environment, including β-NGF, TIMP-1, MCP-1 and leptin were increased by up to 160%, whereas the average increase in cytokine levels was 320%. A similar trend was observed in the rat with a N1S1 tumor, although the increase in cytokine levels was considerably less pronounced with an average increase of 90%. Several tumor growth promoting cytokines, including IL-6, LIX, TNF-α and VEGF were increased by less than 50%. This was not observed with cytokines that elicit an anti-tumor immune response. The only exception was GMCSF, which was increased by 25%. In both the McA-RH77777 implanted rat as well as the N1S1 implanted rat, cytokine levels were decreased to baseline levels after complete tumor regression.
Figure 3.
Serum profile of 19 cytokines before tumor implantation (baseline) and during tumor regression (tumor regression) in a rat implanted with N1S1 (3A) and a rat implanted with McA-RH77777 (3B) cells. Levels are expressed as arbitrary units.
Discussion
The N1S1 rat model has been used as an animal model of HCC suitable for testing image-guided percutaneous and catheter-directed ablation therapies, based on several advantages over other tumor models (8–14, 16). First, within 1 week after implantation, a liver tumor develops that can be visualized using conventional imaging methods and can be accessed using interventional oncologic procedures. Second, the N1S1 cell line can be propagated in vitro, and can thus be studied in parallel to animal investigations. Third, the immune system plays an important role in the development of HCC, and an immune competent model therefore better reflects human disease (7). Lastly, most patients with HCC are diagnosed in the background of underlying liver cirrhosis. In fact these cirrhotic changes are almost a pre-requisite for the formation of HCC. This ultimately makes HCC a disease with two distinct components that have to be addressed when developing novel therapeutic strategies. In Sprague Dawley rats, cirrhosis can be modeled by using common bile duct ligation (4, 6–7). However, for an animal model to be suitable for use in preclinical studies, reliable tumor growth is critical. We therefore followed liver tumor growth long term, and found that all tumors spontaneously regressed after an initial period of growth. Thus, the use of this animal model in preclinical interventional oncologic studies should be limited.
Liver tumor growth with rat hepatoma cells was previously achieved using cell suspension injected into the liver parenchyma of Sprague Dawley rats via an open surgical method. In this study we introduced a less invasive percutaneous US-guided method, which has been successfully used in the rabbit VX-2 model of liver cancer (17). Percutaneous US-guided implantation of N1S1 and McA-RH77777 cells was technically feasible and resulted in a liver tumor in all animals that could be visualized using ultrasound 1 week after implantation. There are several advantages of this method over the open surgical method. First, because it does not require an open abdominal incision, distress of the animal is minimized, a lesser amount of anesthesia can be used and there is a decreased risk of wound infections. Furthermore, the short procedure time eliminates the need to adjust the anesthesia to the procedure time, and is of considerable benefit in regards to the maintenance of the viability of the cells, as our viability assays showed that viability decreases below 90% as soon as 20 minutes after harvesting. Finally, real-time images during the procedure facilitate the choice of the proper implantation site, the visualization of the location of the needle tip and the visualization of blood vessels and bile ducts, thus reducing the risk of bleeding or bile leaks.
Our tumor growth curves indicate that tumor cell viability was maintained during the procedure as multiple tumors in both groups reached a diameter of > 1 cm, 2 weeks after implantation, which is a relatively large tumor size compared to the overall size of the liver in rats. Thus, tumor cell death due to technical issues is unlikely in this study. We therefore hypothesized transplanted tumors were rejected by the immune system, which is considered to be dependent on the local interaction of defensive immune reactions and tumor tolerance mechanisms (18).
The initiation of the effector stages of an immune response is largely controlled by cytokines, a group of signaling molecules that are involved in the communication between cells. However, cytokines may also be involved in carcinogenesis, tumor growth, invasion, and metastasis (19). Cytokines are produced by host stromal and immune cells in response to molecules secreted by the cancer cells or as part of inflammation that frequently accompanies tumor growth (20–21). Malignant cells also produce cytokines in the same environment. How a local cytokine network operates in tumors is determined by the array of expressed cytokines and their relative concentrations. In this study, we were not only able to establish liver tumors in Sprague Dawley rats using the syngeneic N1S1 cell line, but also using McARH77777 cells that are not syngeneic to this strain, indicating an initial immune tolerance of the tumor cells, followed by spontaneous tumor regression.
The increase in cytokine levels in this study was observed of cytokines that are known to elicit an effective anti-tumor immune response. Cytokines that are produced by the tumor cells in order to increase tumor cell survival were also elevated. However, anti-tumor cytokines were more elevated than tumor promoting cytokines. These findings suggest that the net cytokine environment is in favor of an anti-tumor immune response, providing an immunological basis for the observed spontaneous tumor regression. The increase in cytokine levels was considerably less pronounced in the N1S1 animal when compared to the McA-RH77777 animal. Since the N1S1 cell line was originally obtained from Sprague Dawley rats, these tumors are expected to be less immunogenic than non-syngeneic tumors. These results also provide a possible explanation for faster regression observed for N1S1 tumors compared to McA-RH77777 tumors.
There are several limitations to this study. First, the main pathogenic pathway of hepatocarcinogenesis in the presence of cirrhotic disease is associated with chronic tissue damage caused by hepatitis viral infection, toxins and immune or metabolic diseases. In our study, tumor cells were implanted in healthy livers. Moreover, it has been shown that tumors implanted in cirrhotic livers progress more rapidly (7). Thus, further studies determining tumor growth characteristics of N1S1 cells implanted in cirrhotic livers are warranted. Next, N1S1 cells implanted orthotopically, do not fully mimic tumors that develop spontaneously in a cirrhotic liver. However, the development of cirrhosis and subsequent tumors in rats is quite expensive and can take 3–4 months. As a result, the model used in this study may be more suitable for small animal studies. Additionally, the N1S1 cell line is of non-human origin and thus does not fully represent human HCC. Yet, the immune system plays an important role in HCC and cannot be studied when using human cell lines. Lastly, the cytokine assay was only performed in 1 animal with an N1S1 tumor and 1 animal with a McARH7777 tumor. This data therefore only provides background information and supportive scientific evidence. An extensive analysis of the profiles would have required a large number of additional animals, and falls outside the scope of this paper.
Our data demonstrate that, although the N1S1 cell line is syngeneic to Sprague Dawley rats, N1S1 tumor implantation into the liver of these rats results in an anti-tumor immune response, leading to the spontaneous regression of all tumors after an initial period tumor growth. This model can therefore not be used for survival studies, and should only be used with great caution in short-term studies that involve cancer therapies, as early regression most likely represents the ability of the tested therapy to increase the immune response rather than a direct effect on the tumor.
Acknowledgements
This work was supported by
-
-
The Abdulrahman Abdulmalik Research Fund
-
-
The Charles Wallace Pratt Research Fund
-
-
NIH T32 5T32EB006351-05 (Manon Buijs)
Just before this manuscript was submitted Mustafa Vali died unexpectedly. He was a great source of inspiration to us and will be greatly missed.
Abbreviations
- HCC
hepatocellular carcinoma
- TACE
transarterial chemoembolization
- US
ultrasound
- FBS
fetal bovine serum
- GM-CSF
granulocyte macrophage colonystimulating factor
- CNTF
ciliary neurotrophic factor
- VEGF
vascular endothelialgrowth factor
- IFN-γ
interferon-gamma
- IL-1α
interleukin-1 α
- IL-1β
interleukin-1β
- IL-4
interleukin-4
- IL-6
interleukin-6
- IL-10
interleukin-10
- LIX
lipopolysaccharide-inducible CXC chemokine
- MCP-1
monocyte chemoattractant protein-1
- MIP-3α
macrophage-inflammatory protein-3α
- β-NGF
nerve growth factor β
- TNF-α
tumor necrosis factor α
- TIMP-1
tissue inhibitor of metalloproteinase 1
- CINC-2
cytokine induced neutrophil chemoattractant-2
- CINC-3
cytokine induced neutrophil chemoattractant-3.
Footnotes
Publisher's Disclaimer: This is a PDF file of an unedited manuscript that has been accepted for publication. As a service to our customers we are providing this early version of the manuscript. The manuscript will undergo copyediting, typesetting, and review of the resulting proof before it is published in its final citable form. Please note that during the production process errors may be discovered which could affect the content, and all legal disclaimers that apply to the journal pertain.
References
- 1.Aravalli RN, Golzarian J, Cressman EN. Animal models of cancer in interventional radiology. Eur Radiol. 2009;19:1049–1053. doi: 10.1007/s00330-008-1263-8. [DOI] [PubMed] [Google Scholar]
- 2.Newell P, Villanueva A, Friedman SL, Koike K, Llovet JM. Experimental models of hepatocellular carcinoma. J Hepatol. 2008;48:858–879. doi: 10.1016/j.jhep.2008.01.008. [DOI] [PMC free article] [PubMed] [Google Scholar]
- 3.Novikoff AB. A transplantable rat liver tumor induced by 4-dimethylaminoazobenzene. Cancer Res. 1957;17:1010–1027. [PubMed] [Google Scholar]
- 4.Thompson SM, Callstrom MR, Knudsen B, et al. Development and preliminary testing of a translational model of hepatocellular carcinoma for MR imaging and interventional oncologic investigations. J Vasc Interv Radiol. 2012;23:385–395. doi: 10.1016/j.jvir.2011.11.018. [DOI] [PMC free article] [PubMed] [Google Scholar]
- 5.Ju S, McLennan G, Bennett SL, et al. Technical aspects of imaging and transfemoral arterial treatment of N1-S1 tumors in rats: an appropriate model to test the biology and therapeutic response to transarterial treatments of liver cancers. J Vasc Interv Radiol. 2009;20:410–414. doi: 10.1016/j.jvir.2008.12.408. [DOI] [PubMed] [Google Scholar]
- 6.Chen WY, Chen CJ, Liao JW, Mao FC. Chromium attenuates hepatic damage in a rat model of chronic cholestasis. Life Sci. 2009;84:606–614. [PubMed] [Google Scholar]
- 7.Tsujimoto T, Kuriyama S, Yamazaki M, et al. Augmented hepatocellular carcinoma progression and depressed Kupffer cell activity in rat cirrhotic livers. Int J Oncol. 2001;18:41–47. doi: 10.3892/ijo.18.1.41. [DOI] [PubMed] [Google Scholar]
- 8.Luo TY, Hsieh BT, Wang SJ, et al. Preparation and biodistribution of rhenium-188 ECD/Lipiodol in rats following hepatic arterial injection. Nucl Med Biol. 2004;31:671–677. doi: 10.1016/j.nucmedbio.2004.02.005. [DOI] [PubMed] [Google Scholar]
- 9.Bar-Yehuda S, Stemmer SM, Madi L, et al. The A3 adenosine receptor agonist CF102 induces apoptosis of hepatocellular carcinoma via deregulation of the Wnt and NF-kappaB signal transduction pathways. Int J Oncol. 2008;33:287–295. [PubMed] [Google Scholar]
- 10.Chi KH, Wang HE, Chen FD, et al. Preclinical evaluation of locoregional delivery of radiolabeled iododeoxyuridine and thymidylate synthase inhibitor in a hepatoma model. J Nucl Med. 2001;42:345–351. [PubMed] [Google Scholar]
- 11.Garin E, Denizot B, Roux J, et al. Description and technical pitfalls of a hepatoma model and of intra-arterial injection of radiolabelled lipiodol in the rat. Lab Anim. 2005;39:314–320. doi: 10.1258/0023677054307051. [DOI] [PubMed] [Google Scholar]
- 12.Guo Y, Jin N, Klein R, et al. Gas challenge-blood oxygen level-dependent (GC-BOLD) MRI in the rat Novikoff hepatoma model. Magn Reson Imaging. 2012;30:133–138. doi: 10.1016/j.mri.2011.09.007. [DOI] [PMC free article] [PubMed] [Google Scholar]
- 13.Guo Y, Zhang Y, Klein R, et al. Irreversible electroporation therapy in the liver: longitudinal efficacy studies in a rat model of hepatocellular carcinoma. Cancer Res. 2010;70:1555–1563. doi: 10.1158/0008-5472.CAN-09-3067. [DOI] [PMC free article] [PubMed] [Google Scholar]
- 14.Becker S, Ardisson V, Lepareur N, et al. Increased Lipiodol uptake in hepatocellular carcinoma possibly due to increased membrane fluidity by dexamethasone and tamoxifen. Nucl Med Biol. 2010;37:777–784. doi: 10.1016/j.nucmedbio.2010.03.013. [DOI] [PubMed] [Google Scholar]
- 15.Morris HP, Velat CA, Wagner BP, Dahlgard M, Ray FE. Studies of carcinogenicity in the rate of derivatives of aromatic amines related to N-2-fluorenylacetamide. J Natl Cancer Inst. 1960;24:149–180. [PubMed] [Google Scholar]
- 16.Babsky AM, Ju S, Bennett S, George B, McLennan G, Bansal N. Effect of implantation site and growth of hepatocellular carcinoma on apparent diffusion coefficient of water and sodium MRI. NMR Biomed. 2012;25:312–321. doi: 10.1002/nbm.1752. [DOI] [PubMed] [Google Scholar]
- 17.Lee KH, Liapi E, Buijs M, et al. Percutaneous US-guided implantation of Vx-2 carcinoma into rabbit liver: a comparison with open surgical method. J Surg Res. 2009;155:94–99. doi: 10.1016/j.jss.2008.08.036. [DOI] [PMC free article] [PubMed] [Google Scholar]
- 18.Smyth MJ, Dunn GP, Schreiber RD. Cancer immunosurveillance and immunoediting: the roles of immunity in suppressing tumor development and shaping tumor immunogenicity. Adv Immunol. 2006;90:1–50. doi: 10.1016/S0065-2776(06)90001-7. [DOI] [PubMed] [Google Scholar]
- 19.Vesely MD, Kershaw MH, Schreiber RD, Smyth MJ. Natural innate and adaptive immunity to cancer. Annu Rev Immunol. 2011;29:235–271. doi: 10.1146/annurev-immunol-031210-101324. [DOI] [PubMed] [Google Scholar]
- 20.Radoja S, Rao TD, Hillman D, Frey AB. Mice bearing late-stage tumors have normal functional systemic T cell responses in vitro and in vivo. J Immunol. 2000;164:2619–2628. doi: 10.4049/jimmunol.164.5.2619. [DOI] [PubMed] [Google Scholar]
- 21.Grivennikov SI, Greten FR, Karin M. Immunity, inflammation, and cancer. Cell. 2010;140:883–899. doi: 10.1016/j.cell.2010.01.025. [DOI] [PMC free article] [PubMed] [Google Scholar]


