

Abstract
Objective
To determine the utility of oral fluids for assessment of coronary and cardiovascular (CVD) health.
Study Design
Twenty-nine patients with pre-existing CVD disease underwent an invasive cardiac procedure (alcohol septal ablation or percutaneous coronary intervention) and provided unstimulated whole saliva (UWS), sublingual swabs (LS), gingival swabs (GS) and serum at 0, 8, 16, 24, 48 hr. Concentrations of 13 relevant biomarkers were determined and correlated with levels in serum and the oral fluids.
Results
Concentrations of the majority of biomarkers were higher in UWS than LS and GS. Coronary and CVD disease biomarkers in UWS correlated better with serum than LS and GS based on group status and measures of time effect. Seven biomarkers demonstrated time effect changes consistent with serum biomarkers, including C-reactive protein and troponin I.
Conclusions
Changes in serum biomarker profiles are reflected in oral fluids suggesting that oral fluid biomarkers could aid in the assessment of cardiac ischemia/necrosis.
Keywords: Alcohol Septal Ablation, Cardiac Biomarkers, Cardiovascular Disease, Myocardial Ischemia, Myocardial Necrosis, Saliva, Oral, Mouth
Whole saliva is a unique fluid standard deviation derived from the major and minor salivary glands. Its composition of organic and inorganic molecules, exfoliated cells, and microbes makes it a rich resource for the assessment of health. Its diagnostic capacity has been documented for nearly forty years1 and reviewed in many papers.2-6 Boosted by recent funding from the National Institutes of Health, proteomic studies have revealed more than 1000 proteins and 19,000 unique peptide sequences in saliva.7, 8 Yet, clinical utility for salivary diagnostics relative to the assessment of systemic disease has remained elusive.9-14
Use of oral fluids to assess aspect of systemic diseases, including cardiovascular disease (CVD) is an area of interest to many investigators.15 Advantageous to scientists, several serum biomarkers associated with inflammation, atherosclerosis, plaque stability and myocardial damage are known and can appear in oral fluids.16-21 However, a factor not yet well understood is which oral fluid would best reflect serum levels of these important biomarkers. To address this, we hypothesized that unstimulated whole saliva (UWS) would reflect myocardial status better than sublingual swabs (LS) or gingival swabs (GS). We investigated this hypothesis using a unique set of patients who presented with a pre-existing CVD (i.e., hypertrophic cardiomyopathy [HCM] or coronary artery disease [CAD]) and were scheduled for an invasive cardiac procedure (alcohol septal ablation [ASA] or percutaneous coronary intervention [PCI], respectively). We predicted that these conditions and procedures would result in a spectrum of serum levels of CVD biomarkers with significant spikes during the post-operative phase that would increase the probability that these biomarkers would appear in oral fluids. In previous studies, serum levels of troponins (Tn)I, creatine kinase (CK) and CK-MB have significantly increased in concentrations among patients undergoing ASA.22, 23 In addition, both matrix metalloproteinase (MMP)-9 and B-type natriuretic peptide (BNP) have demonstrated distinct biomarker trends in serum during the first 48 hours following ASA.24, 25 Here we report the novel findings that all three oral fluids contained detectable levels of CVD biomarkers, with seven biomarkers in UWS demonstrating time effect correlations with serum.
METHODS
Patients
Patients were eligible for study participation if they underwent ASA as treatment for HCM or PCI for coronary artery disease at the University of Kentucky Chandler Medical Center between May 1, 2007 and May 31, 2011. Diagnosis of obstructive HCM was based on established clinical and echocardiographic criteria. At our institution, ASA is performed for patients with HCM if they have severe symptoms (dyspnea, New York Heart Association (NYHA) heart failure class III to IV, Canadian Cardiovascular Society (CCS) anginal class 3 to 4, or recurrent exercise-induced syncope) and are refractory to medical therapy with left ventricular outflow tract gradients (LVOT) at rest ≥30mmHg or with provocation ≥50 mmHg. Criteria for undergoing PCI were consistent with current guideline recommendations and included those patients suffering from an acute coronary syndrome (ACS) or with chest pain found to have coronary arteries containing blockages of >70% stenosis considered to be the culprit lesion by the angiographer. Exclusion criteria included age less than 18 years, unable or unwilling to provide informed consent or provide samples, recently treated with chemotherapeutic drugs, anti-organ rejection drugs, or significant immune modulators within the last 3 months or during the course of the study, febrile illness or active infection at the time of enrollment, or were pregnant. Once screened, 21 patients treated with echocardiography-guided ASA and 10 patients treated with PCI were enrolled. Written informed consent was obtained from all patients before their procedure, and the study was approved by the University’s Institutional Review Board. All study participants were provided financial remuneration for their participation.
Catheter ablation
In all patients, arterial access was obtained from the femoral region and coronary angiography was performed. A transeptal puncture was made in the interatrial septum and a catheter was advanced into the left ventricular cavity to monitor LV pressures. A coronary guide catheter was positioned in the left main coronary artery ostium and a guidewire was advanced into the first septal perforating artery off the left anterior descending coronary artery. Definity® contrast was injected during transthoracic echocardiography to assess the localization and extent of the myocardial territory perfused by the target septal perforator. A coronary balloon was inflated at the origin of the septal perforation artery and if no leakage occurred and the perfused myocardial segment was considered responsible for the occurrence of the LVOT gradient, approximately 1 mL of 96% ethanol was slowly injected through the balloon into the vessel to be ablated. The balloon was deflated 5 minutes after infusion of alcohol. This procedure was repeated in the same or additional septal perforators until the LVOT gradient decreased to as low a gradient as possible, ideally zero mmHg. After the procedure, patients were monitored for 72 hours to observe for potential adverse events. Follow-up occurred in our cardiology clinic within the next two to four weeks where repeat transthoracic echocardiography was performed.
PCI
In all patients, arterial access was obtained from the femoral artery and coronary angiography was performed. Prior to angiography, antiplatelet agents were administered per guideline recommendations and once the culprit lesion was identified, patients were given antithrombotic agents also per guideline recommendations. A PCI was performed after first advancing a coronary guide catheter to the culprit vessel. A coronary guidewire was then advanced beyond the culprit lesion to the distal portion of the vessel. Over the guidewire, predilation was performed using a coronary balloon and following this, a stent was deployed at nominal pressures. For optimal stent expansion, some lesions were treated with rotational atherectomy and some lesions were treated with post-dilation following stent deployment. Additional stents were deployed as necessary to adequately revascularize the culprit vessel. Final angiography was performed to verify no peri-procedural complications from the PCI. Patients were monitored for a minimum of 12 hours for early post-operative complications.
Serum specimens
Serum, UWS, GS and LS samples were collected from each subject at baseline and at 8, 16, 24 and 48 hours post-procedure. Unstimulated whole expectorated saliva (5 mL) was collected according to a modification in the method described by Navazesh.26 Subjects rinsed their mouth with tap water, then expectorated whole saliva into sterile tubes containing a protease inhibitor solution (SIGMAFAST, Sigma, St. Louis, MO.) while seated in an upright position. Aware Messenger™ swabs (Calypte Life Sciences, Portland, OR) were used to collect GS and LS. For GS, one swab was rubbed along the facial aspect of the attached gingiva along the maxillary arch from the distal surface of the second molar region to the midline and reversed and swabbed along the opposite side over a period of 20 -30 seconds. A second swab was used in a similar manner to collect the transudate from the attached gingiva along the buccal surface of the mandibular arch. GS swabs were dounced in their respective collection tube, then samples were respectively combined by pipetting. For the LS, two Aware Messenger™ swabs were placed under the tongue simultaneously and adjacent to the sublingual salivary duct. After 2 minutes, swabs were placed into their respective collection tubes, dounced and combined into one tube. All samples were transported to the local laboratory on ice, centrifuged, separated into aliquots and stored at -80°C until analyzed. Unique to GS and LS, respective tubes were frozen at -20°C for at least 24 hr, then thawed, centrifuged, aliquoted and frozen at -80°C until analysis.
Immunoassays
All samples were analyzed in duplicate within three months of storage. Levels of the classic cardiac biomarkers cardiac TnI, CK-MB, myoglobin (MYO) and BNP were analyzed using a Beckman Access in the hospital CLIA certified laboratory. Concentrations of serum CRP, tumor necrosis factor (TNF)-α, soluble CD40 ligand (sCD40L), interleukin (IL)-1β, IL-6, adiponectin, MMP-9, MPO and soluble intracellular adhesion molecule (sICAM)-1 were determined in duplicate using Luminex® IS100-based multiplex kits (Millipore, St. Charles, MO, USA) according to the manufacturer’s directions in the University of Kentucky Center for Oral Health Research laboratory. Standards were included on all runs and all results are reported within the linearity of the assays.
Statistical analysis
Continuous demographic variables were presented as mean and standard deviation (SD) and discrete demographic variables as frequencies and percentages. Biomarker levels were presented as mean and SD by fluid and patient group. The two sample t-test was used to compare means between the groups for each fluid type. Similar results were obtained by basing the comparisons on the Wilcoxon rank sum statistic (results not shown). To determine if mean levels of a biomarker varied with time a linear mixed model for a single group repeated measures design was constructed. All statistical analyses were performed using the PC SAS 9.2 (SAS Institute Inc., Cary, NC, USA) with statistical significance determined at p<0.05 level.
RESULTS
Of 31 patients enrolled, 29 provided samples before and after the procedure and completed the study. Characteristics of the 19 ASA and 10 PCI patients are shown in Table 1. The majority of patients who underwent ablation were female, white and non-tobacco users. Patients who received PCI were predominantly male, tobacco users and older. All were Caucasian and alcohol use was infrequent in both groups. Over 90% had comorbid systemic diseases. No complications occurred during the PCI or in the immediate post-operative period. In 8 of 19 septal ablation patients complete heart block developed in the immediate post-operative period necessitating placement of a permanent pacemaker.
Table 1.
Demographics of the study population.
| Ablation | PCI | |
|---|---|---|
| N=19 | N=10 | |
| Age (yrs; mean +/- SD) | 58.58 +/- 13.41 | 66.1 +/- 9.31 |
| Female (%) | 63.2 | 10 |
| White (%) | 100 | 100 |
| Current Tobacco Use (%) | 47.4 | 60 |
| Current Alcohol Use (%) | 10.5 | 0 |
| Previous MI (%) | 15.8 | 60 |
| Comorbid conditions* | 94.7 | 90 |
Most common comorbidities were hypertension, coronary and peripheral artery disease, diabetes mellitus and cardiac arrhythmia.
Baseline biomarker levels in serum and UWS provide insight into clinical utility
Samples procured at baseline from the two groups were analyzed for 13 biomarkers associated with CVD to identify which oral fluid demonstrated clinical utility. Here we predicted that the pre-existing CVD would provide a spectrum of relevant biomarker levels in the baseline samples. Table 2 shows the serum, UWS, GS and LS concentrations detected at baseline in each group. Overall the mean concentrations displayed by the ASA patients were similar to those of the PCI group, except for serum BNP. Mean serum levels of adiponectin, BNP, CK-MB, CRP, IL-6, MMP-9, MPO, MYO, TNFα, sCD40-L and sICAM-1 were significantly higher (ranging from 2- to more than 20,000-fold) than concentrations in most oral fluids (p≤0.001). Only IL-1β in UWS was higher in concentration than serum, whereas TnI approximated serum levels in UWS, and GS levels approximated serum levels of IL-6. In general, the majority of biomarker concentrations in UWS were higher than those in GS and LS regardless of the CVD group, with the exception of CRP which was near equivalent in GS and UWS.
Table 2.
Mean concentrations of biomarkers in serum and oral fluids at baseline visit.
| Ablation | PCI | ||||
|---|---|---|---|---|---|
| Mean | Std | Mean | Std | ||
| Adiponectin | S | 24440.00 | 11599.38 | 24191.00 | 10279.57 |
| UWS | 39.95 | 53.80 | 48.78 | 67.55 | |
| GS | 2.16 | 2.53 | 1.14 | 1.09 | |
| LS | 2.01 | 3.30 | 0.83 | 0.83 | |
| BNP | S | 326.05* | 308.28 | 84.32 | 92.78 |
| UWS | 13.27 | 9.53 | 10.51 | 11.82 | |
| GS | 1.60 | 0.55 | 2.08 | 0.94 | |
| LS | 1.93 | 0.68 | 2.60 | 0.57 | |
| CK-MB | S | 2.92 | 1.72 | 3.64 | 5.36 |
| UWS | 0.29 | 0.31 | 0.53 | 0.85 | |
| GS | 0.04 | 0.07 | 0.00 | 0.00 | |
| LS | 0.00 | 0.00 | 0.00 | 0.00 | |
| CRP | S | 35781.30 | 59021.73 | 26560.50 | 49873.73 |
| UWS | 4.66 | 8.99 | 6.11 | 11.56 | |
| GS | 4.24 | 9.03 | 3.95 | 11.35 | |
| LS | 4.27† | 9.20 | 0.03 | 0.04 | |
| IL-1β | S | 87.20 | 328.46 | 127.29 | 394.49 |
| UWS | 135.58 | 198.81 | 127.84 | 169.10 | |
| GS | 1.07 | 0.80 | 0.55 | 0.32 | |
| LS | 3.27 | 5.30 | 0.77 | 0.49 | |
| IL-6 | S | 76.67 | 129.71 | 48.14 | 122.38 |
| UWS | 18.25 | 21.13 | 22.79 | 23.10 | |
| GS | 0.93 | 0.70 | 1.07 | 0.81 | |
| LS | 1.48 | 1.64 | 0.64 | 0.41 | |
| MMP-9 | S | 252215.70 | 396157.66 | 251010.90 | 307621.92 |
| UWS | 9808.03 | 16904.29 | 7244.71 | 14883.90 | |
| GS | 5718.05 | 13583.66 | 7444.61 | 17473.19 | |
| LS | 14.58 | 13.92 | 16.59 | 13.56 | |
| MPO | S | 149656.40 | 234395.66 | 165870.30 | 218208.36 |
| UWS | 9590.41 | 11074.34 | 8184.74 | 9518.86 | |
| GS | 4870.39 | 9443.62 | 5990.67 | 9359.94 | |
| LS | 35.92 | 13.96 | 129.47 | 249.20 | |
| MYO | S | 33.76 | 20.03 | 39.15 | 15.92 |
| UWS | 1.12 | 0.91 | 1.35 | 0.70 | |
| GS | 0.48 | 0.23 | 0.43 | 0.10 | |
| LS | 0.50 | 0.14 | 0.65 | 0.07 | |
| sCD-40L | S | 11082.10 | 7000.96 | 8550.90 | 2550.05 |
| UWS | 10.89 | 10.33 | 10.89 | 9.89 | |
| GS | 2.96 | 2.61 | 3.35 | 3.16 | |
| LS | 5.33 | 3.50 | 3.77 | 3.04 | |
| sICAM-1 | S | 230.47 | 123.96 | 241.30 | 83.96 |
| UWS | 1.75† | 1.57 | 3.31 | 2.90 | |
| GS | 0.22 | 0.12 | 0.31 | 0.18 | |
| LS | 0.20 | 0.18 | 0.29 | 0.20 | |
| TNFα | S | 53.65 | 109.45 | 37.26 | 90.96 |
| UWS | 9.58 | 15.42 | 6.81 | 4.55 | |
| GS | 1.20 | 1.59 | 0.99 | 0.89 | |
| LS | 2.04 | 4.15 | 0.81 | 0.68 | |
| TnI | S | 0.04 | 0.07 | 0.16 | 0.43 |
| UWS | 0.02 | 0.01 | 0.02 | 0.02 | |
| GS | 0.01 | 0.01 | 0.01 | 0.01 | |
| LS | 0.00 | 0.00 | 0.01 | 0.01 | |
ng/mL: TnI, CK-MB, MYO, CRP, Adiponectin, MMP-9, MPO, sICAM-1
pg/mL: BNP, IL-1β, IL-6, TNFα, sCD40-L
indicates significantly different from mean analyte value of PCI group (p <0.01)
indicates significantly different from mean value of PCI group (p<0.05). Both determined by two sample t-test.
Figure 1 shows the mean baseline concentrations of the 13 biomarkers for the entire study population. Here the relative magnitude differences in biomarker levels are evident with UWS consistently providing significantly higher biomarker concentrations (1 to 4 logs higher) than the other oral fluids (p≤0.001), with the exceptions of MYO (UWS vs. LS), MMP-9 (UWS vs. GS), and MPO (UWS vs. both GS and LS). These data thus indicate that the swab samples provided similar concentrations as UWS for select biomarkers.
Figure 1.
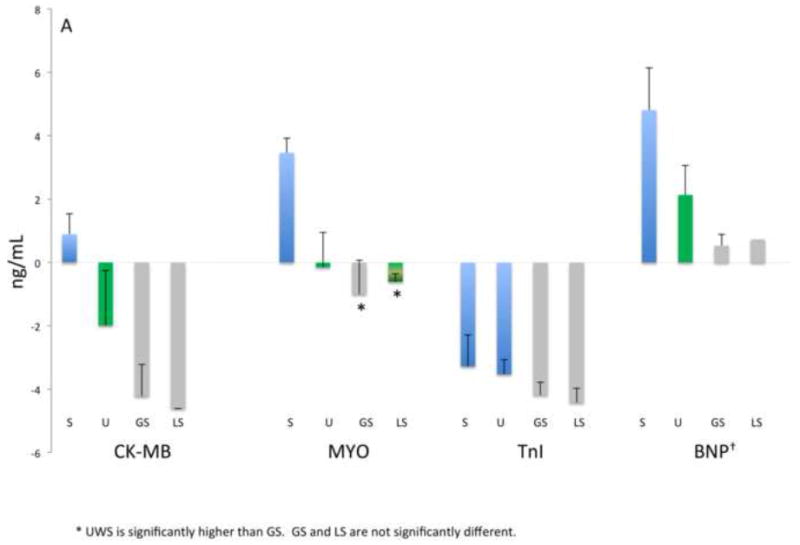
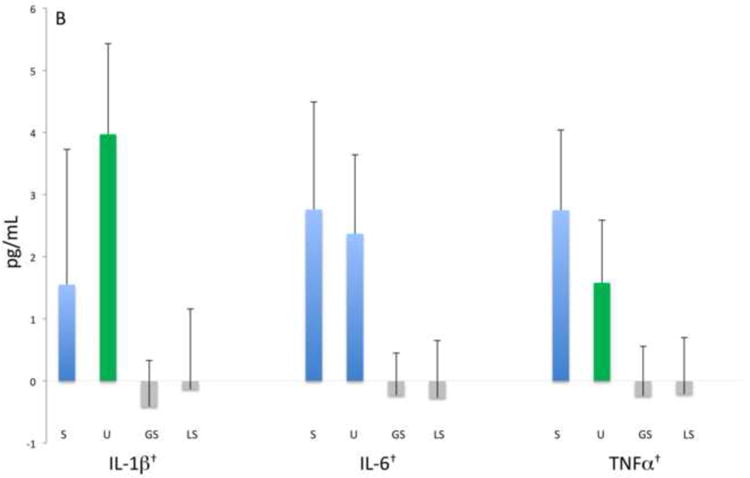
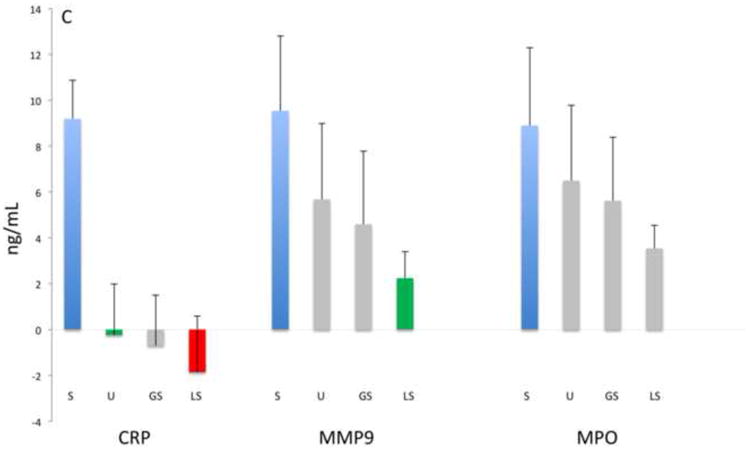
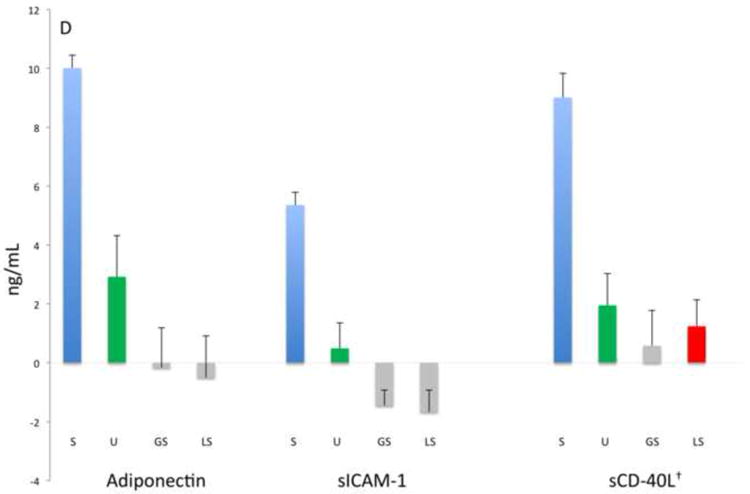
Analyte concentrations by fluid category and biomarker groups: A) Myocardial damage, B) inflammation-associated, C) acute phase protein and proteinases, D) lipid metabolism and atherosclerosis. Bars represent mean values (ng/mL, natural log) and mean standard errors for the entire study population except for BNP, IL-1β, IL-6, TNFα, sCD40-L that are pg/mL as indicated with †. Significant differences between concentrations (p<0.05) are indicated by different colored bars as determined by t-test.
UWS is a better fluid for identifying biomarkers of ablation than LS and GS
While the baseline concentrations of the targeted biomarkers were generally higher in UWS than LS and GS, we were interested to know which oral fluid displayed concentrations consistent with serum concentrations reflective of myocardial damage. To this end, we analyzed the time effect profile of the biomarkers in both CVD groups, but present data from only the ablation group in that the ablation procedure induced greater myocardial damage and more significant time effect changes than the PCI. Five time points were analyzed; one immediately before the ASA/PCI and then at 8, 16, 24 and 48 hr after the procedure. As shown in Table 3, nine serum biomarkers displayed significant kinetic patterns associated with the ASA procedure. In serum, the cardiac enzymes (CK-MB, MYO, TnI) as well as IL-6 and CRP displayed significant relationships with time. Of the oral fluids, UWS was most reflective of the kinetic relationship in serum, with 8 biomarkers displaying a significant time effect. In contrast, GS displayed only six biomarkers with time effect and LS displayed only three. Biomarkers that were consistent in displaying a significant time effect in both serum and UWS were: IL-6, MMP-9, sICAM-1, sCD40-L, CRP, TnI and adiponectin. Significant time effects in both serum and GS occurred with IL-6, MMP-9, CRP and adiponectin. Only CK-MB and TnI showed significant time effects in both LS and serum.
Table 3.
P values of biomarkers displaying time effect by fluid category after the ablation procedure.
| Biomarker | Serum | UWS | Gingival Swab (GS) | Lingual Swab (LS) |
|---|---|---|---|---|
| Adiponectin | 0.05029 | 0.00008* | 0.00190* | 0.68569 |
| BNP | 0.08779 | 0.28779 | 0.13080 | 0.01438 |
| CK-MB | <0.00001*† | 0.26881 | 0.33710 | 0.00190 |
| CRP | <0.00001*† | 0.00018* | 0.00028* | 0.42259 |
| IL-1β | 0.26365† | 0.05954 | 0.03847 | 0.72920 |
| IL-6 | <0.00001* | 0.01283 | 0.01008* | 0.97779 |
| MMP-9 | 0.00079 | 0.03863 | 0.03336 | 0.06385 |
| MPO | 0.65702 | 0.07573 | 0.61686† | 0.26365 |
| MYO | <0.00001* | 0.42032 | 0.48751 | 0.28580 |
| sCD-40L | 0.00023* | 0.00776 | 0.18001 | 0.64264 |
| sICAM-1 | 0.02836 | 0.00394* | 0.00256* | 0.23747 |
| TNFα | 0.19329 | 0.01565 | 0.10107 | 0.92526 |
| TnI | <0.00001*† | 0.03975 | 0.87367 | 0.02455 |
Data were log transformed and analyzed using a linear mixed model for a single group repeated measures design.
indicates p value was < 0.01 when ablation and PCI patients combined and analyzed
indicates p value was < 0.01 when only PCI patients were analyzed
DISCUSSION
The diagnostic workup for the identification of CVD utilizes many strategies including medical history, physical examination, serum biomarkers, stress testing, electrocardiogram and advanced imaging technologies. Of these, blood tests provide insight into biological aspects of CVD including signs of inflammation, atherosclerosis, plaque stability and myocardial necrosis. In as much as serum analytes enter the oral cavity through diffusion and ultrafiltration at the level of the acinar cells27, mucosa and periodontal sulci28, we sought to determine which oral fluid might reflect levels of serum biomarkers of CVD status. Our analysis of more than 500 specimens obtained from collection of serum and three oral fluids from 29 patients with pre-existing CVD demonstrated that the majority of 13 biomarkers of CVD are in highest concentration in UWS. In addition, we found that UWS provides a time effect biomarker profile more similar with serum than LS and GS, and select biomarkers associated with myocardial necrosis are evident in oral fluids.
The collection of saliva is advantageous for being noninvasive, rapid and easy to perform by minimally trained personnel. Moreover, saliva’s content of many analytes derived from serum makes it a potentially powerful tool for screening, diagnosis and monitoring of systemic conditions, including CVD. This could be important when CVD emergencies arise in which oral samples could be collected and analyzed during patient transport to the hospital. Also in select CVD emergencies, patients may be unconscious dictating that the collection of oral fluid be performed by swabbing of the mouth. We studied patients who had HCM or CAD to help uncover which type of oral fluid would contain CVD biomarkers of interest. These patients underwent an invasive cardiac procedure that produced either extensive myocardial damage (i.e., ASA) or minimal to moderate damage (PCI) that provided a spectrum of CVD biomarker levels. In our studies, each of the oral fluids contained detectable levels of CVD-associated biomarkers; however, UWS displayed better characteristics than GS and LS. Specifically, concentrations were higher and the time effect displayed in serum was more similar with UWS than the other fluids.
A promising finding of this research was that the serum cardiac enzymes, representative of cardiac damage, displayed time effects in oral fluids. Here, TnI in UWS and LS, and CK-MB in LS demonstrated a time effect relationship similar to the changes observed in serum. Although there are no comparative studies performed in ablation or PCI patients, similar findings were reported by Mirzaii-Dizgah et al. who observed that salivary CK-MB reflected well with serum values in patients who had suffered an acute myocardial infarction.29 Although population and methodological differences are apparent between these two studies, both findings provide proof-of-principle that cardiac enzymes appear in oral fluids and can reflect ongoing cardiac damage.
Significant time-effects in serum were also observed in UWS, and to a lesser extent with GS, for adiponectin, CRP, sICAM-1, sCD40L. Promising results were also observed with TnI, IL-6 and TNFα in UWS. These findings indicate that CVD changes associated with atherosclerosis, inflammation and myocardial damage produce a diverse picture of biomarker concentrations, and monitoring of these processes using compartmentalized biological fluids (i.e., serum and oral fluids) could have benefit in the context of the clinical presentation for understanding the kinetics of infarction and post-infarct complications. Also, while our data suggest that UWS is a better fluid than GS and LS, these data should be considered preliminary and interpreted with caution. Several sensitivity issues still need to be addressed. For example, all samples were frozen and thawed prior to analysis, and the effects of freeze-thawing on concentrations of these biomolecules in oral fluids are not well known. Second, the time-effect analysis presented in this report lacks the sensitivity to detect individual time points that may be significantly different from baseline; thus we plan to explore this issue in future analyses. Third, a specific biomarker may demonstrate a sharp peak in concentration that occurs between the assessed time points, and the time-effect analyses performed would fail to address this possibility. Lastly, our study population was not healthy thus the utility of these fluids should be further analyzed in healthy controls and in non-cardiac patients for a more specific documentation of the value of these oral fluid analytes in monitoring CVD and/or cardiac events.
Conclusions
Our findings suggest that oral fluids contain CVD biomarkers that have the potential for identifying patients who have suffered myocardial ischemia/necrosis. The data support UWS as a fluid for CVD biomarker detection; however GS/LS could also yield important information regarding select biomarker levels. Additional studies are needed to help validate this panel for the assessment of CVD-related disorders.
Clinical Relevance.
Unstimulated whole saliva contains biomarkers reflective of myocardial and cardiovascular status.
Acknowledgments
The authors thank Dawn Dawson, study coordinator, Jason Stevens, research analyst, and Malini Bharadwaj, data management specialist, of the Center for Oral Health Research of the University of Kentucky for clinical, laboratory and data management support. This study was supported by grants from the National Institute of Health P20 RR020145, U01 DE017793 and M01-RR02602, the University of Kentucky General Clinical Research Core, and partially supported by the Clinical Translational Science Award: UL1RR033173.
Footnotes
Interim data regarding this study were presented on April 13, 2010, at the annual meeting of the American Academy of Oral Medicine, Santa Ana Pueblo, NM.
Conflict of interest: The authors report no conflicts of interest related to this study.
Publisher's Disclaimer: This is a PDF file of an unedited manuscript that has been accepted for publication. As a service to our customers we are providing this early version of the manuscript. The manuscript will undergo copyediting, typesetting, and review of the resulting proof before it is published in its final citable form. Please note that during the production process errors may be discovered which could affect the content, and all legal disclaimers that apply to the journal pertain.
References
- 1.Martin F, Devant J. Carcinoembryonic antigen in normal human saliva. J Natl Cancer Inst. 1973;50:1375–9. doi: 10.1093/jnci/50.5.1375. [DOI] [PubMed] [Google Scholar]
- 2.Kaufman E, Lamster IB. The diagnostic applications of saliva--a review. Crit Rev Oral Biol Med. 2002;13:197–212. doi: 10.1177/154411130201300209. [DOI] [PubMed] [Google Scholar]
- 3.Samaranayake L. Saliva as a diagnostic fluid. Int Dent J. 2007;57:295–9. doi: 10.1111/j.1875-595x.2007.tb00135.x. [DOI] [PubMed] [Google Scholar]
- 4.Streckfus CF, Bigler LR. Saliva as a diagnostic fluid. Oral Dis. 2002;8:69–76. doi: 10.1034/j.1601-0825.2002.1o834.x. [DOI] [PubMed] [Google Scholar]
- 5.Malamud D. Saliva as a diagnostic fluid. Dent Clin North Am. 2011;55:159–78. doi: 10.1016/j.cden.2010.08.004. [DOI] [PMC free article] [PubMed] [Google Scholar]
- 6.Zhang L, Xiao H, Wong DT. Salivary biomarkers for clinical applications. Mol Diagn Ther. 2009;13:245–59. doi: 10.1007/BF03256330. [DOI] [PubMed] [Google Scholar]
- 7.Yan W, Apweiler R, Balgley BM, Boontheung P, Bundy JL, Cargile BJ, et al. Systematic comparison of the human saliva and plasma proteomes. Proteomics Clin Appl. 2009;3:116–34. doi: 10.1002/prca.200800140. [DOI] [PMC free article] [PubMed] [Google Scholar]
- 8.Xiao H, Wong DT. Proteomics and its applications for biomarker discovery in human saliva. Bioinformation. 2011;5:294–6. doi: 10.6026/97320630005294. [DOI] [PMC free article] [PubMed] [Google Scholar]
- 9.Lee YH, Wong DT. Saliva: an emerging biofluid for early detection of diseases. Am J Dent. 2009;22:241–8. [PMC free article] [PubMed] [Google Scholar]
- 10.Zhang L, Xiao H, Karlan S, Zhou H, Gross J, Elashoff D, et al. Discovery and preclinical validation of salivary transcriptomic and proteomic biomarkers for the non-invasive detection of breast cancer. PLoS One. 2010;5:e15573. doi: 10.1371/journal.pone.0015573. [DOI] [PMC free article] [PubMed] [Google Scholar]
- 11.Hu S, Vissink A, Arellano M, Roozendaal C, Zhou H, Kallenberg CG, et al. Identification of autoantibody biomarkers for primary Sjogren’s syndrome using protein microarrays. Proteomics. 2011;11:1499–507. doi: 10.1002/pmic.201000206. [DOI] [PMC free article] [PubMed] [Google Scholar]
- 12.Bandhakavi S, Van Riper SK, Tawfik PN, Stone MD, Haddad T, Rhodus NL, et al. Hexapeptide libraries for enhanced protein PTM identification and relative abundance profiling in whole human saliva. J Proteome Res. 2011;10:1052–61. doi: 10.1021/pr100857t. [DOI] [PMC free article] [PubMed] [Google Scholar]
- 13.Bigler LR, Streckfus CF, Dubinsky WP. Salivary biomarkers for the detection of malignant tumors that are remote from the oral cavity. Clin Lab Med. 2009;29:71–85. doi: 10.1016/j.cll.2009.01.004. [DOI] [PubMed] [Google Scholar]
- 14.Yeh CK, Christodoulides NJ, Floriano PN, Miller CS, Ebersole JL, Weigum SE, et al. Current development of saliva/oral fluid-based diagnostics. Tex Dent J. 2010;127:651–61. [PMC free article] [PubMed] [Google Scholar]
- 15.Gustafsson A, Ajeti V, Ljunggren L. Detection of suPAR in the Saliva of Healthy Young Adults: Comparison with Plasma Levels. Biomark Insights. 2011;6:119–25. doi: 10.4137/BMI.S8326. [DOI] [PMC free article] [PubMed] [Google Scholar]
- 16.Musumeci V, Zappacosta B, Zuppi C, Bizzi G, Di Salvo S, Sacchi A, et al. Tissue plasminogen activator in saliva of hypertensives treated with angiotensin converting enzyme inhibitors or calcium antagonists. J Hypertens Suppl. 1993;11:S350–1. [PubMed] [Google Scholar]
- 17.Christodoulides N, Mohanty S, Miller CS, Langub MC, Floriano PN, Dharshan P, et al. Application of microchip assay system for the measurement of C-reactive protein in human saliva. Lab Chip. 2005;5:261–9. doi: 10.1039/b414194f. [DOI] [PubMed] [Google Scholar]
- 18.Mirzaii-Dizgah I, Jafari-Sabet M. Unstimulated whole saliva creatine phosphokinase in acute myocardial infarction. Oral Dis. 2011;17:597–600. doi: 10.1111/j.1601-0825.2011.01817.x. [DOI] [PubMed] [Google Scholar]
- 19.Dillon MC, Opris DC, Kopanczyk R, Lickliter J, Cornwell HN, Bridges EG, et al. Detection of homocysteine and C-reactive protein in the saliva of healthy adults: comparison with blood levels. Biomark Insights. 2010;5:57–61. doi: 10.4137/bmi.s5305. [DOI] [PMC free article] [PubMed] [Google Scholar]
- 20.Miller CS, Foley JD, Bailey AL, Campbell CL, Humphries RL, Christodoulides N, et al. Current developments in salivary diagnostics. Biomarkers in Medicine. 2010;4:1–18. doi: 10.2217/bmm.09.68. [DOI] [PMC free article] [PubMed] [Google Scholar]
- 21.Floriano PN, Christodoulides N, Miller CS, Ebersole JL, Spertus J, Rose BG, et al. Use of saliva-based nano-biochip tests for acute myocardial infarction at the point of care: A feasibility study. Clin Chem. 2009;55:1530–8. doi: 10.1373/clinchem.2008.117713. [DOI] [PMC free article] [PubMed] [Google Scholar]
- 22.Hage FG, Aqel R, Aljaroudi W, Heo J, Pothineni K, Hansalia S, et al. Correlation between serum cardiac markers and myocardial infarct size quantified by myocardial perfusion imaging in patients with hypertrophic cardiomyopathy after alcohol septal ablation. Am J Cardiol. 2010;105:261–6. doi: 10.1016/j.amjcard.2009.08.680. [DOI] [PubMed] [Google Scholar]
- 23.Madsen LH, Lund T, Grieg Z, Nygaard S, Holmvang L, Jurlander B, et al. Cardiac troponin I degradation in serum of patients with hypertrophic obstructive cardiomyopathy undergoing percutaneous septal ablation. Cardiology. 2009;114:167–73. doi: 10.1159/000226596. [DOI] [PubMed] [Google Scholar]
- 24.Bradham WS, Gunasinghe H, Holder JR, Multani M, Killip D, Anderson M, et al. Release of matrix metalloproteinases following alcohol septal ablation in hypertrophic obstructive cardiomyopathy. J Am Coll Cardiol. 2002;40:2165–73. doi: 10.1016/s0735-1097(02)02595-0. [DOI] [PubMed] [Google Scholar]
- 25.Sakamoto T, Mizuno Y, Ogawa H, Yoshimura M, Kugiyama K, Yasue H. B-type natriuretic peptide after percutaneous transluminal septal myocardial ablation. Int J Cardiol. 2002;83:151–8. doi: 10.1016/s0167-5273(02)00035-9. [DOI] [PubMed] [Google Scholar]
- 26.Navazesh M. Methods for collecting saliva. Ann N Y Acad Sci. 1993 Sep 20;694:72–7. doi: 10.1111/j.1749-6632.1993.tb18343.x. [DOI] [PubMed] [Google Scholar]
- 27.Baum BJ. Principles of saliva secretion. Ann N Y Acad Sci. 1993 Sep 20;694:17–23. doi: 10.1111/j.1749-6632.1993.tb18338.x. [DOI] [PubMed] [Google Scholar]
- 28.Lamster IB, Ahlo JK. Analysis of gingival crevicular fluid as applied to the diagnosis of oral and systemic diseases. Ann N Y Acad Sci. 2007;1098:216–29. doi: 10.1196/annals.1384.027. [DOI] [PubMed] [Google Scholar]
- 29.Mirzaii-Dizgah I, Hejazi SF, Riahi E, Salehi MM. Saliva-based creatine kinase MB measurement as a potential point-of-care testing for detection of myocardial infarction. Clin Oral Investig. 2011 Jun 18; doi: 10.1007/s00784-011-0578-z. epub ahead of print. [DOI] [PubMed] [Google Scholar]