INTRODUCTION
One-third to one-half of the deaths that occur due to acute pancreatitis (AP) during the first week after the onset of AP symptoms are primarily due to progressive organ failure (OF). Deaths that occur more than one week after admission to the hospital are often associated with local complications, such as infected pancreatic necrosis, and these patients often present symptoms of sepsis and multiple organ dysfunction syndromes (1). A recent meta-analysis indicated that organ failure is the key determinant of severity, regardless of the presence or absence of local pancreatic complications (2). Early identification of patients who are likely to develop organ failure would assist physicians in selecting the patients who would benefit from close surveillance or aggressive intervention. Many prognostic models or single predictors have been developed to predict mortality or the severity of acute pancreatitis, which is primarily defined based on the Atlanta classification (3-6). However, information regarding the early prediction of persistent organ failure in patients with acute pancreatitis is not widely available (7).
As one of the clinical prediction rules (8), an artificial neural network (ANN) is composed of a series of interconnecting parallel nonlinear processing elements (nodes) with limited numbers of inputs and outputs (9). A systematic review suggested that artificial neural network analysis is potentially more successful than conventional statistical techniques at predicting clinical outcomes when the relationship between the variables that determine the prognosis is complex, multidimensional and non-linear (10). The aim of this study was to develop an artificial neural network to predict persistent organ failure in patients with acute pancreatitis.
MATERIALS AND METHODS
A total of 312 patients with acute pancreatitis who were admitted to the First Affiliated Hospital of Wenzhou Medical College within 72 hours of the onset of symptoms between Jan 2008 and Mar 2009 were eligible. Acute pancreatitis was defined as previously described (11). Organ failure was defined as a Marshall score ≥2 for at least one of the following organs involved (12): (i) cardiovascular failure – systolic pressure ≤90 mmHg, unresponsive to fluids; (ii) respiratory failure – PaO2/Fio2 ratio <300 mmHg; or (iii) renal failure – creatinine >1.9 mg/dL. Duration of organ failure was defined as persistent if it exceeded 48 hours. Exclusion criteria included (3): prior surgery for pancreas, endoscopic retrograde cholangiopancreatography or trauma-induced pancreatitis, chronic pancreatitis, pancreatic cancer, pleural effusions preceding the development of acute pancreatitis, pleural effusions that resulted from concomitant diseases (e.g., pneumonia or chronic heart failure), chronic renal disease and cases with incomplete data.
Age, gender, temperature, pulse, systolic blood pressure, and biochemical parameters were recorded within 12 hours of admission before the development of persistent organ failure. The systemic inflammatory response syndrome (SIRS) and APACHE II scores (11) were calculated at admission according to the laboratory and physiological data.
Continuous values were expressed as the means ± SD or medians and interquartile ranges and compared using Student's t-test or the Mann-Whitney non-parametric test. Categorical values were described by counts and proportions and compared using the χ2 test. Variables that were significantly related to the presence of organ failure were selected as candidates for input into the final ANN model. Sensitivity analysis (also known as independent variable importance analysis) was performed to determine the optimum variables for construction of the final ANN model (9). For sensitivity analysis, an exploratory three-layer multiplayer perceptron (MLP) ANN model with a back propagation algorithm was constructed. In the exploratory ANN model, the data were randomly divided into a training sample (250 cases, 80%) and a test sample (62 cases, 20%). Sigmoid transfer functions were used in the hidden and output layers. Gradient descent was used to estimate the synaptic weights. The initial learning rate was 0.4, and the momentum was 0.9.
According to the results of the univariate and sensitivity analyses, a final three-layer feed-forward ANN model with a back propagation algorithm was constructed for all 312 patients. The ANN model was trained with a maximum of 500 iterations and 10 tours. The overfit penalty was assigned as 0.001, and the convergence criterion was 0.00001 (9). Five-fold cross-validation was used (13). The output of the ANN model was transformed to range from 0-1. Organ failure was predicted if the output was greater than or equal to 0.5 (9). The sensitivity, specificity, negative predictive value, positive predictive value and diagnostic accuracy of the ANN model are reported herein.
The clinical or patient-relevant utility of a diagnostic test is evaluated by a Fagan plot. The Fagan plot allows the reader to estimate the post-test probability of the target condition in an individual patient based on a selected pre-test probability (14).
Forward conditional step-wise logistic regression analysis was performed to develop a logistic regression function (LR) for comparison. The conditional probabilities for stepwise entry and removal of a factor were 0.05 and 0.06, respectively. The area under the receiver operating characteristic (ROC) curve (AUC) was used to evaluate the performance of the ANN model; LR model and APACHE II score (15).
Differences were considered statistically significant if the two-tailed P value was less than 0.05. SPSS 16.0 (SPSS Inc., Chicago, IL, USA) and JMP 6.0 (SAS, Cary, North Carolina, USA) were used for ANN analysis.
RESULTS
The median age of the 312 patients included in the study was 53, and 192 patients (61.5%) were male. The demographic and clinical characteristics of the patients are shown in Table 1. Among all of the patients, the acute pancreatitis was most commonly biliary in nature (56.4%). The median APACHE II score at the time of hospital admission was 5. Of the 48 patients who developed persistent organ failure, multiple organ failure was noted in 16 (33.3%). Respiratory failure (70.8%) was the most frequent. Five patients with organ failure died from acute pancreatitis, and four died during the first week in the hospital. None of the patients died from acute pancreatitis without organ failure.
Table 1.
Demographic and Clinical Characteristics of 312 patients with acute pancreatitis.
| Characteristic | Data |
| Age (yr) | 53 (42-65) |
| Male (%) | 61.5 |
| APACHE II score at admission | 5 (2-7) |
| Etiology, % | |
| Biliary | 56.4 |
| Alcohol | 32.1 |
| Other | 2.2 |
| Idiopathic | 9.3 |
| OF classification | |
| Single OF | 32 (66.7%) |
| Multiple OF | 16 (33.3%) |
| Organ affected by OF | |
| Cardiovascular | 8 (16.7%) |
| Respiratory | 34 (70.8%) |
| Renal | 22 (45.8%) |
Data are shown as numbers of observations, percentages, medians and interquartile ranges.
Univariate and multivariate analysis
Thirteen variables considered relevant to the presence of OF were tested using univariate and multivariate analyses. As shown in Table 2, univariate analysis suggested that age, SIRS, hematocrit, serum glucose, BUN and serum calcium were significantly associated with organ failure. Multivariate analysis by logistic regression identified the following three independent variables as predictive of persistent organ failure in acute pancreatitis: SIRS (p = 0.004), BUN (p<0.001) and serum calcium (p = 0.003). A logistic regression function (LR model) was developed to predict organ failure as follows: -0.38+0.12 BUN (mg/dl)-1.94 calcium (mmol/l)+1.16 SIRS (1 vs. 0).
Table 2.
Univariate analysis of predictive factors of organ failure in AP.
| Variable | OF (N = 48) | No-OF (N = 264) | p-value |
| Age (yr) | 63 (50.5-71.5) | 51 (41-63) | 0.001 * |
| Male (%) | 64.6 | 61.0 | 0.637▴ |
| SIRS (%) | 19.3 | 58.3 | <0.001▴ |
| Systolic blood pressure (mmHg) | 139 (120-150) | 130 (120-145) | 0.07 * |
| Hemoglobin (mg/dL) | 14.1 (12.3-16.2) | 13.4 (12.2-14.7 | 0.087* |
| Hematocrit (%) | 41 (34-47) | 38 (35-42) | 0.045* |
| Platelets (109/L) | 173 (108-233) | 190 (146-232) | 0.10* |
| Serum glucose (mmol/L) | 9.2 (6.7-13.3) | 7.4 (5.8-9.9) | 0.001* |
| BUN (mg/dl) | 23.9 (16.3-37.7) | 11.8 (8.4-15.4) | <0.001* |
| Serum calcium (mmol/L) | 1.92 (1.61-2.10) | 2.19 (2.0-2.3) | <0.001* |
OF: Organ failure; *Mann-Whitney non-parametric test; ▴χ2 test.
ANN analysis
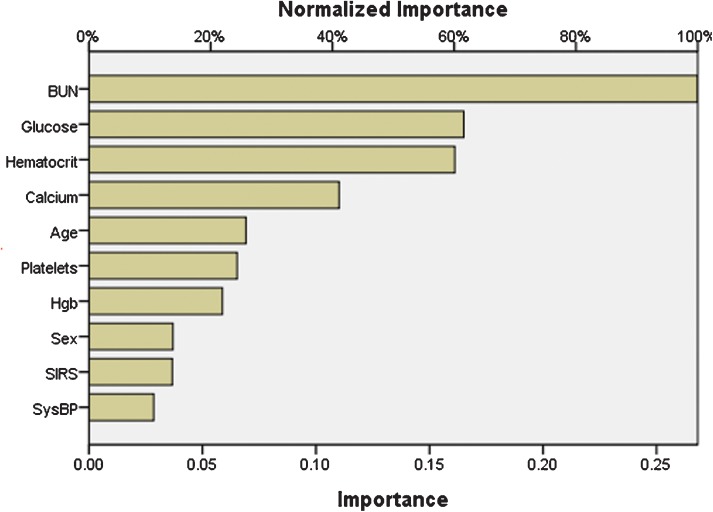
As shown in Figure 1, age, hematocrit, serum glucose, BUN and serum calcium were the most important predictors of persistent organ failure by sensitivity analysis (the exploratory ANN model constructed for the sensitivity analysis is not shown).
Figure 1.
Sensitivity analysis of the input variables. The value shown for each input variable is a measure of its relative importance.
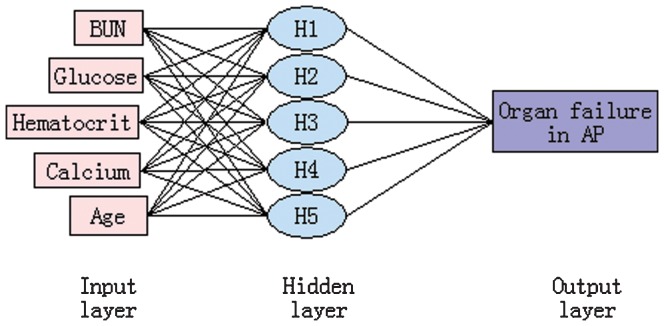
The final three-layer 5-5-1-feed-forward back propagation ANN model with variables consisting of age, hematocrit, serum glucose, BUN and serum calcium was developed and trained in 312 patients (Figure 2). The sensitivity, specificity, positive likelihood ratio, negative likelihood ratio and diagnostic accuracy of the ANN were 81.3%, 98.9%, 71.5, 0.19 and 96.2%, respectively.
Figure 2.
A neural network for the prediction of organ failure in patients with acute pancreatitis consisting of five input variables, a hidden layer with five nodes, and one output variable.
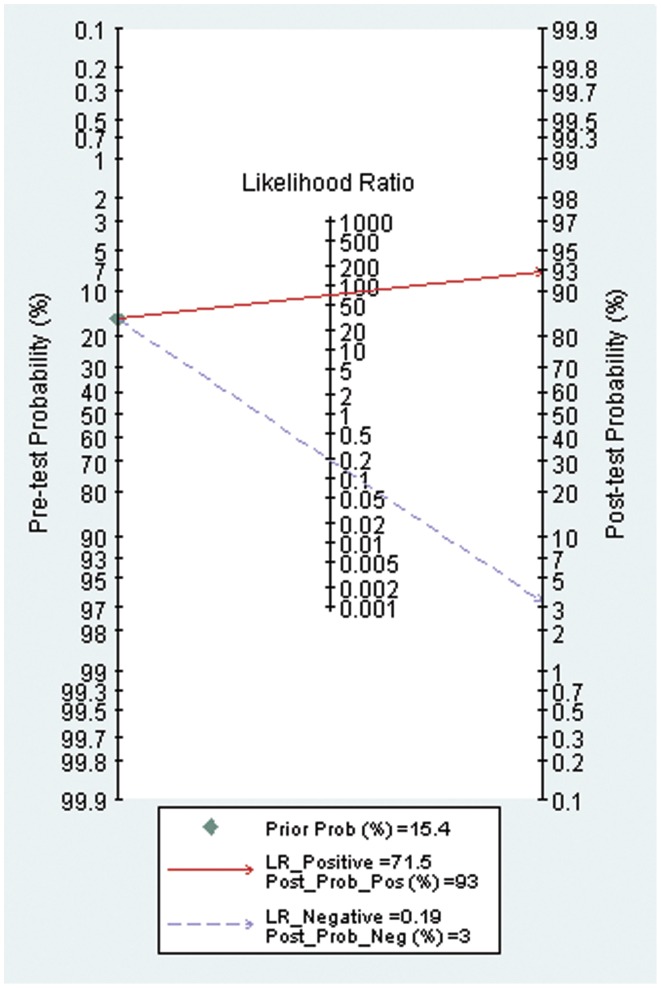
Using the prevalence of organ failure in acute pancreatitis (15.4% in this study) as the pretest probability, the Fagan plot (Figure 3) shows that ANN can be clinically informative because it increases the probability of being classified as organ failure to 93% when positive and lowers the probability to 3% when negative.
Figure 3.
Fagan plot.
Comparison of the ANN model, the LR model and APACHE II scores
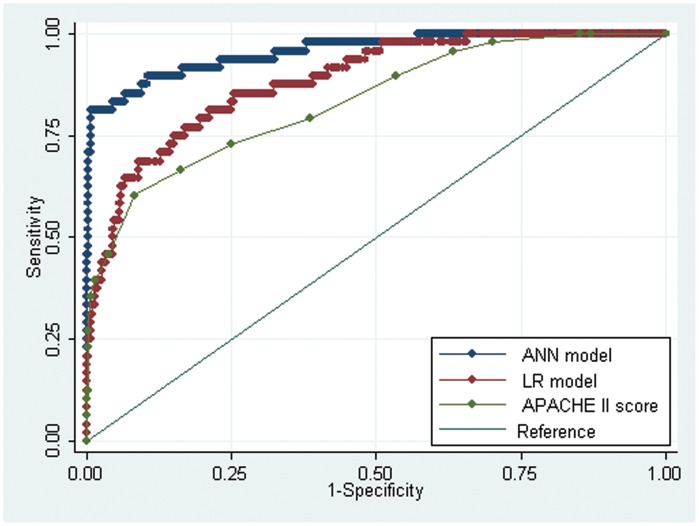
The ROC curves for the ANN model and APACHE II scores for predicting organ failure in acute pancreatitis are shown in Figure 4. The AUC of the ANN model (AUC = 0.96±0.02) was statistically higher than the AUC of the LR model (AUC = 0.88±0.03, p<0.001) or the APACHE II scores (AUC = 0.83±0.03, p<0.001).
Figure 4.
Receiver operating characteristic curves for the ANN model, logistic regression function (LR model) and APACHE II score.
DISCUSSION
The results of this study demonstrate the following: (i) an ANN model (Figure 2) with variables consisting of age, hematocrit, serum glucose, BUN and serum calcium achieved a sensitivity of 81.3% and a specificity of 98.9% and classified a total of 96.2% of patients correctly; (ii) as shown in the Fagan plot (Figure 3), if a patient's ANN value was more than or equal to 0.5, the probability of developing persistent OF increased from 15.4% to 93%, and if the ANN value was less than 0.5, the probability decreased to 3%; (iii) Based on ROC analysis (Figure 4), the diagnostic performance of the ANN model was superior to both the LR model and the APACHE II score.
Of the standard ANNs, the MLP is perhaps the most popular network architecture currently in use (16). An MLP model consists of an input layer, a hidden layer and an output layer. All of the artificial neurons are arranged in a layered feed–forward topology. Our ANN model was developed using the SPSS neural networks program and JMP software, which can both run the MLP model (9,13). ANNs are nonlinear statistical data modeling tools. They can take into account outliers and nonlinear interactions among variables and can reveal previously unrecognized and/or weak relationships between given input variables and an outcome (13). Therefore, ANNs often include parameters that may not reach significance using conventional statistics, as evidenced by the fact that age, hematocrit, and serum glucose included in our ANN model were not significant in logistic regression analysis. Similar phenomena were also observed in a previous study (17).
ANN models have been increasingly used in the clinical prediction of acute pancreatitis. Mofidi et al. (18) developed an ANN consisting of ten input values to predict severe acute pancreatitis that achieved a high sensitivity and specificity of 89% and 96%, respectively. However, several limitations to that study were noted by Andersson et al. (17), such as the lack of an ensemble approach and a priori variable selection. Andersson et al. 17 successfully constructed an ANN using six variables to predict severe acute pancreatitis. They enrolled 208 patients and reported that the performance of the ANN with an AUC of 0.92 was superior to a logistic regression model or APACHE II score. The limitations of the study by Andersson et al. 17 included a small sample size with missing data points and unclear time intervals between the onset of AP and data collection. In addition, aspartate aminotransferase, which was used as one of the variables in the ANN model, is not available in most emergency situations. These issues could limit the general applicability of the ANN described in the Andersson et al. study in different populations. The gold standard for severe acute pancreatitis used in both of the previously mentioned studies was based on the Atlanta classification, which has several limitations that have been highlighted in multiple publications. Revisions to the classification have been suggested (2,19), and two additional categories, including moderate and critical acute pancreatitis, have been introduced. Moderate acute pancreatitis is defined as patients with sterile pancreatic complications or transient OF (2,19). Patients with persistent OF should be classified as having severe or critical acute pancreatitis (2,19). A previous study also showed that persistent OF during the first week after the onset of AP symptoms was a marker of a fatal outcome in cases of acute pancreatitis (1). To the best of our knowledge, this is the first investigation of the possible predictors of persistent organ failure in cases of acute pancreatitis using ANN analysis.
Our study has several limitations. First, the data were collected retrospectively, which may introduce a population bias. Second, the data were all obtained from a tertiary care university hospital based on a 72-hour window of symptoms, which may not be applicable in a local clinic or community hospital setting. It will be necessary to analyze the performance of an ANN within a 48-hour window in future studies, which could generalize our results. Third, the sample size in this study was small. Finally, although we performed five-fold cross-validation and filtered out irrelevant input variables by univariate analysis and sensitivity analysis to avoid overfitting, testing the performance of the ANN model in an independent sample will be necessary in the future.
In conclusion, an artificial neural network model with variables consisting of age, hematocrit, serum glucose, BUN and serum calcium may be useful for predicting the development of persistent organ failure in patients with acute pancreatitis.
ACKNOWLEDGMENTS
This study was supported in part by the Wenzhou Municipal Science and Technology Bureau (No.Y20120014) and the Zhejiang Provincial Health Department (No. 2012ZB103). We are very thankful to the two anonymous reviewers for their thoughtful and precise input.
Footnotes
No potential conflict of interest wa sreported.
REFERENCES
- 1.Johnson CD, Abu-Hilal M. Persistent organ failure during the first week as a marker of fatal outcome in acute pancreatitis. Gut. 2004;53(9):1340–4. doi: 10.1136/gut.2004.039883. [DOI] [PMC free article] [PubMed] [Google Scholar]
- 2.Petrov MS, Shanbhag S, Chakraborty M, Phillips AR, Windsor JA. Organ failure and infection of pancreatic necrosis as determinants of mortality in patients with acute pancreatitis. Gastroenterology. 2010;139(3):813–20. doi: 10.1053/j.gastro.2010.06.010. [DOI] [PubMed] [Google Scholar]
- 3.Hong W, Dong L, Huang Q, Wu W, Wu J, Wang Y. Prediction of severe acute pancreatitis using classification and regression tree analysis. Dig Dis Sci. 2011;56(12):3664–71. doi: 10.1007/s10620-011-1849-x. [DOI] [PubMed] [Google Scholar]
- 4.Wu BU, Johannes RS, Sun X, Conwell DL, Banks PA. Early changes in blood urea nitrogen predict mortality in acute pancreatitis. Gastroenterology. 2009;137(1):129–35. doi: 10.1053/j.gastro.2009.03.056. [DOI] [PubMed] [Google Scholar]
- 5.Wu BU, Johannes RS, Sun X, Tabak Y, Conwell DL, Banks PA. The early prediction of mortality in acute pancreatitis: a large population-based study. Gut. 2008;57(12):1698–703. doi: 10.1136/gut.2008.152702. [DOI] [PubMed] [Google Scholar]
- 6.Heller SJ, Noordhoek E, Tenner SM, Ramagopal V, Abramowitz M, Hughes M, et al. Pleural effusion as a predictor of severity in acute pancreatitis. Pancreas. 1997;15(3):222–5. doi: 10.1097/00006676-199710000-00002. [DOI] [PubMed] [Google Scholar]
- 7.Mentula P, Kylanpaa ML, Kemppainen E, Jansson SE, Sarna S, Puolakkainen P, et al. Early prediction of organ failure by combined markers in patients with acute pancreatitis. Br J Surg. 2005;92(1):68–75. doi: 10.1002/bjs.4786. [DOI] [PubMed] [Google Scholar]
- 8.Simon TA, Stephen HL. Clinical prediction rules. BMJ. 2012;344:d8312. doi: 10.1136/bmj.d8312. [DOI] [PubMed] [Google Scholar]
- 9.Hong WD, Ji YF, Wang D, Chen TZ, Zhu QH. Use of artificial neural network to predict esophageal varices in patients with HBV related cirrhosis. Hepat Mon. 2011;11(7):544–7. [PMC free article] [PubMed] [Google Scholar]
- 10.Bartosch-Harlid A, Andersson B, Aho U, Nilsson J, Andersson R. Artificial neural networks in pancreatic disease. Br J Surg. 2008;95(7):817–26. doi: 10.1002/bjs.6239. [DOI] [PubMed] [Google Scholar]
- 11.Banks PA, Freeman ML. Practice guidelines in acute pancreatitis. Am J Gastroenterol. 2006;101(10):2379–400. doi: 10.1111/j.1572-0241.2006.00856.x. [DOI] [PubMed] [Google Scholar]
- 12.Singh VK, Wu BU, Bollen TL, Repas K, Maurer R, Mortele KJ, et al. Early systemic inflammatory response syndrome is associated with severe acute pancreatitis. Clin Gastroenterol Hepatol. 2009;7(11):1247–51. doi: 10.1016/j.cgh.2009.08.012. [DOI] [PubMed] [Google Scholar]
- 13.Sall J, Creighton L, Lehman A. Cary, N.C.: SAS Pub; 2007. JMP start statistics a guide to statistics and data analysis using JMP. Safari Tech Books Online. SAS Press series. 4th ed. [Google Scholar]
- 14.Whiting PF, Sterne JA, Westwood ME, Bachmann LM, Harbord R, Egger M, et al. Graphical presentation of diagnostic information. BMC Med Res Methodol. 2008;8:20. doi: 10.1186/1471-2288-8-20. [DOI] [PMC free article] [PubMed] [Google Scholar]
- 15.Hong W, Wu J, Chen X. Receiver operating characteristic curve and odds ratio should be used with caution. Hepat Mon. 2011;11(9):757. doi: 10.5812/kowsar.1735143X.735. [DOI] [PMC free article] [PubMed] [Google Scholar]
- 16.Saftoiu A, Vilmann P, Gorunescu F, Janssen J, Hocke M, Larsen M, et al. Efficacy of an artificial neural network-based approach to endoscopic ultrasound elastography in diagnosis of focal pancreatic masses. Clin Gastroenterol Hepatol. 2012;10(1):84–90.e1. doi: 10.1016/j.cgh.2011.09.014. [DOI] [PubMed] [Google Scholar]
- 17.Andersson B, Andersson R, Ohlsson M, Nilsson J. Prediction of severe acute pancreatitis at admission to hospital using artificial neural networks. Pancreatology. 2011;11(3):328–35. doi: 10.1159/000327903. [DOI] [PubMed] [Google Scholar]
- 18.Mofidi R, Duff MD, Madhavan KK, Garden OJ, Parks RW. Identification of severe acute pancreatitis using an artificial neural network. Surgery. 2007;141(1):59–66. doi: 10.1016/j.surg.2006.07.022. [DOI] [PubMed] [Google Scholar]
- 19.Petrov MS, Windsor JA. Classification of the severity of acute pancreatitis: how many categories make sense. Am J Gastroenterol. 2010;105(1):74–6. doi: 10.1038/ajg.2009.597. [DOI] [PubMed] [Google Scholar]


