Magnetic nanoparticles have been investigated for a broad range of clinical and diagnostic applications including immunoassays, targeted drug delivery, magnetic resonance imaging (MRI), and magnetic hyperthermia.[1–4] One of the earliest clinical applications of magnetic nanoparticles was the use of superparamagnetic iron oxide to enhance image contrast in MRI,[5–8] due to the ability of these nanoparticles to increase proton relaxation rates. Coating of superparamagnetic iron oxide nanoparticles (SPIONs) with dextran provides a non-toxic and non-immunogenic material that circulates effectively in the body, allowing enhanced imaging of liver, spleen and lymphatic tissues. These particles are used clinically to deliniate hepatic lesions in patients with cirrohis or hepatocellular carcinoma (HCC) and to identify lymph node metastases.[5, 9] The superparamagnetic materials are sequestered within Kupffer cells, whose function is to recycle iron from non-viable red blood cells. Malignant HCC tissues lack functional Kupffer cells, resulting in reduced uptake of the nanoparticles compared to healthy tissue. More recently, methods have been developed that allow SPIONs to aid in the detection of solid tumors.[9–15]
Imaging of early stage tumors provides a significant challenge—delivering sufficient quantities of superparamagnetic nanomaterials to generate detectable contrast is not readily achieved with smaller tumors. Simply increasing the size of the superparamagnetic nanoparticle can improve its magnetic response, but circulation time and biocompatibility are compromised. There is also a finite upper limit on nanoparticle size—at ~ 20 nm the properties of iron oxide transition from superparamagnetic to ferromagnetic.[16, 17] An alternate approach to increase magnetic saturation is to create clusters of smaller nanoparticles in such a way as to induce dipole – dipole coupling. This allows for the creation of superparamagnetic cores with substantial MRI signal enhancement, while avoiding agglomeration issues that plague larger ferromagnetic systems. Several nanosystems have been developed along these lines, including polymeric, micellar, and porous host materials.[18–22] Of particular interest to the present study is a recent report showing that the transition from superparamagnetism to ferromagnetism can be controlled by embedding SPIONs in a porous Si matrix.[23] The superparamagnetic particles align in the pseudo one-dimensional pore network of this material and interact via a dipolar coupling mechanism.[24–27] The extent of dipolar coupling between individual Fe3O4 nanoparticles can be controlled by adjusting the pore size of the host and the quantity of magnetic nanoparticles loaded.[23] In addition, a nanoparticle formulation of porous Si has been prepared with sufficient in vivo circulation time to localize (via the enhanced permeability and retention, or EPR, effect) in xenografted tumors in a mouse model.[28] Based on prior studies showing that iron oxide nanoparticles could be effectively loaded into micron-scale particles of porous Si, [22, 29, 30] we hypothesized that porous Si nanoparticles could be loaded with iron oxide nanoparticles, and that the composite material would provide enhanced transverse proton relaxation in MRI images while minimizing cytotoxicity and long-term tissue damage. In this report, we prepared a porous Si nanoparticle with a pore morphology that facilitates the proximal loading and alignment of Fe3O4 nanoparticles. We characterized the composite materials using SQUID magnetometry, dynamic light scattering (DLS), transmission electron microscopy (TEM), and MRI. The in vitro cytotoxicity of the composite materials was tested using cell viability assays on human liver cancer cells and rat hepatocytes. An in vivo analysis using a hepatocellular carcinoma (HCC) Sprague Dawley rat model was then used to determine the biodistribution properties of the material, while naïve Sprague Dawley rats were used to determine the pharmocokinetic properties of the nanomaterials. The composite material reported here demonstrates an injectable nanomaterial that exploits the dipolar coupling of superparamagnetic nanoparticles trapped within a secondary inorganic matrix to yield significantly enhanced MRI contrast.
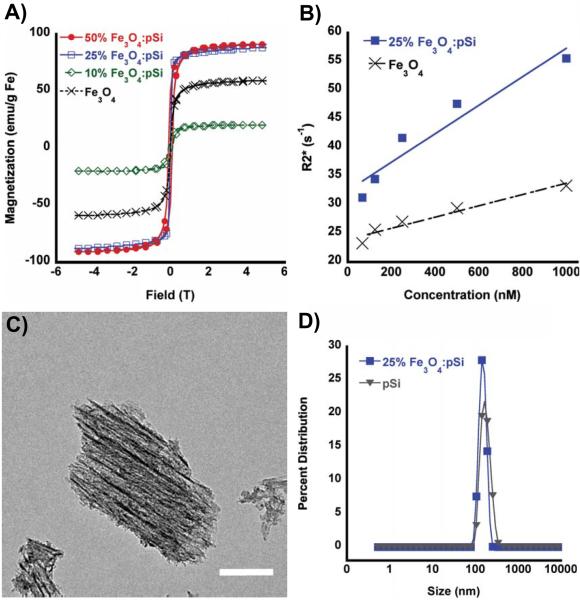
Porous Si nanoparticles were generated by electrochemical etching of crystalline Si in an ethanolic HF electrolyte, removal of the porous layer from the substrate, and then fracture of the porous layer in ethanol with ultrasound. The resulting colloidal dispersion was filtered through a 0.22 μm membrane to yield irregularly shaped nanoparticles in a size range of 180 – 220 nm (by dynamic light scattering and scanning electron microscopy, Figure 1), with pore diameters of ~16 nm (BJH method, Supporting Figure S1) and porosity of 86%. The freshly etched (Si-H-terminated) porous Si nanoparticles were then loaded with oleic acid-coated 9 nm Fe3O4 (Supporting Figure S1) nanoparticles to form the Fe3O4:pSi nanocomposites. Mild air-oxidation of the nanocomposites (180 °C, 4 h) generated a SiO2 surface layer that served to stabilize the composite and lock the Fe3O4 nanoparticles in the matrix. The oxidized particles were then modified with poly(ethylene) glycol – silane to provide solubility and biocompatibility. The porosity of the Fe3O4:pSi composites decreased to 34% in a formulation containing a 25% mass loading of iron oxide (nitrogen adsorption measurement). For comparison, a micellar formulation consisting of a 2 kDa PEG micelle with a nominal diameter comparable to the pSi formulations (200 nm) and encapsulating a comparable quantity of Fe3O4 nanoparticles (synthesized by the same method) was prepared.
Figure 1.
(A) SQUID hysteresis curves obtained at 298 K, for: 50% (by mass) Fe3O4-loaded porous Si nanoparticles (solid red circles), 25% Fe3O4-loaded porous Si nanoparticles (open blue squares), 10% Fe3O4-loaded porous Si nanoparticles (open green diamonds), and free Fe3O4 encapsulated within a PEG micelle nanoparticles (black x). (B) MRI phantom experiments showing the weighted transverse relaxation time (R2*) versus Fe concentration (nanomoles Fe per liter ultrapure water) for 25% (by mass Fe) Fe3O4-loaded porous Si nanoparticles (closed squares) and Fe3O4–containing PEG micelles (black x). (C) TEM image (scale bar = 50 nm) of a representative porous Si nanoparticle containing Fe3O4 nanoparticles embedded along the straight pores within the matrix. Fe content verified by EDS (Supporting Figure S1) and powder XRD (Supporting Figure S2). (D) Hydrodynamic size distribution, determined by DLS, of porous Si nanoparticles (triangles) and porous Si nanoparticles loaded (25% by mass) with Fe3O4 nanoparticles (closed squares). Both particle types contain 5k methoxy-terminated PEG, attached to the oxidized porous Si surface via silane coupling chemistry.
The magnetic and MR characteristics of the composites were examined as a function of mass loading of magnetic nanoparticles. At low levels of Fe3O4 (10% m/m) the room-temperature saturation magnetization of the composite decreased relative to the “free” Fe3O4 powder (Figure 1a). Consistent with results of previous work,36 the low saturation magnetization is attributed to a large spatial separation between the Fe3O4 particles, similar to a spin glass system. The composites display substantial increases in saturation magnetization as the loading of Fe3O4 increases. The observed saturation and coercivity increases are attributed to one-dimensional alignment of the magnetic particles within the porous nanostructure, as seen in the TEM images (Figure 1c).[23] The SQUID data are indicative of long-range magnetic ordering. For Fe3O4:pSi mass ratios > 25% the saturation magnetization values approach that of bulk Fe3O4 (magnetite). At Fe3O4:pSi mass ratios > 50% the magnetic data deviate from superparamagnetic behavior, and the composite is weakly ferromagnetic.
The MR properties of the composite materials were quantified by phantom imaging of solutions containing different nanoparticle concentrations, based on total iron content (Figure 1b). The weighted transverse relaxivity (R2*) value for the Fe3O4 nanoparticle micelles was measured as 333 mM Fe−1 s−1. By contrast, a composite material comprised of a Fe3O4:pSi mass ratio = 25% Fe3O4 nanoparticles had a T2* value of 556 mM Fe−1 s−1. The increase in the transverse relaxivity is attributed to the greater magnetic strength of the interacting Fe3O4 nanoparticles within the pSi matrix.
The cytotoxicity of the nanocomposites was assessed using healthy rat hepatocytes and HepG2 human liver cancer cells (Figure 2). The cytotoxicity of the composite materials loaded with 25% Fe3O4 was found to be minimal when exposed to either cell line for up to 24 h. Although in vitro data are often poor predictors of in vivo behavior, the data suggest that the liver, or cancerous regions of the liver, would not experience any localized toxicity from particle exposure. At concentrations larger than would be utilized in a systemic administration (up to 2 mg/mL of the Fe3O4:pSi mass ratio = 25% formulation) there was no statistically significant loss in cell viability experienced by either cell type after 24 h. As controls for the cytotoxicity experiments, the toxicity of each component of the composite was tested: poly(ethylene) glycol-coated pSi host (without Fe3O4 nanoparticles) and 200 nm-diameter poly(ethylene glycol) micellar formulations of Fe3O4 nanoparticles (containing 9 nm-diameter Fe3O4 cores). No statistically significant loss in cell viability was observed with either cell type after 24 h.
Figure 2.
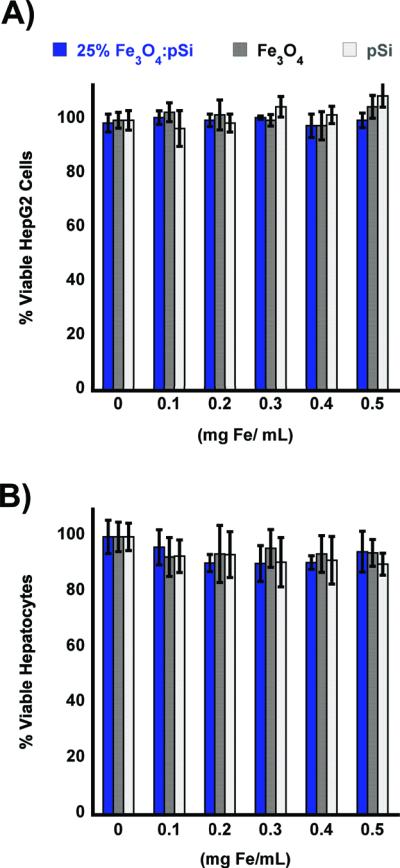
In vitro cell viability assays of composite Fe3O4:pSi nanoparticles and their components. Composite nanoparticles (Fe3O4:pSi mass ratio = 25%), nanoparticles encapsulated in 2 kDa poly(ethylene) glycol micelles, and empty poly(ethylene) glycol-coated Si nanoparticles are compared. Formulations were incubated with either HepG2 (A) or rat hepatocytes (B) for 24 h, and the percentage of viable cells was determined using a calcein AM/ethidium homodimer-1 live/dead assay. No appreciable cell death is observed for eitherthe composite or the constituent formulations.
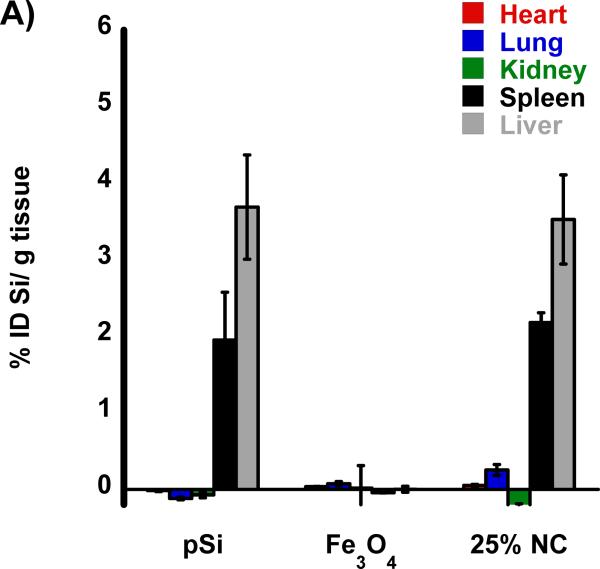
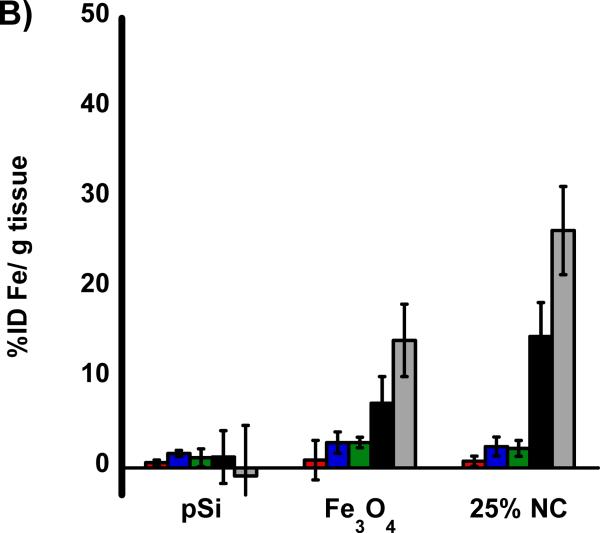
The biodistribution of the nanomaterials were quantified with tissue uptake studies 24 h post-injection (Figure 3 a,b) into HCC tumor burdened rats. The harvested tissues were acid digested, filtered, diluted in a 2% nitric acid solution and subjected to ICP-OES analysis. Both Si and Fe were measured for all samples and normalized to control, non-injected, animals. Relative to iron, the silicon content in the nanocomposite-injected samples was considerably less than expected, indicative of degradation of the oxidized pSi nanoparticle carriers and subsequent renal clearance. Small quantities of silicon were detected in the liver and spleen that are attributed to intact pSi nanoparticles that had been sequestered by the mononuclear phagocyte system (MPS) and not yet broken down. In the heart, lungs, and kidneys the concentration of Si is no different then what is seen in control non-injected rats. The concentration of iron measured in the animals injected with the nanocomposite is also consistent with the largest degree of particle uptake occurring in the liver and spleen. The quantity of Fe found in the livers of rats injected with composite nanoparticles (Fe3O4:pSi mass ratio = 25%) was ~ 26 % ID/g which is larger than the amount that accumulated in livers of rats injected with Fe3O4 micelles which was ~ 14 % ID/g (p = 0.02). This is attributed to slower degradation of the composite material relative to the more fragile micellar formulation. Presumably the micelles degrade prior to MPS uptake, and Fe3O4 nanoparticles are removed through renal clearance.
Figure 3.
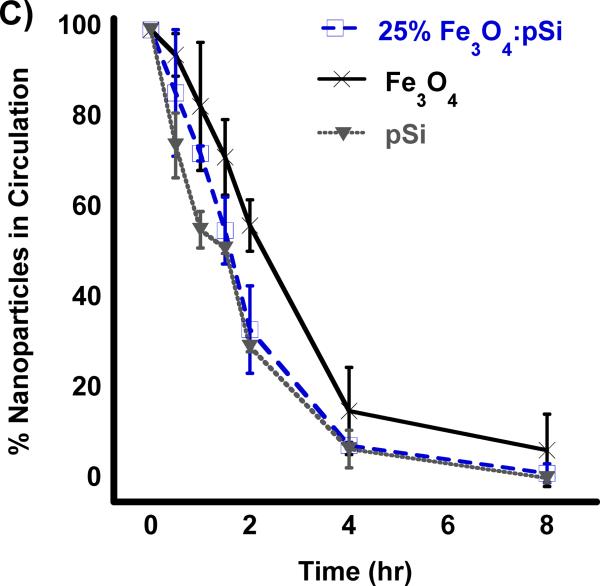
Biodistribution of nanoparticles quantified 24 h post-injection into HCC tumor burdened Sprague Dawley rats. Results of ICP-OES analysis for (A) Si and (B) Fe on the indicated organs. Formulations “pSi,” “Fe3O4” and “25% NC” correspond to empty poly(ethylene) glycol-coated Si nanoparticles, Fe3O4 nanoparticles encapsulated in 2 kDa poly(ethylene) glycol micelles, and composite nanoparticles (Fe3O4:pSi mass ratio = 25%), respectively. The in vivo residence time of the three formulations, obtained from blood samples using fluorescently labeled (Cy-7) nanoparticles, is quantified in (C). The half-life of the nanocomposite particles was 96 min.
The pharmacokinetic properties and the blood half-life of the composite formulation (Fe3O4:pSi mass ratio = 25%) in a healthy rat are quantified in Figure 3. A near-IR fluorophore (NHS-Cy7) was conjugated to the amino-terminated, PEG-silane-coated composite nanoparticle. Particles were injected into cannulated rats via the jugular vein and blood was collected at several time points. The blood half-life of the materials (Figure 3c) was calculated using a one-component pharmacokinetic model from the near-IR fluorescent label and verified using inductively coupled plasma–optical emmision spectroscopy (ICP-OES) to quantify the concentrations of iron and silicon in the bloodstream. The pSi composite and empty pSi particles displayed circulation half-lives of 1.6 and 1.5 h, respectively while the half-life of the ~ 200 nm Fe3O4 PEG micelles was 2.1 h.
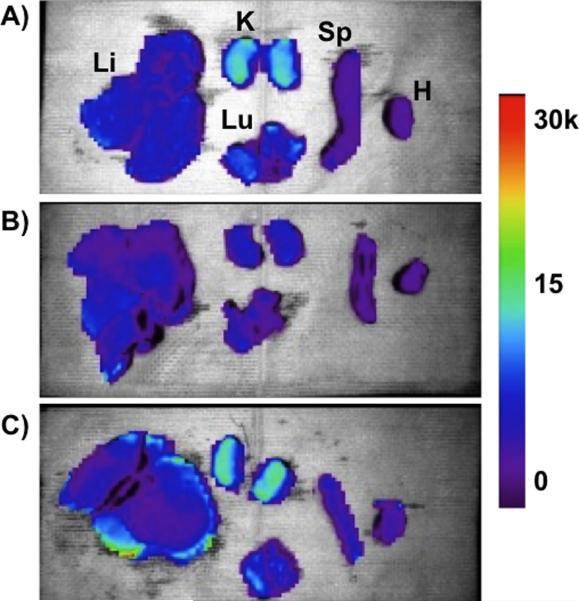
Biodistribution of the nanoparticle formulations in hepatocellular carcinoma (HCC)-burdened rats were performed by ex vivo fluorescence imaging of organs harvested 4 h post-injection (Figure 4). For these experiments, all three formulations (empty pSi, Fe3O4 micelles, and Fe3O4:pSi composites) were covalently labeleled with the fluorescent dye Cy7, conjugated to the PEG coating. The fluorescence images of the kidneys show clear evidence of renal clearance for the empty pSi and Fe3O4:pSi composite formulations (Figure 4a and 4c). This is attributed to disintegration of the 200-nm diameter pSi particles to smaller (< 5.5 nm) fragments that were then passed into the urine. The fluorescence images of the Fe3O4:pSi composite formulation show that the greatest fluorescence intensity occurs in the liver, followed by the kidneys, lungs, and spleen. In either rat injected with empty pSi or with Fe3O4:pSi composite, detectable quantities of fluorophore enter the lung tissues while this does not occur in the Fe3O4 micelle-injected rats. No excess (relative to natural background) of Si or Fe was detected in the lungs of the rats at this time point by ICP-OES, indicating that the Cy7 conjugate was released from the particle surface during degradation and penetrated the lung tissues. The strongest fluorescence intensity for the composite material occurred on the surface of the liver tissues. From histological and gross pathological studies the majority of the tumor nodules occur on the surface, rather than within, the liver (Supporting Figure S3 and S4). The fluorescence data are consistent with the biodistribution data of Figure 3; a somewhat larger quantity of Fe3O4:pSi composite nanoparticle accumulated in the liver compared to Fe3O4 micelles.
Figure 4.
Ex vivo fluorescence images showing the distribution of (A) empty poly(ethylene) glycol-coated Si nanoparticles, (B) Fe3O4 nanoparticles encapsulated in 2K poly(ethylene) glycol micelles, and (C) composite nanoparticles (Fe3O4:pSi mass ratio = 25%) in the indicated organs (Li = liver, K = kidneys, Lu = lungs, Sp = spleen, and H = heart). All formulations contained a near-IR fluorophore (Cy7) covalently bound to the nanoparticle surface. The images were obtained 4 hours post-injection (tail vein) into Sprague Dawley rats burdened with hepatocellular carcinoma (HCC). Color scale corresponds to relative fluorescence intensity in the 780 nm channel (750 nm excitation).
All three formulations possessed a PEG coating to increase biocompatibility, the same physical dimensions (200 nm diameter), and the same quantity of Fe3O4 nanoparticles (for the two formulations that contained iron); the difference in circulation time of the pSi nanoparticle formulations relative to the Fe3O4–containing micellar formulation is attributed to post-injection degradation of the pSi nanoparticle host. Previous work with dextran-coated pSi nanoparticles found those particles also were broken down rapidly in vivo (a few hours); within one month all traces of the material had been excreted with no negative health effects noted in the animals.[28] In the present study, we conducted longer term (3 month) experiments on all three formulations. Healthy rats were injected with 2 mg/kg doses of a given nanomaterial via the tail vein and they were monitored for mass and general activity. Following the 3-month period, the rats were sacrificed and their liver and spleen were harvested for histological analysis. No obvious negative effects were observed in the behavior of the live rats, and no abnormal histology was observed.
The anisotropic pore morphology in porous Si nanoparticles provides a host matrix that provides control over the clustering of iron oxide nanoparticle guests, yielding increased magnetization of the resulting composite relative to micelles containing a comparable quantity of iron and of comparable dimensions (200 nm diameter). A Fe3O4:pSi composite formulation consisting of 25% by mass Fe3O4 yields an maximal T2* value of 556 mM Fe−1 s−1. No cellular (HepG2 or rat hepatocyte cells) or in vivo (rat) toxicity was observed with the formulation, which degrades and is eliminated after 4–8 h in vivo. The ability to tailor the magnetic properties of such materials may be useful for in vivo imaging, magnetic hyperthermia, or drug delivery applications.
Experimental
Preparation of Porous Silicon Nanoparticles and Nanocomposites
Porous Si (pSi) films were created by electrochemical etching of a (100) oriented, boron-doped p++ type single-crystal silicon wafer with resistivity of 0.8–0.1 mΩ cm (Siltronix, FR) in an electrolyte consisting of 3:1 (v:v) aqueous HF:ethanol (48%)(Fisher, USA) using a constant current density of 400 mA/cm2 (150 s) (SEM images in Supporting Figure S1). The pSi film was removed from the silicon substrate by application of a current density (4 mA/cm2, 250 s) in a 3.3% (by volume) aqueous HF (48 %) solution in ethanol. Nanoparticles were generated by sonicating the freestanding pSi film in a sealed vial of ethanol (~ 10 mg/mL) for 16 h at room temperature. The solution was then centrifuged at 14,000 RPM and the pellet was resuspended in ethanol to create a 10 mg/mL solution. The resuspended solution was then filtered through a 0.22 μm PVDF syringe filter (Millipore, USA). A solution (1 mL) of oleic acid-coated Fe3O4 particles (2 mg/mL) in choloroform (Fisher, USA),[31] were added to the pSi suspension (2 mg/mL) in chloroform and the solution was gently agitated for 12 h. The Fe3O4 nanoparticles were loaded into the pSi nanoparticles at mass ratios of 1:2, 1:3 and 1:10 (Fe3O4:pSi). After removing the suspension from agitation the chloroform was evaporated and the film was redispersed in ethanol and purified by successive centrifugation three times at 14,000 RPM for 30 min. The product was collected as a pellet and then thermally oxidized at 180 °C for 4 h. The Fe3O4:pSi nanocomposite particles were then coated with methoxyPEG-silane (MW=5,000, Laysan Bio, USA) chloroform solution (10 mM) that was agitated on a vortex at RT overnight. The solution was purified by centrifugal filtration against a 100 kDa MW (Millipore Amicon Ultra-4, Billerica, MA) filter for 30 min at 6,000 RPM. NHS-conjugated Cy7 fluorophore (GE Healthcare, USA) was attached to the particles via incorporation of 10% NH2-PEG-silane (MW = 5,000 Nanocs, PEG6-0012, US) into the polymer coating. The fluorophore-conjugated probes were reacted with the composites for 4 h under agitation in PBS (pH = 7.4, Invitrogen, CA, USA). The purification was repeated until no fluorescent signal was observed in the filtrate, typically 3–5 times. The fluorophore-labeled composite materials were then either resuspended in PBS or stored dry for future use. Control experiments using Fe3O4 nanoparticle micelles were prepared following previously reported methods.[32]
Materials Characterization
Nitrogen adsorption isotherms (interpreted with the Barret – Joyner – Halenda, or BJH model)[33] were measured on a Accelerated Surface Area and Porosimetry analyzer (ASAP 2020) (Micromeritics, GA, USA). Pore volume, pore size and surface area of the pSi nanoparticles were measured using N2 adsorption isotherms. Magnetic measurements were obtained from powders using a superconducting quantum interference device (SQUID) magnetometer (Quantum Design, San Diego, CA) at 298 K, over a magnetic field range of −5 T to +5T. The hysteresis curves were normalized to the mass of Fe determined by elemental analysis (ICP-OES) of the powders. UV-VIS and fluorescence spectra (Molecular Devices, CA USA) were used to determine the conjugation of fluorophore labels. ICP-OES (Optima 3700DV, Perkin-Elmer, USA) was used to determine the elemental composition and concentrations of the materials. Transmission Electron Microscopy (TEM) images were collected using an FEI (OR, USA) Sphera TEM equipped with a LaB6 filament operating with an accelerating voltage of 80 kV. Scanning Electron Microscopy (SEM) images were obtained using a Philips (ND) XL39 Field Emission ESEM, and EDS spectra were obtained with an Oxford Instruments EDS attachment.
In Vitro Analysis
Cytotoxicity experiments using rat hepatocytes (Cellz Direct, USA) and HepG2 (ATCC, USA) cells were performed using Calcein AM (fluorogenic intracellular esterase Calcein acetoxymethylester) and ethidium homodimer-1 live/dead assays (Invitrogen, CA, USA) in 96-well plates. The assay was analyzed using a fluorescence plate reader with excitation at 485 nm and emission at 530 nm (calcein AM) or excitation of 530 nm and emission of 620 nm (ethidium homodimer-1).
Animal Hepatocellular Carcinoma (HCC) model
All animal work was performed in accordance with the institutional animal protocol guidelines in place at the University of California, San Diego and reviewed and approved by the University's animal research committee. Sprague Dawley rats were purchased from Charles River Laboratories (MA, USA). Diethynitrosamine (n-DEN, Sigma Aldrich, MO, USA) was administered at 50 ppm for a period of 8 weeks via drinking water to induce liver cancer. The animals were then transitioned to normal drinking water for a period of ~ 4 weeks. The animals were euthanized once they exhibited weight loss of greater then 100 g (Supporting Figure S4).
MRI experiments
T2* images were acquired via gradient recalled echo imaging with TR = 2000 s and TE = 7, 15, 20, 40 and 60 s in a clinical 3T MRI (GE Healthcare, WI, US) using a wrist coil. T2* values were calculated using an exponential fit (MATLAB, MathWorks, MA, USA).
Supplementary Material
Acknowledgements
This work was supported by the National Cancer Institute of the National Institutes of Health through grant numbers U54 CA 119335 (UCSD CCNE) and 5-R01-CA124427 (Bioengineering Research Partnership). M.J.S. and E.R. are members of the Moores UCSD Cancer Center and the UCSD NanoTUMOR Center under which this work was conducted and partially supported. J.M.K. acknowledges support from the American Cancer Society in the form of a postdoctoral fellowship. The authors also acknowledge Dr. David Brenner for assistance with the animal model. We acknowledge use of the UCSD Cryo-Electron Microscopy Facility, which is supported in part by NIH grant 1S10 RR020016, a gift from the Agouron Institute, and UCSD funds provided to Prof. Timothy S. Baker. Supporting Information is available online from Wiley InterScience or from the author.
References
- [1].Chemla YR, Grossman HL, Poon Y, McDermott R, Stevens R, Alper MD, Clarke J. Proceedings of the National Academy of Sciences of the United States of America. 2000;97:14268. doi: 10.1073/pnas.97.26.14268. [DOI] [PMC free article] [PubMed] [Google Scholar]
- [2].Dobson J. Drug development research. 2006;67:55. [Google Scholar]
- [3].Pankhurst QA, Connolly J, Jones SK, Dobson J. Journal of Physics D: Applied Physics. 2003;36:R167. [Google Scholar]
- [4].Berry CC, Curtis ASG. Journal of Physics D: Applied Physics. 2003;36:R198. [Google Scholar]
- [5].Dias MHM, Lauterbur PC. Magnetic resonance in medicine. 1986;3:328. doi: 10.1002/mrm.1910030218. [DOI] [PubMed] [Google Scholar]
- [6].Saini S, Stark DD, Hahn PF, Wittenberg J, Brady TJ, Ferrucci JT. Radiology. 1987;162:211. doi: 10.1148/radiology.162.1.3786765. [DOI] [PubMed] [Google Scholar]
- [7].Stark DD, Weissleder R, Elizondo G, Hahn PF, Saini S, Todd LE, Wittenberg J, Ferrucci JT. Radiology. 1988;168:297. doi: 10.1148/radiology.168.2.3393649. [DOI] [PubMed] [Google Scholar]
- [8].Weissleder R, Hahn PF, Stark DD, Elizondo G, Saini S, Todd LE, Wittenberg J, Ferrucci JT. Radiology. 1988;169:399. doi: 10.1148/radiology.169.2.3174987. [DOI] [PubMed] [Google Scholar]
- [9].Enochs WS, Harsh G, Hochberg F, Weissleder R. Journal of Magnetic Resonance Imaging. 1999;9:228. doi: 10.1002/(sici)1522-2586(199902)9:2<228::aid-jmri12>3.0.co;2-k. [DOI] [PubMed] [Google Scholar]
- [10].Moore A, Marecos E, Bogdanov A, Weissleder R. Radiology. 2000;214:568. doi: 10.1148/radiology.214.2.r00fe19568. [DOI] [PubMed] [Google Scholar]
- [11].Huh YM, Jun Y, Song HT, Kim S, Choi J, Lee JH, Yoon S, Kim KS, Shin JS, Suh JS. J. Am. Chem. Soc. 2005;127:12387. doi: 10.1021/ja052337c. [DOI] [PubMed] [Google Scholar]
- [12].Simberg D, Duza T, Park JH, Essler M, Pilch J, Zhang L, Derfus AM, Yang M, Hoffman RM, Bhatia S. Proceedings of the National Academy of Sciences. 2007;104:932. doi: 10.1073/pnas.0610298104. [DOI] [PMC free article] [PubMed] [Google Scholar]
- [13].Zhang C, Jugold M, Woenne EC, Lammers T, Morgenstern B, Mueller MM, Zentgraf H, Bock M, Eisenhut M, Semmler W. Cancer research. 2007;67:1555. doi: 10.1158/0008-5472.CAN-06-1668. [DOI] [PubMed] [Google Scholar]
- [14].Lee Y, Lee H, Kim YB, Kim J, Hyeon T, Park HW, Messersmith PB, Park TG. Advanced Materials. 2008;20:4154. doi: 10.1002/adma.200800756. [DOI] [PMC free article] [PubMed] [Google Scholar]
- [15].Park JH, von Maltzahn G, Zhang L, Schwartz MP, Ruoslahti E, Bhatia SN, Sailor MJ. Advanced Materials. 2008;20:1630. doi: 10.1002/adma.200800004. [DOI] [PMC free article] [PubMed] [Google Scholar]
- [16].Jun YW, Huh YM, Choi JS, Lee JH, Song HT, Kim S, Yoon S, Kim KS, Shin JS, Suh JS, Cheon J. Journal of the American Chemical Society. 2005;127:5732. doi: 10.1021/ja0422155. [DOI] [PubMed] [Google Scholar]
- [17].Sjogren CE, Johansson C, Naevestad A, Sontum PC, Briley-Saeb K, Fahlvik AK. Magnetic resonance imaging. 1997;15:55. doi: 10.1016/s0730-725x(96)00335-9. [DOI] [PubMed] [Google Scholar]
- [18].Rebolledo AF, Laurent S, Calero M, Villanueva A, Knobel M, Marco JF, Tartaj P. ACS nano. 2010;4:2095. doi: 10.1021/nn9013388. [DOI] [PubMed] [Google Scholar]
- [19].Ai H, Flask C, Weinberg B, Shuai X, Pagel MD, Farrell D, Duerk J, Gao JM. Advanced Materials. 2005;17:1949. [Google Scholar]
- [20].Guthi JS, Yang SG, Huang G, Li S, Khemtong C, Kessinger CW, Peyton M, Minna JD, Brown KC, Gao J. Molecular pharmaceutics. 2009;7:32. doi: 10.1021/mp9001393. [DOI] [PMC free article] [PubMed] [Google Scholar]
- [21].Lee J, Yang J, Ko H, Oh S, Kang J, Son J, Lee K, Lee SW, Yoon HG, Suh JS, Huh YM, Haam S. Advanced Functional Materials. 2008;18:258. [Google Scholar]
- [22].Serda RE, Ferrati S, Godin B, Tasciotti E, Liu XW, Ferrari M. Nanoscale. 2009;1:250. doi: 10.1039/b9nr00138g. [DOI] [PMC free article] [PubMed] [Google Scholar]
- [23].Granitzer P, Rumpf K, Roca AG, Morales MP, Poelt P, Albu M. Journal of Magnetism and Magnetic Materials. 2009;322:1343. [Google Scholar]
- [24].Gross AF, Diehl MR, Beverly KC, Richman EK, Tolbert SH. J. Phys. Chem. B. 2003;107:5475. [Google Scholar]
- [25].Frankamp BL, Boal AK, Tuominen MT, Rotello VM. J. Am. Chem. Soc. 2005;127:9731. doi: 10.1021/ja051351m. [DOI] [PubMed] [Google Scholar]
- [26].Song Q, Zhang ZJ. J. Phys. Chem. B. 2006;110:11205. doi: 10.1021/jp060577o. [DOI] [PubMed] [Google Scholar]
- [27].Jun Y, Seo J, Cheon J. Acc. Chem. Res. 2008;41:179. doi: 10.1021/ar700121f. [DOI] [PubMed] [Google Scholar]
- [28].Park JH, Gu L, von Maltzahn G, Ruoslahti E, Bhatia SN, Sailor MJ. Nature Materials. 2009;8:331. doi: 10.1038/nmat2398. [DOI] [PMC free article] [PubMed] [Google Scholar]
- [29].Sciacca B, Alvarez SD, Geobaldo F, Sailor MJ. Dalton Trans. 2010;39:10847. doi: 10.1039/c0dt00936a. [DOI] [PMC free article] [PubMed] [Google Scholar]
- [30].Thomas JC, Pacholski C, Sailor MJ. Lab Chip. 2006;6:782. doi: 10.1039/b516121e. [DOI] [PubMed] [Google Scholar]
- [31].Park J, An K, Hwang Y, Park JG, Noh HJ, Kim JY, Park JH, Hwang NM, Hyeon T. Nature Materials. 2004;3:891. doi: 10.1038/nmat1251. [DOI] [PubMed] [Google Scholar]
- [32].Nitin N, LaConte LEW, Zurkiya O, Hu X, Bao G. Journal of Biological Inorganic Chemistry. 2004;9:706. doi: 10.1007/s00775-004-0560-1. [DOI] [PubMed] [Google Scholar]
- [33].Barrett EP, Joyner LG, Halenda PP. J. Am. Chem. Soc. 1951;73:373. [Google Scholar]
Associated Data
This section collects any data citations, data availability statements, or supplementary materials included in this article.


