Abstract
Spin echo pulse sequences are used to produce clinically important T2 contrast. However, conventional 180° RF pulses required to generate a spin echo are highly susceptible to the B1 inhomogeneity at high magnetic fields such as 7 Tesla (7T), resulting in varying signal and contrast over the region of interest. Adiabatic 180° pulses may be used to replace conventional 180° pulses in spin echo sequences to provide greater immunity to the inhomogeneous B1-field at 7T. However, because the spectral profile of an adiabatic 180° pulse has non-linear phase, pairs of these pulses are needed for proper refocusing, resulting in increased RF power deposition and long minimum echo times. We used the adiabatic SLR method to generate a matched-phase adiabatic 90°-180° pulse pair to obviate the need for a second adiabatic 180° pulse for phase refocusing. The pulse pair was then reformulated into a single self-refocused pulse to minimize the echo time, and phantom and in vivo experiments were performed to validate pulse performance. The self-refocused adiabatic pulse produced transmit profiles that were substantially more uniform than those achieved using a conventional spin echo sequence.
Keywords: adiabatic, Shinnar Le-Roux, RF pulse, self-refocused, matched-phase, pulse-pair, spin echo, B1-insensitive
2 Introduction
7 Tesla (7T) MR scanners offer the advantages of higher signal-to-noise ratio (SNR), increased spectral separation, and enhanced contrast [1-3]. Unfortunately, several technical issues at 7T, including B1 inhomogeneity and increased RF power deposition (as measured by the Specific Absorption Rate [SAR]), result in signal loss and contrast variation over the spatial region of interest as well as reduced slice coverage when using standard clinical imaging sequences [1, 4, 5]. Apparent T2 values are also effectively reduced for single echo sequences at ultrahigh field strengths [6, 7]. T2-weighted sequences such as the conventional spin echo (SE) sequence, fast spin echo (FSE) sequence and their variants are commonly used in neurological MR protocols because they reliably provide signal differences between normal and pathological tissue for a wide range of neurological diseases and disorders [8-14]. SE sequences may also be used for functional MRI (fMRI) at high magnetic fields as they provide blood oxygenation level dependent (BOLD) contrast with high spatial specificity [15]. However, Shinnar Le-Roux (SLR) [16] 180° pulses commonly used in spin-echo sequences are highly susceptible to B1 inhomogeneity. Adiabatic 180° pulses may be used instead of SLR pulses to provide B1-insensitive refocusing. But, due to the quadratic phase across the slice profile generated by adiabatic pulses, these pulses must be used in pairs to fully refocus the phase of the resultant spin echo. This results in increased SAR and long minimum echo times (TEs). A method to design hyperbolic secant (HS) [17-19] 90°-180° RF pulse pairs which imposes specific conditions on the amplitude, duration and truncation factor of the HS pulses in order to generate a linear-phase spin echo, has been previously proposed [20].
In this work, we leverage the systematic adiabatic SLR algorithm described in [21] to design high-bandwidth, low-peak-amplitude adiabatic RF pulses. We then use the polynomials for these pulses to generate an adiabatic matched-phase spin-echo pulse pair and, subsequently, a self-refocused spin-echo pulse. The adiabatic SLR algorithm takes advantage of the fact that overlaying a properly chosen degree of quadratic phase across the spectral profile of the RF pulse, prior to applying the inverse SLR transform, results in a pulse that exhibits the required spectral characteristics as well as adiabatic behavior. As in the conventional SLR algorithm [16], the adiabatic SLR algorithm requires calculation of the An(z) and Bn(z) polynomials for the designed pulse [21]. Once these polynomials are available, it is possible to design a matched-phase 90° pulse for an adiabatic 180° pulse so that a linear-phase spin echo may be produced without the use of a second 180° pulse. Similarly, a self-refocused adiabatic (SRA) 90°-180° pulse may be designed by utilizing the method in [22], which describes how to design a self-refocused spatial-spectral minimum-phase pulse. We apply this same method to generate a self-refocused pulse from quadratic-phase SLR RF pulses. The matched-phase pulse pair provides the advantages of B1-insensitive refocusing, linear spin echo phase profiles and reduced SAR when compared to pairs of refocusing pulses. The SRA pulse enables shorter minimum TE values than a pair of adiabatic 180° pulses or separate matched-phase 90°-180° pulses. Shorter TE values are especially advantageous at 7T due to the shortening of apparent T2 values.
We generated an adiabatic spin echo pulse with a matched-phase 90° pulse and used it to create an SRA pulse. The final pulse was tested in simulations as well as in phantom and in vivo experiments.
3 Methods
3.1 Overview of Design Algorithm
As a step in developing the SRA pulse, we first used the method described in [21] to design an adiabatic SLR 180° pulse with a 4.4 kHz bandwidth, 8 ms duration and peak RF amplitude of 17.5 μT. We denote An(z) and Bn(z) polynomials for the 180 as A180 and B180, respectively. As outlined in the adiabatic SLR algorithm in [21], we 1) generated the frequency profile for the pulse by setting it to the response of a linear phase filter with the desired bandwidth, selectivity and ripple amplitudes; 2) applied a properly chosen degree of quadratic phase across the profile; 3) set B180 to the Fourier transform of the frequency profile; 4) generated a matching minimum-phase A180 polynomial to achieve a minimum-energy RF pulse design and 5) set (A180, B180) as inputs to the inverse SLR to generate an RF pulse which we finally truncated to 8 ms. We used the resultant adiabatic 180° pulse to generate a phase-matched adiabatic pulse pair and finally a self-refocused adiabatic pulse. To create the pulse pair and self-refocused pulse, the method in [22] was used, which describes how to design a matched-phase 90° pulse which compensates the nonlinear phase profile of a 180° pulse and then outlines how to generate the polynomials for a single pulse that would produce transverse magnetization equivalent to that generated by a pair of separate 90° and 180° pulses.
Following the method in [22], the first step was to use B180 to design the Bn(z) polynomial for a matched-phase 90° pulse, denoted as B90, using the relationship in Eqn. 1 [22].
| (1) |
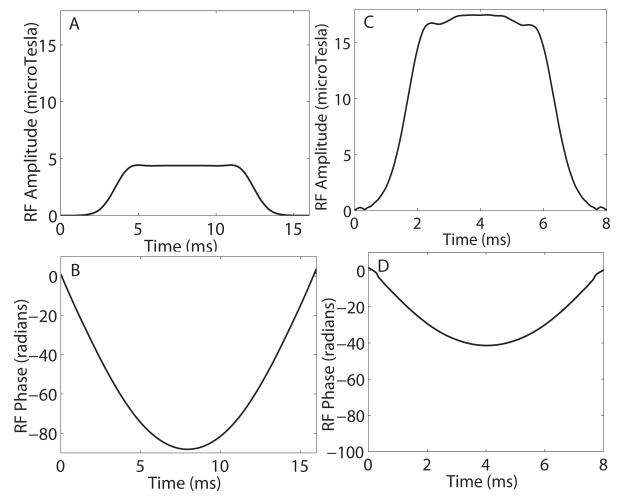
Given B90, a matching minimum-phase A90 polynomial was generated [16]. Once the polynomials for the adiabatic 180° pulse and matched-phase 90° pulse were available, the final 90° and 180° RF pulses were generated. RF amplitude and phase waveforms for the matched-phase 90° and 180° pulses are shown in Figs. 1 (A,B) and (C,D), respectively. These pulses could be used as a pair to generate a linear phase spin echo profile, without the necessity for a second 180° pulse.
Figure 1.
Amplitude and phase waveforms for the matched-phase 90° pulse (A,B) corresponding to the adiabatic SLR 180° pulse(C,D). Nonlinear phase across the spectral profile is refocused by the 90°-180° pulse pair.
In order to further reduce the minimum TE, we used the calculated B180 and B90 to generate a single self-refocused pulse using the method in [22]. The polynomials for the self-refocused adiabatic pulse, Asr and Bsr, were designed to generate a pulse that produces transverse magnetization equivalent to a spin echo [22]. If α and β represent the profiles of the polynomials, An(z) and Bn(z), evaluated along frequency, αsr and βsr for the SRA pulse are given by Eqn. 2.
| (2) |
ε is given by
| (3) |
where ω is the spectral frequency and ΔT is the time between the end of the self-refocused pulse and the occurrence of the spin-echo.
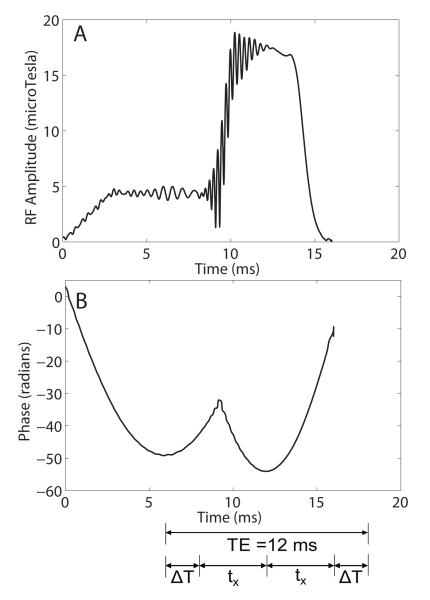
Because the self-refocused pulse is generated by essentially combining the matched-phase 90° and adiabatic 180° pulses into a single pulse, a considerably shorter TE than that possible with two separate pulses is achieved. We define tx as the time between the center and end of the 180°, where the center of the pulse is the position of null slope of the quadratic phase. Therefore, tx, in our case is half the duration of the 180° pulse. The centers of the of the 90° and the 180° portion of the pulse are separated by (tx + ΔT), making the effective TE for the SRA pulse 2(tx + ΔT).
The self-refocused pulse we designed had a pulse duration of 16 ms, BW of 4.4 kHz and peak RF amplitude of 17.5 μT. With ΔT = 2ms and tx = 4ms, the effective TE is 12 ms. Therefore the echo formation occurs at time 12 ms from the center of the effective 90° pulse and 18 ms from the start of the SRA pulse. As a comparison, if the matched-phase 90° and 180° pulses used to create this SRA pulse were used as separate pulses with a 2-ms echo delay separating the end of the 180° and the readout, the minimum TE would be 28 ms. If crusher gradients were inserted around the 180° pulse, the TE would be further lengthened by twice the crusher duration.
RF amplitude and phase waveforms for the SRA pulse are shown in Figs. 2 A and B. The effective TE is indicated on the waveforms.
Figure 2.
(A) Amplitude and (B) phase waveforms for the self-refocused adiabatic 90°-180° pulse. The effective TE for the pulse is 12 ms.
3.2 Simulations
Simulations were performed in MATLAB by calculating the Cayley-Klein parameters, α and β for the piecewise constant RF pulse as described in [16]. The expressions for the Cayley-Klein parameters represent a series of rotations and may be used to generate the spectral profile for the pulse which is given by Eqn. 4.
| (4) |
where the initial longitudinal magnetization is assumed to be 1. Note that this is equivalent to the calculations performed by a discrete-time Bloch simulator [16]
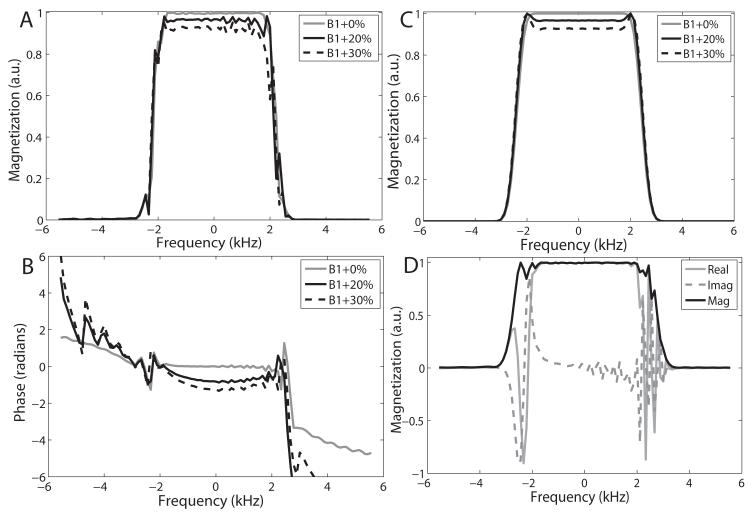
In the presence of a slice-select gradient, the spectral profile is equivalent to the slice profile. For the simulations, we neglected T1 and T2 effects. However relaxation effects are not negligible at higher field strengths and contribute to contrast differences which were elucidated in the in vivo experiments. To determine the B1-insensitivity of the SRA pulse, the spectral profile was simulated with RF amplitude set to the adiabatic threshold and 20% and 30% above the adiabatic threshold. Magnitude and phase of the simulated spectral profiles are shown in Figs. 3 A and B. The constant phase term, which does not affect the slice integral, was removed from the phase profiles in Fig. 3 B in order to assess compensation of nonlinear phase. As the B1 value is overdriven, some degradation of phase compensation occurs resulting in a small amount of quadratic phase across the profile, leading to signal loss. For example, when the pulse is overdriven by 30%, the residual quadratic phase results in an additional 8.5% loss of signal when integrating across the profile. When using this pulse to select a slab and spatially resolving across that slab, this effect is further reduced. However, this is an intrinsic disadvantage of using a matched-phase pulse pair or self-refocused pulse when compared to a pair of adiabatic 180° pulses for refocusing. Above the adiabatic threshold, signal loss and distortion of the profile are similar to those of the matched-phase 90° pulse for which the profiles are shown in Fig. 3 C, demonstrating that B1-insensitive refocusing is achieved. There are, however, some high frequency variations in the passband of the SRA pulse, which do not exist in the 90° pulse profiles. For the simulated profiles in Fig. 3 (A) and (B), acquisitions from two different self-refocused pulses designed to have a 180° echo phase difference are subtracted to produce the final profile [22]. This is performed to eliminate unrefocused and parasitic components of the magnetization, ordinarily accomplished by crushers which are absent for a self-refocused pulse. However, in the case of an adiabatic 180° pulse, which is more effective in providing an exact 180° flip than a conventional SLR pulse, the need for crushers is greatly reduced. Figure 3 (D) shows the simulated spectral profile for a single self-refocused pulse played at the adiabatic threshold. The unrefocused magnetization is largely limited to the transition bands. Furthermore, the real and imaginary components of the profiles show that the magnetization in the transition bands is highly varying, reducing the integral across frequency. Therefore a single SRA acquisition is su cient to produce a reasonably selective spectral profile and, in our phantom and in vivo experiments, only a single SRA pulse has been used to generate a spin echo.
Figure 3.
Simulated (A) magnitude and (B) phase of the spectral profile of the SRA pulse for B1 values at and above the adiabatic threshold by 20% and 30%. The profiles in (A) and (B) are obtained by taking the difference of two acquisitions produced by SRA pulses with a 180° difference in echo phase in order to remove unrefocused components of the magnetization. The magnitude of the associated matched-phase 90° pulse driven to the same B1 values is shown in (C). Except for some high-frequency distortions in the passband for the SRA profiles in (A), profile behavior for the SRA pulse is similar to that for the matched-phase 90° pulse. Magnitude, real and imaginary components of the spectral profile of the spin echo produced by a single SRA pulse with amplitude set to the adiabatic threshold is shown in (D). Due to the absense of crushers, the single acquisition scheme results in some unrefocused components within the transition bands which mostly integrate to zero. For adiabatic 180° pulses, a single acquisition is su cient to produce a reasonably selective spectral profile.
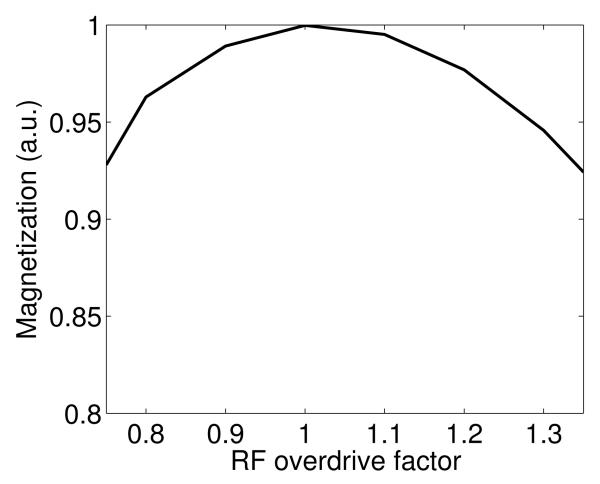
The maximum value of the simulated spectral profile for the SRA pulse was plotted for RF overdrive factors ranging from 0.75 to 1.35 in Fig. 4 in order to show behavior of the pulse below and above adiabatic threshold. The RF overdrive factor is equal to the amplitude at which we operate the pulse divided by the amplitude of the pulse at adiabatic threshold. Therefore, a RF overdrive factor of 1.2 would mean a 20% increase of pulse amplitude above the adiabatic threshold. Fig. 4 shows that operating the pulse at 10% below or above the adiabatic threshold results in minimal signal loss.
Figure 4.
Simulated values of the magnitude of the magnetization produced by a 16 ms SRA pulse with TE=12 ms for a range of B1 amplitudes.
The SAR value for the 16 ms SRA pulse was calculated and found to be similar to the combined SAR of an 8 ms HS 180° pulse with equivalent spectral bandwidth (BW) and the corresponding 16 ms matched-phase 90° pulse. This coheres with the fact that two pulses with equivalent Bn(z) magnitude profiles will have minimum-phase An(z) polynomials with the same value for the term a0 [16]. The value of a0 is proportional to one minus the pulse’s average RF power, and therefore two pulses with similar flip angles, duration, BW and selectivity should have similar RF power. Note that most of the RF power of the SRA pulse is contributed by the 180° portion of the pulse.
Although the SAR of the adiabatic SLR 180° pulse used in the SRA pulse is similar to that of the HS equivalent, the adiabatic SLR pulse achieves appreciably lower RF peak amplitude and therefore enables adiabatic behavior over a greater range of B1 inhomogeneity than an HS pulse [21]. Equivalently, for a fixed RF peak amplitude at the adiabatic threshold, the adiabatic SLR 180° pulse achieves greater spectral BW than pulses with less uniform RF distribution such as HS or linear-phase SLR 180° pulses. Other techniques exist to broaden the bandwidth of adiabatic pulses while minimizing the peak RF power [18, 23-29].
3.3 Phantom Experiments
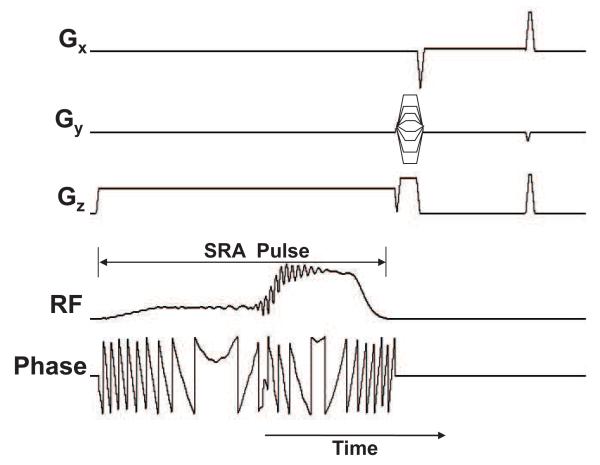
Phantom experiments were conducted to verify pulse performance. The scans were performed on a 7T scanner (Echospeed whole-body magnet; GE Healthcare, Waukesha, WI, USA) using a quadrature birdcage head coil (Nova Medical Inc., Wilmington, MA). The SRA pulse was added to a standard SE sequence instead of the 90° and 180° pulses. The RF and gradient waveforms for the SRA pulse sequence are shown in Fig. 5.
Figure 5.
RF, phase and gradient waveforms for the pulse sequence which utilizes the self-refocused adiabatic pulse to produce a spin echo.
The same slice of a spherical agar phantom was imaged using the SRA pulse sequence in Fig. 5 and a conventional SE sequence in order to compare transmit uniformity. The SE sequences utilizes a linear-phase SLR 90° pulse and 180° pulse to achieve a spin echo. Acquisition parameters for both sequences were: TE/TR = 12/400ms, matrix size = 256×256 grid, slice thickness = 5 mm, FOV = 20×20cm, scan time = 1:49 min. A B1 map of the same slice was measured using the using the double-angle method [30, 31]. Receive sensitivity was estimated in order to remove image shading caused by nonuniform signal reception. Because of the absence of a body coil on our 7T MRI scanner, the receive sensitivity for our head coil was estimated from a proton density weighted image obtained using a GRE sequence with a 50° excitation flip angle (FA) and the measured transmit B1 map. The expected image intensity at any point in the image is the product of the spin density and transmit and receive sensitivity distributions [32]. Assuming the spin density to be uniform throughout the slice in the homogeneous phantom, we estimated the magnitude of the receive sensitivity by dividing the magnitude of the GRE image by sin(FA · B1,norm), where B1,norm is the normalized unitless B1 map. Images obtained using the SRA sequence and SE sequence where divided by the estimated receive profile and compared. These receive-compensated images were then divided by sin( · B1,norm) to remove the signal attenuation due to the 90° portion of the pulse and isolate the effect of the adiabatic 180° pulse. The uncompensated images, receive-compensated images and excitation transmit- and receive-compensated images for the SRA and SE sequences were compared and evaluated for uniformity.
3.4 In Vivo Experiments
In vivo data were initially obtained from the brain of a normal volunteer scanned at 3T (Echospeed whole-body magnet; GE Healthcare, Waukesha, WI, USA) with a standard birdcage head coil. Although our objective was to design a RF pulse for spin echo imaging at 7T, 3T data were first obtained in order to extricate pulse behavior from distortions due to physical limitations at ultra-high fields. This allowed the intrinsic contrast generated by the pulse to be studied prior to testing the pulse at 7T. As in the case of the phantom experiments, the same axial slice through the brain was acquired using the SRA sequence in Fig. 5 and a conventional SE sequence and the images were compared in terms of contrast. Because we were limited by the maximum output of 17 μT for our RF coil/amplifier combination at 3T, we used a pulse designed to have a BW of 3 kHz and consequently reduced peak RF amplitude of 13.5 μT, increased pulse duration of 24 ms and increased TE of 16.5 ms when compared to the 4.4 kHz pulse shown in Fig. 2. Complete acquisition parameters were: TE/TR=16.5/200 ms, slice thickness=4 mm and matrix size=256×256, nex=3, FOV=22×22 cm and scan time=2:38 min.
In vivo scans were also performed at 7T using the quadrature head coil. An axial slice through the brain was acquired using the SRA sequence and the SE sequence. For the 7T experiments, we used the original 4.4 kHz pulse in Fig. 2 because of the higher allowable peak RF output (35μT) for our 7T coil/amplifier combination. Acquisition parameters for both scans were: TE/TR=13.5/300 ms, slice thickness=5 mm and matrix size=256×256, nex=2, FOV=24×24 cm and scan time=2:38 min. A transmit B1 map of the same slice was obtained using a Bloch-Siegert (BS) B1 mapping sequence utilizing a 4 ms quad pulse modulated to 1.94 kHz off-resonance as described in [33, 34] with the following acquisition parameters: TE/TR=7.8/200 ms, slice thickness=5 mm and matrix size=64×64, nex=1, FOV=22×22 cm and scan time=56 secs. A receive sensitivity map was also calculated using a method similar to that described for the phantom experiments, utilizing the measured BS B1 map and a Gaussian-filtered image (to approximate spin density). The SE and SRA images were divided by the normalized receive sensitivity in order to compensate for signal attenuation on the receive side. Cross-sections through these receive-compensated images were compared.
4 Results
4.1 Phantom Results
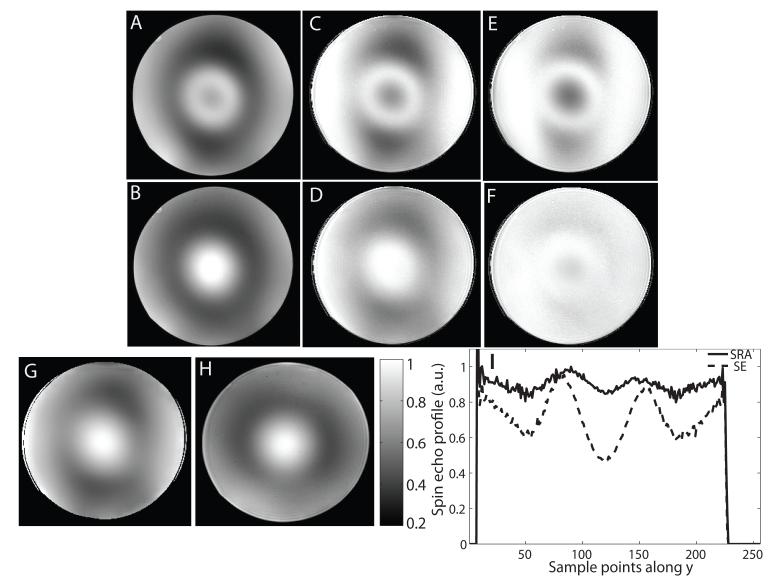
Refer to Fig. 6 for data from the spherical agar phantom scanned at 7T. Figures 6 A, C and E show the uncompensated image, receive-compensated image and excitation transmit- and receive-compensated image obtained using a conventional SE sequence, respectively. Figures 6 B, D and F show the same three images for the SRA pulse sequence. When comparing the uncompensated images in Figs. 6 A and B, greater signal loss is apparent for the SE sequence (A) when compared to the SRA sequence (B) at the center of the phantom where the SLR 180° pulse fails due to being overdriven. Both images su er from signal attenuation due to the nonuniform receive sensitivity. By studying 6 C and D, which have been compensated for this receive sensitivity, it is possible to compare the transmit performance of the two sequences. The SRA sequence achieves much greater B1 transmit uniformity than the SE sequence. Figure 6 E and F, in which the effect of the 90° excitation has been removed, allow us to compare the performance of the 180° pulse. Figure 6 I shows central vertical cross-sections through the images in E and F. The SRA pulse achieves a more uniform 180° FA than the SE sequence which fails in areas where B1 is highest and lowest. For the cross sections plotted in I, the maximum deviation from a uniform refocusing profile is 47% for the SE sequence and 13% for the SRA sequence. The measured B1 and estimated receive sensitivity profiles are shown in Figs. 6 G and H. The shapes of the two profiles are similar but slightly skewed with respect to each other.
Figure 6.
Image of a slice through a spherical agar phantom obtained at 7T using (A) a standard SE sequence and (B) the SRA pulse sequence shown in Fig. 5. The SE and SRA images after compensation by the receive B1 profile are shown in (C) and (D), respectively. The compensated images in (C) and (D), after division by the sine of the transmit B1 profile of the 90° pulse, are shown in (E) and (F). Vertical cross sections through (E) and (F) are plotted in (I) to show the difference in refocusing e ciency between the two different sequences. Scan parameters for both sequences were: TE/TR: 12/400ms, 256×256 grid, 5 mm slice, 20×20cm FOV. The SRA pulse achieves a more uniform transmit profile when compared to the conventional SE sequence due to the B1 insensitivity of the adiabatic 180° pulse. (G) and (H) Show the measured transmit B1 profile and calculated receive sensitivity profile for the same slice.
4.2 In Vivo Results
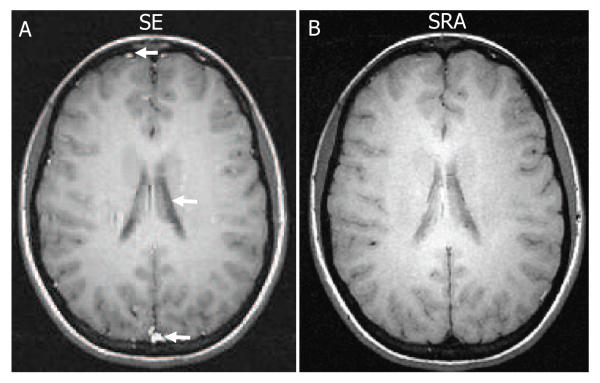
Figure 7 shows in vivo data from the brain of a normal volunteer scanned at 3T. Figures 7 A and B show axial spin echo T1-weighted images obtained using a SE sequence and the SRA pulse sequence, respectively. The images appear similar except for a few differences in contrast indicated by the white arrows. In particular, slowly moving substances such as venous blood in the superior sagittal sinus are brighter in the SE image than the SRA image. A possible reason for this difference is that signal components from slowly moving tissue accrue linear phase in the SE sequence, which may add constructively, but accrue quadratic phase in the SRA sequence, which may add destructively. Other reasons for these contrast differences include the fact that, unlike the SE sequence, the magnetization is spin locked for a large portion of the SRA pulse and therefore will experience a T1ρ-like contrast. Cerebrospinal fluid (CSF) in the ventricles appears brighter in the SRA image when compared to the SE image. The SRA pulse offers greater immunity to the peak in B1 at the center of the brain resulting in less signal attenuation than the conventional SLR 180° pulse used in the SE sequence.
Figure 7.
In vivo axial brain images from a normal volunteer obtained using a standard birdcage head coil at 3T. Image obtained using (A) a conventional SE sequence and (B) the SRA pulse sequence. Acquisition parameters for both sequences were: TE/TR=16.5/200 ms, slice thickness=4 mm and matrix size=256×256, nex=3, FOV=22×22 cm and scan time=2:38 min. Some differences in contrast between tissue types, particularly fluids, exist between the two spin echo acquisitions.
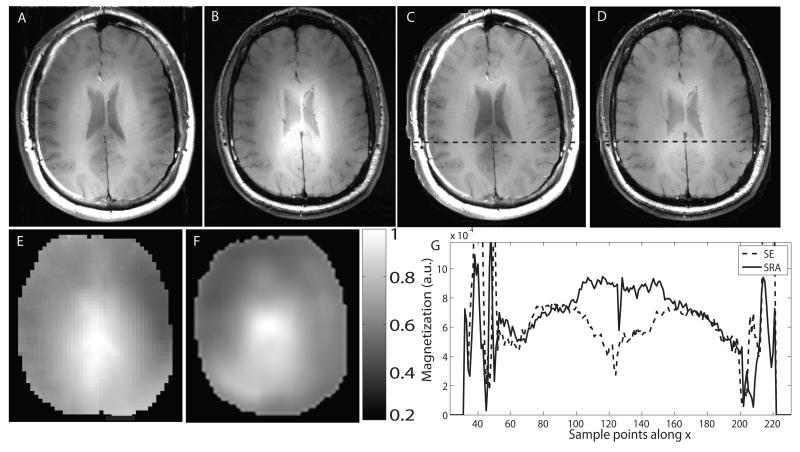
Similar in vivo scans were conducted at 7T. Figures 8 A and B show axial images through the brain obtained using the SE and SRA sequences. The images are scaled to the same noise floor and windowed identically. The same images, after compensation by the receive sensitivity profile, are shown in Figs. 8 C and D. The BS B1 map and the calculated receive sensitivity map of the same slice are shown in Figs. 8 E and F. Figs. 8 C and D show that the SRA pulse achieves greater signal and contrast uniformity than the SE sequence in regions where the B1 field, shown in E, reaches its highest and lowest values. Contrast differences in the edges of the brain are apparent when evaluating the images. Fig 8 G is a plot of horizontal cross sections taken just posterior to the ventricles from the images in Figs. 8 C and D. The profiles indicate a substantial difference in signal at the center of the brain, where B1 is highest. As discussed earlier, some loss of signal and contrast may occur for the SRA pulse due to the fact that the excitation portion of the pulse is still B1-sensitive and that some degradation in phase-matching occurs when the pulse is under- or overdriven. Subcutaneous fat appears darker in the SRA image when compared to the SE image. Differing B1 values at the periphery of the brain as well as differing sensitivities to chemical shift for the RF pulses in the two sequences may be contributing to this effect. However, further investigation is required to fully understand the source of this difference.
Figure 8.
In vivo axial brain images from a normal volunteer obtained using a quadrature head coil at 7T. Image obtained using (A) a conventional SE sequence and (B) the SRA pulse sequence. Acquisition parameters for both sequences were: TE/TR=13.5/300 ms, slice thickness=5 mm and matrix size=256×256, nex=2, FOV=24×24 cm and scan time=2:38 min. A transmit B1 map of the same slice obtained using a BS B1 mapping sequence is shown in (E). The calculated receive sensitivity map is shown in (F). (C) and (D) show the original images in (A) and (B) after compensation by the receive map. The SLR 180° pulse in the conventional spin echo sequence becomes overdriven at the center of the brain and underdriven at the edges of the brain where transmit B1 is at its highest and lowest value, respectively. This results in signal loss and contrast differences. Horizontal cross sections indicated by the dashed lines on (E) and (F) are plotted in (G). Comparatively, the adiabatic SLR pulse achieves greater transmit B1 uniformity, particularly at the center of the brain.
5 Discussion
We utilized the adiabatic SLR algorithm to generate An(z) and Bn(z) polynomials for an adiabatic matched-phase pulse pair, and then used these polynomials to generate a single SRA spin echo pulse. The performance of this SRA pulse was validated through phantom and in vivo experiments at 3T and 7T. An alternative method to design matched-phase 90° pulses for HS adiabatic 180° pulses has been previously proposed by Park and Garwood [20]. In their work, a set of specific conditions governing the amplitude, duration and truncation of a HS 90° and HS 180° pulse and their gradients are used to generate a HS 90°-180° pulse pair that results in a linear-phase spin echo. However, the method does not utilize the SLR algorithm and does not describe the generation of a self-refocused pulse.
Advantages of the SRA pulse include: 1) greater immunity to B1-variation than conventional SLR 90°-180° pulse pairs; 2) reduced RF power deposition and shorter TEs than sequences utilizing pairs of adiabatic 180° pulses to generate a spin echo; and 3) higher spectral BW when compared to SLR and adiabatic HS pulses with the same peak RF amplitude. Some disadvantages of the SRA pulse include high-frequency distortions in the spectral passband and some degradation of the phase compensation mechanism which becomes more pronounced as B1 is increased above the adiabatic threshold. Due to the spin-locked state of the magnetization during the adiabatic 180° portion of the SRA pulse and possible quadratic phase accrual for moving substances, contrast achieved by the pulse is different than that achieved by a pair of linear-phase SLR pulses. Further analysis is required to better characterize the contrast mechanisms associated with this pulse.
Several possible applications exist for the pulses presented in this work. We have shown that the SRA pulse presented in this paper can be used to replace the SLR 90°-180° pulse pair in a conventional SE sequence. We are investigating a partially adiabatic FSE sequence that utilizes these pulses. The FSE sequence is commonly used in standard neurological imaging protocols to obtain clinically valuable T2 contrast within reasonable acquisition times [8]. We plan to replace the 90° and first 180° in the RF pulse train used in the FSE sequence with an adiabatic matched-phase pulse pair to obtain the central k-space samples in the slice dimension. Using a matched-phase adiabatic pulse pair enables partially adiabatic acquisition while ensuring linear phase profiles and limiting SAR to reasonable values.
We are also examining the use of these pulses for high-field fMRI. We are planning to use a matched-phase adiabatic pulse pair or the SRA pulse presented in this work to perform spin-echo T2-weighted functional imaging. The BOLD effect from the microvasculature is more spatially correlated to neuronal activity than that from larger blood vessels. Operating at very high magnetic fields, such as 7T, increases the SNR and the ratio of BOLD signal arising from parenchyma versus larger venous blood vessels [1, 35, 36]. Spin echo imaging, instead of GRE imaging, may be used to isolate this signal from small blood vessels. Spin-echo imaging also refocuses losses due to B0-inhomogeneity, which increase with field strength. The shorter TEs achieved by the matched-phase or single refocused adiabatic pulses are particularly advantageous at high field strengths, such as 7T, due to the shortening of apparent T2 values for single echo sequences.
In conclusion, we have developed a method to generate matched-phase adiabatic RF pulse pairs using the SLR algorithm and used the polynomials for these pulses to create a self-refocused adiabatic RF pulse. Phantom and in vivo experiments validate that the pulse generates a spin echo profile that has greater B1 immunity than that achieved by conventional SLR pulses. Finally, the pulse achieves a linear phase profile, while enabling shorter TEs and reduced SAR when compared to the use of a pair of adiabatic RF pulses to produce a spin echo.
Acknowledgments
We would like to thank Dr. Brian Rutt for useful advice on high field issues.
This work was supported by NIH P41 RR009784, R01 MH080913, GE Healthcare and The Lucas Foundation.
References
- [1].Norris D. High field human imaging. J Magn Reson Imaging. 2003;18(5):519–529. doi: 10.1002/jmri.10390. [DOI] [PubMed] [Google Scholar]
- [2].Schick F. Whole-body MRI at high field: technical limits and clinical potential. European radiology. 2005;15(5):946–959. doi: 10.1007/s00330-005-2678-0. [DOI] [PubMed] [Google Scholar]
- [3].Ugurbil K, Adriany G, Andersen P, Chen W, Garwood M, Gruetter R, Henry PG, Kim SG, Lieu H, Tkac I, Vaughan T, Moortele PFVD, Yacoub E, Zhu XHA. Ultrahigh field magnetic resonance imaging and spectroscopy. Magn Reson Med. 2003;21(10):1263–1281. doi: 10.1016/j.mri.2003.08.027. [DOI] [PubMed] [Google Scholar]
- [4].Thomas B, Welch E, Niederhauser B, Whetsell W, Jr, Anderson A, Gore J, Avison M, Creasy J. High-resolution 7T MRI of the human hippocampus in vivo. J Magn Reson Imaging. 2008;28(5):1266–1272. doi: 10.1002/jmri.21576. [DOI] [PMC free article] [PubMed] [Google Scholar]
- [5].Vaughan JT, Garwood M, Collins CM, Liu W, DelaBarre L, Adriany G, Andersen P, Merkle H, Goebel R, Smith MB, Ugurbil K. 7T vs. 4T: RF power, homogeneity, and signal-to-noise comparison in head images. Magn Reson Med. 2001;46(1):24–30. doi: 10.1002/mrm.1156. [DOI] [PubMed] [Google Scholar]
- [6].Yuh WT, Christoforidis GA, Koch RM, Sammet S, Schmalbrock P, Yang M, Knopp MV. Clinical magnetic resonance imaging of brain tumors at ultrahigh field: a state-of-the-art review. Top Magn Reson Imaging. 2006;17(2):53–61. doi: 10.1097/RMR.0b013e3180300404. [DOI] [PMC free article] [PubMed] [Google Scholar]
- [7].Bartha R, Michaeli S, Merkle H, Adriany G, Andersen P, Chen W, Ugurbil K, Garwood M. In vivo 1H2O T2+ measurement in the human occipital lobe at 4T and 7T by carrpurcell MRI: detection of microscopic susceptibility contrast. Magn Reson Med. 2002;47(4):742–750. doi: 10.1002/mrm.10112. [DOI] [PubMed] [Google Scholar]
- [8].Atlas S. MRI of the brain and spine. Lippincott Williams & Wilkins; 1996. [Google Scholar]
- [9].Lee M, Smith S, Palace J, Matthews P. Defining multiple sclerosis disease activity using MRI T2-weighted difference imaging. Brain. 1998;121(11):2095. doi: 10.1093/brain/121.11.2095. [DOI] [PubMed] [Google Scholar]
- [10].Oh J, Cha S, Aiken A, Han E, Crane J, Stainsby J, Wright G, Dillon W, Nelson S. Quantitative apparent diffusion coefficients and T2 relaxation times in characterizing contrast enhancing brain tumors and regions of peritumoral edema. J Magn Reson Imaging. 2005;21(6):701–708. doi: 10.1002/jmri.20335. [DOI] [PubMed] [Google Scholar]
- [11].De Vita E, Thomas D, Roberts S, Parkes H, Turner R, Kinchesh P, Shmueli K, Yousry T, Ordidge R. High resolution MRI of the brain at 4.7 Tesla using fast spin echo imaging. British Journal of Radiology. 2003;76(909):631. doi: 10.1259/bjr/69317841. [DOI] [PubMed] [Google Scholar]
- [12].Woermann F, Steiner H, Barker G, Bartlett P, Elger C, Duncan J, Symms M. A fast FLAIR dual-echo technique for hippocampal T2 relaxometry: First experiences in patients with temporal lobe epilepsy. J Magn Reson Imaging. 2001;13(4):547–552. doi: 10.1002/jmri.1077. [DOI] [PubMed] [Google Scholar]
- [13].Von Oertzen J, Urbach H, Blumcke I, Reuber M, Traber F, Peveling T, Menzel C, Elger C. Time-efficient T2 relaxometry of the entire hippocampus is feasible in temporal lobe epilepsy. Neurology. 2002;58(2):257. doi: 10.1212/wnl.58.2.257. [DOI] [PubMed] [Google Scholar]
- [14].Tomura N, Kato K, Takahashi S, Sashi R, Sakuma I, Narita K, Watarai J. Comparison of multishot echo-planar fluid-attenuated inversion-recovery imaging with fast spin-echo fluid-attenuated inversion-recovery and T2-weighted imaging in depiction of white matter lesions. Journal of computer assisted tomography. 2002;26(5):810. doi: 10.1097/00004728-200209000-00024. [DOI] [PubMed] [Google Scholar]
- [15].Duong T, Yacoub E, Adriany G, Hu X, Ugurbil K, Vaughan J, Merkle H, Kim S. High-resolution, spin-echo BOLD, and CBF fMRI at 4 and 7 T. Magn Reson Med. 2002;48(4):589–593. doi: 10.1002/mrm.10252. [DOI] [PubMed] [Google Scholar]
- [16].Pauly J, Le Roux P, Nishimura D, Macovski A. Parameter relations for the Shinnar-Le Roux selective excitation pulse design algorithm. IEEE Trans Med Imaging. 1991;10(1):53–65. doi: 10.1109/42.75611. [DOI] [PubMed] [Google Scholar]
- [17].Silver MS, Joseph RI, Hoult DI. Highly selective π/2 and π pulse generation. J Magn Reson. 1984;59:347–351. [Google Scholar]
- [18].Baum J, Tycko R, Pines A. Broadband and adiabatic inversion of a two-level system by phase-modulated pulses. Phys Rev A. 1985;32:3435–3447. doi: 10.1103/physreva.32.3435. [DOI] [PubMed] [Google Scholar]
- [19].Silver MS, Joseph RI, Hoult DI. Selective spin inversion in nuclear magnetic resonance and coherent optics through an exact solution of the Bloch-Riccati equation. Phys Rev A. 1985;31(4):2753–2755. doi: 10.1103/physreva.31.2753. [DOI] [PubMed] [Google Scholar]
- [20].Park JY, Garwood M. Spin-echo MRI using π/2 and π hyperbolic secant pulses. Magn Reson Med. 2009;61(1):175–187. doi: 10.1002/mrm.21822. [DOI] [PMC free article] [PubMed] [Google Scholar]
- [21].Balchandani P, Pauly J, Spielman DM. Designing adiabatic RF pulses using the Shinnar-Le Roux algorithm. Magn Reson Med. 2010;64(3):843–851. doi: 10.1002/mrm.22473. [DOI] [PMC free article] [PubMed] [Google Scholar]
- [22].Balchandani P, Yamada M, Pauly J, Yang P, Spielman DM. Self-refocused spatial-spectral pulse for positive contrast imaging of cells labeled with SPIO nanoparticles. Magn Reson Med. 2009;62(1):183–192. doi: 10.1002/mrm.21973. [DOI] [PMC free article] [PubMed] [Google Scholar]
- [23].Ugurbil K, Garwood M, Rath AR. Optimization of modulation functions to improve insensitivity of adiabatic pulses to variations in B1 magnitude. J Magn Reson. 1988;80:448–469. [Google Scholar]
- [24].Tannús A, Garwood M. J Magn Reson. 1996;120:133–137. [Google Scholar]
- [25].Tannús A, Garwood M. Adiabatic pulses. NMR Biomed. 1997;10(8):423–34. doi: 10.1002/(sici)1099-1492(199712)10:8<423::aid-nbm488>3.0.co;2-x. [DOI] [PubMed] [Google Scholar]
- [26].Conolly S, Glover G, Nishimura D, Macovski A. A reduced power selective adiabatic spin-echo pulse sequence. Magn Reson Med. 1991;18:28–38. doi: 10.1002/mrm.1910180105. [DOI] [PubMed] [Google Scholar]
- [27].Ordidge RJ, Wylezinska M, Hugg JW, Butterworth E, Franconi F. Frequency offset corrected inversion (FOCI) pulses for use in localized spectroscopy. Magn Reson Med. 1996;36(4):562–566. doi: 10.1002/mrm.1910360410. [DOI] [PubMed] [Google Scholar]
- [28].Rosenfeld D, Zur Y. A new adiabatic inversion pulse. Magn Reson Med. 1996;36:124–136. doi: 10.1002/mrm.1910360121. [DOI] [PubMed] [Google Scholar]
- [29].Hu S, Larson PE, Kerr AB, Kelley DA, Tropp J, Pauly JM, Kurhanewicz J, Vigneron DB. Application of HSn low peak B1 adiabatic refocusing pulses to hyperpolarized 13C spectroscopic imaging; Proceedings of the 17th Annual Meeting of ISMRM; Honolulu. 2009.p. 332. [Google Scholar]
- [30].Stollberger R, Wach P. Imaging of the active B1 field in vivo. Magn Reson Med. 1996;35(2):246–251. doi: 10.1002/mrm.1910350217. [DOI] [PubMed] [Google Scholar]
- [31].Insko EK, Bolinger L. Mapping of the radiofrequency field. J Magn Reson Series A. 1993;103:82–85. [Google Scholar]
- [32].Glover GH, Hayes CE, Pelc NJ, Edelstein WA, Mueller OM, Hart HR, Hardy CJ, O’donnell M, Barber WD. Comparison of linear and circular polarization for magnetic resonance imaging. Journal of Magnetic Resonance (1969) 1985;64(2):255–270. [Google Scholar]
- [33].Sacolick L, Wiesinger F, Hancu I, Vogel M. B1 mapping by Bloch-Siegert shift. Magn Reson Med. 2010;63(5):1315–1322. doi: 10.1002/mrm.22357. [DOI] [PMC free article] [PubMed] [Google Scholar]
- [34].Khalighi MM, Rutt BK, Saranathan M, Kerr AB. RF pulse optimization for Bloch-Siegert B1+ mapping; Proceedings of the 19th Annual Meeting of ISMRM; Montreal. 2011.p. 229. [Google Scholar]
- [35].Duong TQ, Yacoub E, Adriany G, Hu X, Ugurbil K, Kim SG. Microvascular BOLD contribution at 4 and 7 T in the human brain: Gradient-echo and spin-echo fMRI with suppression of blood effects. Magn Reson Med. 2003;49(6):1019–1027. doi: 10.1002/mrm.10472. [DOI] [PubMed] [Google Scholar]
- [36].Yacoub E, Duong TQ, Van De Moortele PF, Lindquist M, Adriany G, Kim SG, Uğurbil K, Hu X. Spin-echo fMRI in humans using high spatial resolutions and high magnetic fields. Magn Reson Med. 2003;49(4):655–664. doi: 10.1002/mrm.10433. [DOI] [PubMed] [Google Scholar]


