

Abstract
The node of Ranvier is a tiny segment of a myelinated fiber with various types of specializations adapted for generation of high-speed nerve impulses. It is ionically specialized with respect to ion channel segregation and ionic fluxes, and metabolically specialized in ionic pump expression and mitochondrial density augmentation. This report examines the interplay of three important parameters (calcium fluxes, Na pumps, mitochondrial motility) at nodes of Ranvier in frog during normal nerve activity. First, we used calcium dyes to resolve a highly localized elevation in axonal calcium at a node of Ranvier during action potentials, and showed that this calcium elevation retards mitochondrial motility during nerve impulses. Second, we found, surprisingly, that physiologic activation of the Na pumps retards mitochondrial motility. Blocking Na pumps alone greatly prevents action potentials from retarding mitochondrial motility, which reveals that mitochondrial motility is coupled to Na/K-ATPase. In conclusion, we suggest that during normal nerve activity, Ca elevation and activation of Na/K-ATPase act, possibly in a synergistic manner, to recruit mitochondria to a node of Ranvier to match metabolic needs.
Introduction
Mitochondria (Andrews et al., 2005, 2006; Dutta et al., 2006; Einheber et al., 2006; Baloh et al., 2007; Mahad et al., 2008, 2009), Ca2+ (Sun and Chiu, 1999; Verbny et al., 2002; Zhang et al., 2004, 2006; Stys, 2005), and Na/K-ATPase (Waxman, 2008; Young et al., 2008) are three important players in normal physiology and pathophysiology of myelinated axons. In particular, dysregulation of mitochondrial dynamics, such as motility, is linked to axonal pathology (Baloh et al., 2007; Chan, 2007; Detmer and Chan, 2007; Baloh, 2008). This study addresses a novel question in myelinated nerve biology on this interesting tripartite: mitochondrial motility, Ca, and Na pumps. How does nerve activity affect interaction within this tripartite?
Mitochondria are not uniformly distributed in neurons (Hollenbeck and Saxton, 2005) and display increased density at two major, metabolically active sites: the nodes of Ranvier in the peripheral nervous system (Berthold, 1978; Fabricius et al., 1993) and the synapse (for review, see Hollenbeck and Saxton, 2005). A local increase in mitochondrial density may reflect rapid recruitment of these highly mobile organelles to active sites to serve metabolic demands during physiological stimuli. Of these two sites, mitochondrial recruitment has been thoroughly studied in the synapse. In the synapse, the primary signal for recruitment is high Ca influx mediated by neurotransmitters (Yi et al., 2004), which arrests mitochondria through a direct and indirect mechanism. Directly, calcium arrests mitochondrial motility by targeting Miro, a calcium sensor coupled to mitochondrial motors (Saotome et al., 2008; Cai and Sheng, 2009; Macaskill et al., 2009; Wang and Schwarz, 2009). Indirectly, high Ca influx arrests mitochondrial movement by local ATP depletion caused by activation of Ca-ATPase [i.e., sarco-endoplasmic reticulum Ca2+-ATPase (SERCA) on the endoplasmic reticulum (ER)] (Brough et al., 2005; Mironov, 2006, 2007).
In contrast, nothing is known about regulation of mitochondrial motility at nodes of Ranvier during excitation. This issue is of particular interest for two reasons. First, the marked difference in excitation mechanism between a synapse (Ca2+ influx mediated by neurotransmitters) and a node (Na influx mediated by voltage) suggests that in a node, Na rather than Ca might be the key signal for regulation of mitochondrial motility. A node of Ranvier is uniquely adapted for Na signaling: it has a very high Na channel density (Chiu, 1980) and a very small cytosolic volume that produces robust intracellular Na signaling that in principle can be coupled to mitochondrial motility. Could this coupling be mediated by Na-pump activation and local ATP depletion? Second, direct Ca-mediated stoppage of mitochondria is possible at a node of Ranvier. Recent studies have demonstrated axonal calcium signaling mediated by neurotransmitter (Sun and Chiu, 1999; Zhang et al., 2004) and voltage (Zhang et al., 2006). However, no study has yet definitively resolved Ca signaling at a node of Ranvier.
This study reports two important findings. First, we successfully resolved calcium signaling at a node of Ranvier during action potentials. Second, we discovered a novel form of signaling for the Ca/Na-pump/mitochondria tripartite: during nerve impulses, Ca elevation and Na-pump activation retard mitochondrial motility at a node, possibly in a highly synergistic manner.
Materials and Methods
Animals.
Sciatic nerves from male adult frogs (Xenopus laevis) were used. Experiments were performed at room temperature.
Imaging of axonal calcium.
Sciatic nerves were dissected from frogs, desheathed, and the axons selectively loaded with a membrane-impermeant calcium dye following a published work from our laboratory (Zhang et al., 2006). We used the cell-impermeant, high-affinity Oregon Green 488 BAPTA-1 [OGB-1; K d = 170 nm; molecular weight (MW), 1114] conjugated to the high molecular weight Dextran (MW, 10,000; Invitrogen). Briefly, the dye was introduced into the axonal cylinders by diffusion and/or axonal transport using a tight suction pipette (containing 1–5 mm of dye in 120 mm KCl titrated to pH 7.3) applied to one cut end of the nerve. The other end was used for stimulation with bipolar electrodes. Experiments typically began after 3–4 h of dye loading. We typically performed calcium imaging at a site at least 1 cm away from the dye-loading pipette. The dyes were allowed to remain in the loading pipette (which also served as the recording pipette) during the entire experiment. Calcium levels were not reported in absolute levels but as ΔF/F 0, where F 0 is the baseline fluorescence signal.
Calcium images were viewed with a 60× (Olympus) objective lens coupled to a Yogokawa spinning disc system. OGB-1 was used at a concentration of 1–5 mm in the loading pipette; the actual axonal dye concentration at the optical recording site was estimated previously (Verbny et al., 2002) to be ∼1.3% of the dye concentration at the loading pipette, which would have an upper range of ∼65 μm. The dyes were excited by an argon laser at 488 nm, and confocal fluorescence signals were collected through a 500 nm long-pass emission filter. Images of myelinated axons with visible nodes of Ranvier were selected, and calcium images were streamed at a rate of 40 ms between frames. Image acquisition and on-line calculations were controlled through MetaMorph software (Universal Imaging).
Imaging of mitochondrial motility.
Frogs were anesthetized by submersion in water containing ethyl 3-aminobenzoate methanesulfonate (20 g/L water) for 10–15 min. The skin was cut, and the sciatic nerve was exposed near the sciatic notch (the site where the nerve exits the spinal cord). A sharp glass micropipette, mounted to a holder and controlled by a fine three-dimensional manipulator, was used to locally inject MitoTracker Green into the sciatic nerve. The injection pipette contained 0.5 mm MitoTracker dissolved in dimethyl sulfoxide, and ∼2 μl was gently injected under visual guidance through a microscope at 20× magnification. The frog was allowed to recover from surgery. At 24 h after surgery, the frog was killed, and the sciatic nerves were taken out for experiments. During the 24 h, the locally injected bolus of MitoTracker was taken up by Schwann cells and axons at the injection site. However, only the axonal mitochondria and not the Schwann cell mitochondria labeled at the site of injection were transported away from the injection site. As a result, at 24 h after injection, a nerve segment ∼2–3 cm downstream from the injection site contained pure axonal MitoTracker-labeled mitochondria. The sciatic nerves (total length of about 5–6 cm) were gently dissected and mounted on a nerve chamber for image analysis of mitochondrial motility. The labeled mitochondria are visualized with the same optics for visualizing calcium dye (i.e., excited at 488 nm and MitoTracker Green confocal fluorescence signals collected through a 500 nm long-pass emission filter). Each image was integrated for 500 ms, and movies of mitochondrial motility were captured one frame every 2 s for a duration of 1–2 min. If necessary, nerves were stimulated at one end with bipolar electrode to generate compound action potentials that were measured at the other end with a suction pipette.
After an experiment, the images were subjected to motility analysis by generating kymographs using ImageJ (NIH). From these kymographs, several motility parameters [number of mobile mitochondria (N), velocity (V), and pause duration (P)] were extracted for quantitative analysis. These parameters and their extraction criteria are described in Results.
We are aware that there are transgenic mice with genetically labeled mitochondria that would facilitate mitochondrial motility studies. However, we have no access to these mice. On the other hand, there are good reasons for selecting frog (Xenopus) for these studies. First, frog sciatic nerves are robust and allow long-term measurement of stable mitochondrial motility. Second, historically, the pioneering works on mitochondrial motility in myelinated axons were all done in frog (Cooper and Smith, 1974). Our work extends these earlier studies and provides major new information about mitochondrial dynamics.
Electrophysiology.
In both calcium-imaging and mitochondrial motility studies, compound action potentials were evoked by a 125% supramaximal stimulus applied via a bipolar electrode to one cut end, and recorded at the other cut end through another suction electrode. The amplitude of the compound action potential (CAP) data was analyzed using pClamp 6.0 software (Molecular Devices).
Solutions and drugs.
Sciatic nerves were normally bathed in a frog Ringer's solution containing the following (in mm): 100 NaCl, 3 KCl, 2 CaCl2, 1 MgSO4, 3 HEPES, 20 NaHCO3, 10 glucose, 2.5 sodium pyruvate, and 2.5 malic acid. All solutions were rigorously oxygenated with 95% O2 and 5% CO2. Calcium-free solutions were prepared by replacing Ca2+ with Mg2+ to keep the external divalent cation concentration constant, and by adding EGTA (1 mm); pH was adjusted to 7.4 with NaOH or HCl as necessary. For the Na-free solution, NaCl was replaced by LiCl (100 mm), and NaHCO3 was replaced by choline bicarbonate (20 mm). OGB-1 and MitoTracker Green were purchased from Invitrogen. All other chemicals were from Sigma. All dye-loading and calcium-imaging experiments were done at room temperature (20–22°C).
Results
The Results section has two parts. In part one, we describe how we resolved calcium signaling in single nodes of Ranvier and briefly examine the mechanism for calcium signaling. In part two, we focus on mitochondrial motility and examine how nodal Ca and other factors regulate mitochondrial movement during nerve impulses.
Action potentials evoked localized axonal Ca rise at nodes of Ranvier
Before examining roles of calcium in mitochondrial motility, we need to first examine whether there is activity-dependent elevation of axonal calcium at a node of Ranvier. The issue of Ca signaling at a node has not been settled, despite recent advances in imaging axonal Ca in myelinated nerves (Sun and Chiu, 1999; Verbny et al., 2002; Zhang et al., 2006). We have now successfully addressed this issue in frog nodes. Figure 1 A (left) shows nodal calcium elevation triggered by a brief train of action potentials (4 s at 25 Hz). Time-lapsed fluorescence images were collected from a myelinated single axon in an unteased sciatic nerve bundle. Cytosolic calcium was reported by introducing cell-impermeant, Dextran-conjugated Oregon Green BAPTA-1 selectively into axon cylinders through cut ends. Many axons were labeled, from which only one was selected for study. Single node of Ranvier was easily identified through light microscopy (Fig. 1 A, top). The key observation is that the evoked axonal calcium elevation was highly localized to the node, spreading only by ∼20 μm into internodes of ∼2000 μm in an adult frog. To see if the Ca spread into the internodes could be augmented by stronger stimulation, we either increased the frequency of stimulation (Fig. 1 B–D) or prolonged the duration of stimulation from 1 to 2 min (Fig. 1 E). Both procedures failed to enlarge the spatial spread of the nodal Ca response, suggesting a strong buffering mechanism that prevents the spread of calcium into the internodes. This localized nodal response in the PNS myelinated axons stands in striking contrast to CNS myelinated axons where the evoked Ca response is spatially uniform (Zhang et al., 2006). We next examined the mechanisms underlying the nodal calcium response.
Figure 1.
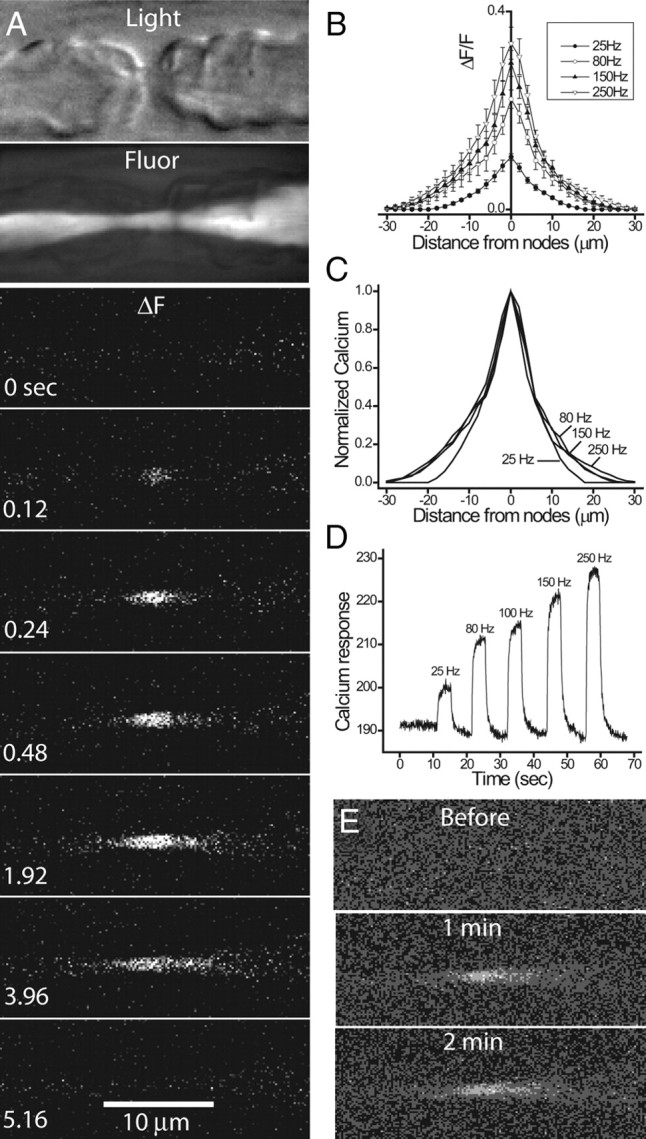
Action potentials trigger localized Ca rise at nodes of Ranvier in frog myelinated axons. A, Time-lapsed Ca fluorescent images showing nodal Ca response evoked by repetitive action potentials (4 s at 25 Hz). The top two images are light microscopic and fluorescent images, respectively, of a single node with adjacent paranodes. The fluorescent image shows that only the axon cylinder is labeled with the cell-impermeant calcium dye OGB-1. The rest of the images show fluorescent-subtracted images (ΔF) from the control (time, 0 s) at various times during and after stimulation. The stimulation was turned off at 4 s. The evoked Ca response centers at the node and spreads to no more than ±20 μm into the two paranodes. B, C, Spatial distribution of evoked Ca response. The node is positioned at 0. The frequency of stimulation was increased from 25 to 250 Hz at a fixed duration of 4 s. The amplitude of evoked Ca response increased with stimulation frequency (B), but the spatial spread into the paranodes (C; normalized with respect to the peak) remained unaffected (N = 5). D, Temporal response of nodal Ca signal evoked by increasing stimulation frequency. E, Nodal Ca responses remain localized even at prolonged stimulation. Fluorescent-subtracted images (from control) at 1 and 2 min of continuous stimulation at 200 Hz.
Calcium-free bath solutions and calcium channel blockers
To examine whether calcium influx underlies the evoked calcium transient, we eliminated extracellular calcium from the bath solutions (2 mm Ca replaced by Mg, with 1 mm EGTA added). Figure 2 A shows that 15 min of Ca-free bath solution reversibly blocked the evoked calcium response without affecting the single CAP (shown on top with a different time scale). In some experiments (as in this one), there was a fall in the resting Ca fluorescence, suggesting a fall in resting cytosolic calcium during Ca-free solution application.
Figure 2.
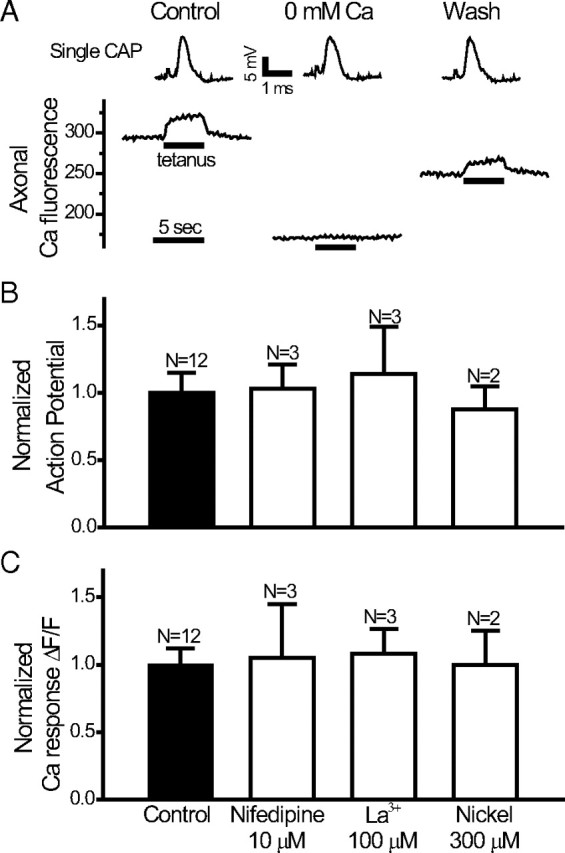
Effects of calcium-free solutions and Ca channel blockers on the evoked nodal Ca response. A, Top, Single CAPs in response to Ca-free solutions. Bottom, Axonal Ca fluorescence during a tetanus (25 Hz, 4 s) before and after Ca-free bath solutions. Note the difference in time scale between top and bottom. B, Normalized compound action potential amplitude in the presence of various Ca channel blockers. C, Corresponding evoked Ca responses in the presence of various Ca channel blockers. Error bars indicate SEM.
To examine possible contribution of voltage-gated calcium channels, we applied two wide spectrum blockers of voltage-gated calcium channels, La3+ (100 μm; one of the most potent blockers with K d near the 1–2 μm range) and Ni2+ (300 μm). Neither the compound action potentials (Fig. 2 B) nor the evoked Ca response (Fig. 2 C) were affected by these two blockers. The L-type calcium channel blocker nifedipine (10 μm) was also without effects on the evoked Ca response (Fig. 2 C). The calcium-free studies suggest that evoked Ca response was mediated by calcium influx, but the negative results of the wide-spectrum Ca channel blockers suggest that novel influx pathway may be involved.
Mitochondrial blockers
To examine possible contribution of mitochondria to the evoked calcium response, we applied various agents to block mitochondrial functions. First, we blocked mitochondrial function with protonophore carbonyl cyanide p-trifluoromethoxyphenylhydrazone (FCCP), which dissipates the proton gradient and should lead to emptying of mitochondrial calcium. Figure 3 A shows that FCCP (15 min application) inhibits the evoked calcium response without affecting the compound action potentials. The inhibition of the calcium response is not the result of blocking ATP production, since selectively blocking mitochondrial ATPase with oligomycin did not block the calcium response (Fig. 3 B). Furthermore, the inhibition of the calcium response by FCCP was unaffected when oligomycin was coapplied (Fig. 3 B). Second, we bath applied 7-chloro-5-(2- chlorophenyl)-1,5-dihydro-4,1-benzothiazepin-2(3H)-one [CGP-37157 (CGP)] to block calcium release from the mitochondrial Na/Ca exchanger (Cox et al., 1993; Baron and Thayer, 1997; David, 1999; Yang et al., 2003). CGP (10–50 μm) blocks the evoked calcium response without affecting the compound action potentials (Fig. 3 C,D), and the CGP effect was partially reversible after extended wash (Fig. 3 C). CGP is known to block L-type calcium channels. However, nifedipine is without effect on the evoked Ca response (Fig. 2 C). Hence, CGP appears to block nodal Ca response by blocking mitochondrial calcium release. Collectively, the effects of FCCP (which empties mitochondria of calcium) and CGP (blocking mitochondrial Ca release) suggest that mitochondrial calcium release contributes to the evoked calcium response. Although the calcium-free studies (Fig. 2 A) suggest an influx component, it is possible that the results of the calcium-free studies reflect a rapid depletion of mitochondrial calcium by calcium-free bath solutions (Pitter et al., 2002).
Figure 3.

Effects of FCCP and CGP on compound action potential and evoked nodal Ca response. A, FCCP (10 μm, 15 min) blocks the evoked Ca response (bottom) but not the compound action potential (top). B, Averaged results for various blockers of the electron chain complex (antimycin, 20 μm; FCCP, 10 μm) and the mitochondrial ATPase (oligomycin, 10 μm). Note that all compounds tested (15 min) did not affect the compound action potentials (top). C, CGP (50 μm, 30 min) blocks the evoked nodal Ca response. The effect is reversible after extended wash (50 min). D, Averaged results for CGP at 10 μm. CGP blocks evoked Ca response (right) without affecting the compound action potential (left). Error bars indicate SEM.
ER blockers
To assess the role of ER, we emptied ER calcium by blocking the calcium pump (SERCA) on the ER with 2 μm thapsigargin (Thastrup et al., 1990). Thapsigargin treatment (15 min) blocked the nodal calcium response without affecting the compound action potentials (data not shown). This suggests a direct contribution of the ER to the calcium response. Alternatively, thapsigargin may have indirect effects on mitochondrial function resulting from prolonged ER blockage (Hom et al., 2007).
To summarize the first part of this paper, using a method of selective labeling of axons with Ca dyes, we have decisively localized activity-dependent Ca signaling to the node of Ranvier in frog myelinated axons. The mechanism for the calcium response appears complex, and likely involves contributions from both influx and release from intracellular organelles such as mitochondria.
We now move to the second major part of this study in which we will examine the role of evoked Ca response and other factors in regulating nodal mitochondrial motility during action potentials. We launched a new series of studies in which calcium dyes were not involved, but in which we instead focused on monitoring mitochondrial motility with MitoTracker Green.
Real-time analysis of mitochondrial motility in myelinated axons
MitoTracker Green was injected locally into sciatic nerves near the sciatic notch of anesthetized frogs, and the nerves were taken for experiments 24 h after injection. The nerves were gently desheathed but remained unteased, and were cut to about 5–6 cm long. Studies of axonal mitochondrial motility were performed in the middle of a nerve bundle, about 2 cm downstream from the site of injection. Confocal image analysis was performed on single myelinated axons located near the surface of the nerve bundle. Figure 4 A shows a still frame of a MitoTracker-labeled myelinated axon from a movie used to visualize mitochondrial motility (supplemental Movie 1, available at www.jneurosci.org as supplemental material). The node is located near the middle where the axon is constricted. Axonal mitochondria can be seen moving in anterograde (the majority) and retrograde directions at a velocity of 0.2–2.0 μm/s. Mitochondrial movements in single axons persist undiminished for at least 2 h. We restricted our analysis to changes in mitochondrial motility induced by various experimental conditions over a brief period of 1–10 min. In all studies, only one node per nerve bundle was used for each experiment.
Figure 4.

Kymographs of mitochondrial motility. A, Still fluorescent image of MitoTracker-labeled mitochondria in the axon of a single myelinated fiber. The node is near the center where the axon shows a conspicuous constriction (supplemental Movie 1, available at www.jneurosci.org as supplemental material). B, C, Representative kymographs showing anterograde movement (positive slope), retrograde movement (negative slope), and pauses (between white arrowheads). The schematic drawing of myelinated axon applies to B and C. Note the position of the node and the flanking paranodes (PN) and juxtaparanode (JPN).
Motility analysis for mitochondria was performed by plotting kymographs using ImageJ (NIH). Motility analysis was restricted to an axonal length of 10 μm with the node in the middle. Figure 4, B and C, shows representative kymographs from a narrow slice parallel to the axis of the axon. Each slice is 0.69 μm thick and is oriented longitudinally through the node. In our presentation of kymographs, the vertical axis is the distance along a slice, and the horizontal axis is the time. A schematic of a myelinated axon is shown on the left of Figure 4 B to show the location of the node. Movements of mitochondria along a longitudinal slice produce a trajectory consisting typically of a straight line with either a positive slope (anterograde movement) or negative slope (retrograde movement). Mitochondria rarely moved along the entire 10 μm length of a kymograph slice (only 0.69 μm thick) during the observation period. Frequently, mitochondria moved for a short distance along a particular kymograph slice, then were picked up again as they moved into an adjacent kymograph slice. Sometimes, mitochondrial movement (in both directions) shows momentary pauses, as indicated by the pair of white arrows (Fig. 4 B,C). Stationary mitochondria are represented by a horizontal line. From these kymographs, we extracted three major parameters for study: number of mobile mitochondria (N), velocity of mobile mitochondria (V), and pause duration (P).
Number of mobile mitochondria
We determined the total number of mitochondria moving through a node during a fixed period (typically 1 or 2 min). To obtain this number, we produced a series of adjacently spaced kymographs (fixed at 14 slices; i.e., a total of 9.66 μm) that covered the entire node. By comparing adjacent kymographs, we followed the movement of the same mitochondria as they moved through different slices and distinguished them from new mitochondria that moved into the view at later times. This number, N, remains the same as the same mitochondria are followed through adjacent kymographs, and N is increased accordingly when adjacent kymographs revealed new mitochondria that moved into the viewing area. It is important to emphasize that we currently did not have enough resolution to resolve a single mitochondrion. Thus, each trajectory could either be a single mitochondrion or a single mitochondrial mass composed of several mitochondria moving together as a unit. Throughout this paper, we will refer to N as the number of mobile mitochondria, with the understanding that it is actually a measure of the number of different, discrete mitochondrial masses that are mobile under different experimental conditions.
Velocity of mobile mitochondria
From the slope of the movement trajectory in the kymographs, we determined the velocity of each discrete mobile mitochondrial mass for both anterograde and retrograde directions. Velocity for a given mitochondrial mass was taken from a particular kymograph showing a long trajectory, ignoring minor changes than might have occurred for the same mitochondrial mass as it moved through other kymographs.
Pause duration
We simply surveyed all kymograph sections for a given node and measured all different pause durations, regardless of movement directions and whether the pauses came from the same or from different mitochondria.
It is critical to eliminate bias in the analysis. To this end, all data (N, V, and P) in this paper were analyzed by one or two of us completely blinded to the conditions of the experiment. Furthermore, to confirm the reliability of the kymography analysis regarding N, we randomly selected several experiments and used a simple visual count of mobile mitochondria through a node by viewing repeated replay of the same movie. This visual count of N corroborates with N determined from the kymographs. The following kymographic results were from a total of 1544 mitochondria from 72 nodes.
Number of mobile mitochondria was reduced during repetitive action potentials
Figure 5 shows that the number of mobile mitochondria was reduced during stimulation (1 or 2 min; 200 Hz). The number of mobile mitochondria was counted during the stimulation period (1 or 2 min) and compared with the number counted for the same period in the same node immediately before stimulation. During stimulation, the number of mobile mitochondria was reduced to 66% (1 min) and 69% (2 min) for anterograde movement (Fig. 5 A), and to 69% (1 min) and 65% (2 min) for retrograde movement (Fig. 5 B). Recovery from stimulation was measured from the same node under quiescent conditions 5 min after stimulation. For anterograde movement, N recovered from 65% to 92% after 1 min stimulations, and from 69% to 80% after 2 min stimulations (data not shown). Interestingly, no recovery was seen for retrograde movement, at least at 5 min after stimulation. Our choice of 1–2 min stimulation at 200 Hz is within the operating range of peripheral nerves in previous studies [e.g., 60 min, intermittent stimulation at 50–200 Hz in metabolic studies (Connelly, 1959); 30 min at 90 Hz continuous stimulation in intact animals (Mima et al., 2004)].
Figure 5.
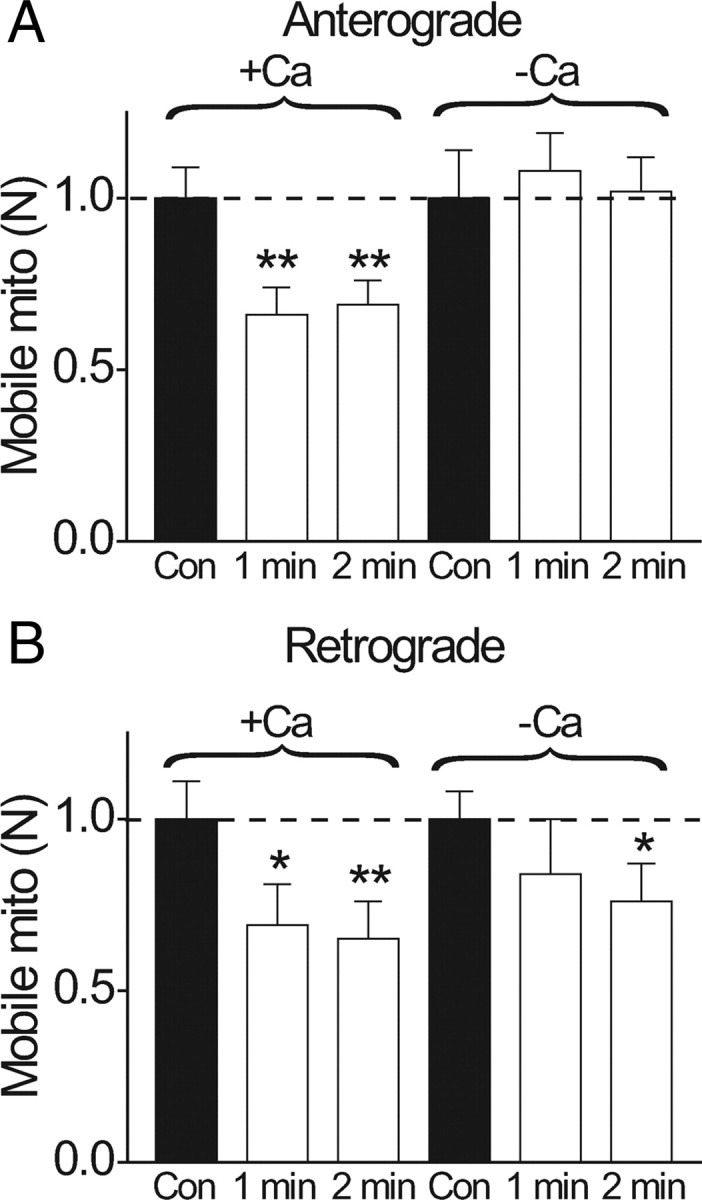
Activity-dependent reduction in number of mobile mitochondria is calcium-dependent. Relative changes in the number of mobile mitochondria (N) before and during repetitive stimulation (1 or 2 min; 200 Hz). A, Anterograde direction. B, Retrograde direction. In each experiment, the control consisted of counting N for 1 or 2 min before stimulation. Stimulation was immediately applied (200 Hz), and N was counted during stimulation in the same axon for the same time interval as in control (1 or 2 min). Each nerve was stimulated only once. The graph shows the relative change in N during stimulation compared to the control. In normal Ringer's solution, experiments were performed in 8 nodes for 1 min stimulations and 16 nodes in 2 min stimulations. In Ca-free conditions, the nerve was bathed in Ca-free solutions for 15 min before the experiment began. Notice that stimulation reduces anterograde N to 66% (1 min; N = 8 nodes) and 69% (2 min; N = 16 nodes), and retrograde N to 69% (1 min) and 65% (2 min). This activity-dependent reduction of N was completely abolished in Ca-free solutions for anterograde movement (A), which was slightly increased by 8% (1 min) and 2% (2 min) compared to prestimulation values. For the retrograde movement (B), there was a statistically significant reduction for 2 min stimulation (N reduced to 76%). *p < 0.05; **p < 0.01. Error bars indicate SEM.
Activity-dependent reduction in N was Ca dependent
To examine whether the reduction in N during action potentials was caused by the evoked Ca increase, we performed stimulations in Ca-free solutions. We began experiments 15 min after perfusing the bath with a Ca-free solution, at which time the evoked calcium response was abolished (Fig. 2 A). This completely prevented action potentials from reducing N for the anterograde direction (Fig. 5 A). Interestingly, some activity-dependent reduction of N in the retrograde direction still persisted in Ca-free conditions (Fig. 5 B).
Activity-dependent modulation of velocity and pause duration
Is the effect of action potential restricted only to reducing N? Do action potentials modulate dynamics (V and P) of mobile mitochondria? To examine this, we analyzed V and P of mobile mitochondria during repetitive action potentials. Figure 6, A and B, shows that there is an activity-dependent reduction of velocity in normal Ringer's solution that becomes statistically significant during 2 min stimulations. Thus, during 2 min stimulations, the velocity is reduced to 73% of control for anterograde movement (from 0.73 ± 0.02 μm/s to 0.53 ± 0.01 μm/s; N = 16 nodes) and to 82% of control for retrograde movement (from 0.69 ± 0.027 μm/s to 0.57 ± 0.026 μm/s; N = 16 nodes). Interestingly, histogram analysis shows that for anterograde movement, the activity-dependent reduction in velocity during 2 min stimulation occurs predominantly in the most rapid mitochondrial population (Fig. 6 D, asterisk). When stimulated in Ca-free solutions, activity-dependent reduction in velocity was abolished for anterograde, but not for retrograde movement (Fig. 6 B) (2 min stimulation in Ca-free solution).
Figure 6.
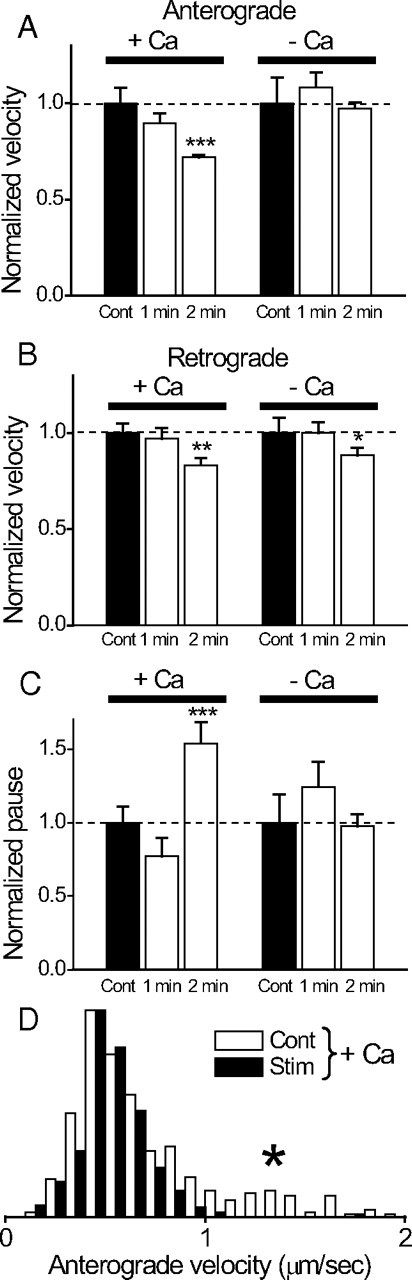
Activity-dependent changes in velocity and pause durations of mobile mitochondria are calcium dependent. The velocities and pause durations during stimulations were expressed relative to the control. Data are from the same set of nerves in Figure 5. A, Anterograde velocity. Normal Ca (+Ca), Velocity was reduced by 10% (from 0.51 ± 0.042 μm/s to 0.45 ± 0.026 μm/s; N = 8 nodes) during 1 min stimulation, and by 27% (from 0.73 ± 0.02 μm/s to 0.53 ± 0.01 μm/s; N = 16 nodes) during 2 min stimulation. Ca free (−Ca), Velocity was reduced by 9% (from 0.45 ± 0.03 μm/s to 0.49 ± 0.035 μm/s; N = 8 nodes) during 1 min stimulation, and by 3% (from 0.54 ± 0.02 μm/s to 0.52 ± 0.02 μm/s; N = 8 nodes) during 2 min stimulation. B, Retrograde velocity. Normal Ca, Velocity was reduced by 4% (from 0.46 ± 0.026 μm/s to 0.46 ± 0.02 μm/s) during 1 min stimulation, and by 18% (from 0.69 ± 0.027 μm/s to 0.57 ± 0.026 μm/s) during 2 min stimulation. Ca free, There was no change in velocity (from 0.46 ± 0.03 μm/s to 0.46 ± 0.026 μm/s) during 1 min stimulation, and velocity was reduced by 11% (from 0.54 ± 0.024 μm/s to 0.48 ± 0.02 μm/s) during 2 min stimulation. Numbers of the node are the same as in A. C, Pause duration. Normal Ca, Pause duration was reduced by 23% (from 16.6 ± 2.8 s to 12.8 ± 2.1 s) during 1 min stimulation and increased by 54% (from 12.3 ± 0.9 s to 18.9 ± 1.8 s) during 2 min stimulation. Only the increase in 2 min stimulation is statistically significant. Ca free, Pause duration increased by 24% (from 12.6 ± 2.3 s to 15.7 ± 2.6 s) during 1 min stimulation and was reduced by 2% (from 16.9 ± 2.4 s to 16.5 ± 1.4 s) during 2 min stimulation. Neither change is statistically significant. Numbers of nodes are the same as in A. *p < 0.05; **p < 0.01; ***p < 0.005. D, Histogram of anterograde velocity shows that the mitochondrial population with the most rapid velocity (asterisk) is preferentially reduced by 2 min stimulation (N = 8 nodes) in normal Ringer's solution. The histogram is plotted as a probability density function (normalized so that the area is 1) to facilitate comparison of the shapes of the two distributions. Error bars indicate SEM.
In addition to reduction in mitochondrial velocity, stimulation also leads to an increase in pause duration for mitochondrial movement through a node. Figure 6 C shows that the pause duration of mitochondrial movement was increased by ∼54% (from control of 12.3 ± 0.9 s to 18.9 ± 1.8 s; N = 16 nodes; p < 0.005) during a 2 min stimulation. There is no statistically significant increase in pause duration when nerves were stimulated in Ca-free solutions (Fig. 6 C).
Collectively, the results of Figures 5 and 6 demonstrate that repetitive action potentials retard mitochondrial motility through a node by three means: reduction of number of mobile mitochondria, reduction in velocity, and increase in pause duration. This effect is Ca dependent, particularly in the anterograde direction.
Ca ionophore
To directly examine the effect of raising cytosolic Ca on mitochondrial motility, we raised the bath Ca from 0 to 15 mm after permeabilizing the plasma membrane with a Ca ionophore (10 μm ionomycin). Furthermore, we coapplied 2 μm thapsigargin to block Ca uptake into the ER (by blocking the ATP using Ca pump SERCA) as cytosolic Ca is raised. The rationale is that ER calcium uptake might cause a local ATP depletion near mitochondria, which will de-energize the motors and reduce mitochondrial movement unrelated to a direct effect of Ca on the movement. Blocking ER calcium uptake with thapsigargin will thus reveal any direct effect of calcium on mitochondrial motility. Figure 7 A shows that Ca ionophore (labeled Iono) dramatically reduces N to 29% (anterograde) and 20% (retrograde) of control values. There was no significant effect on the velocity (Fig. 7 B) and pause duration (Fig. 7 C). This inhibitory effect of Ca ionophore on N is partially reversible: switching the bath from 15 to 0 mm Ca (in the presence of Ca ionophore) restores N to 70% and 55%, respectively, for anterograde and retrograde directions (data not shown). The absolute cytosolic Ca elevation was not measured in these studies, but it is most certainly higher than that achieved during action potential stimulations.
Figure 7.
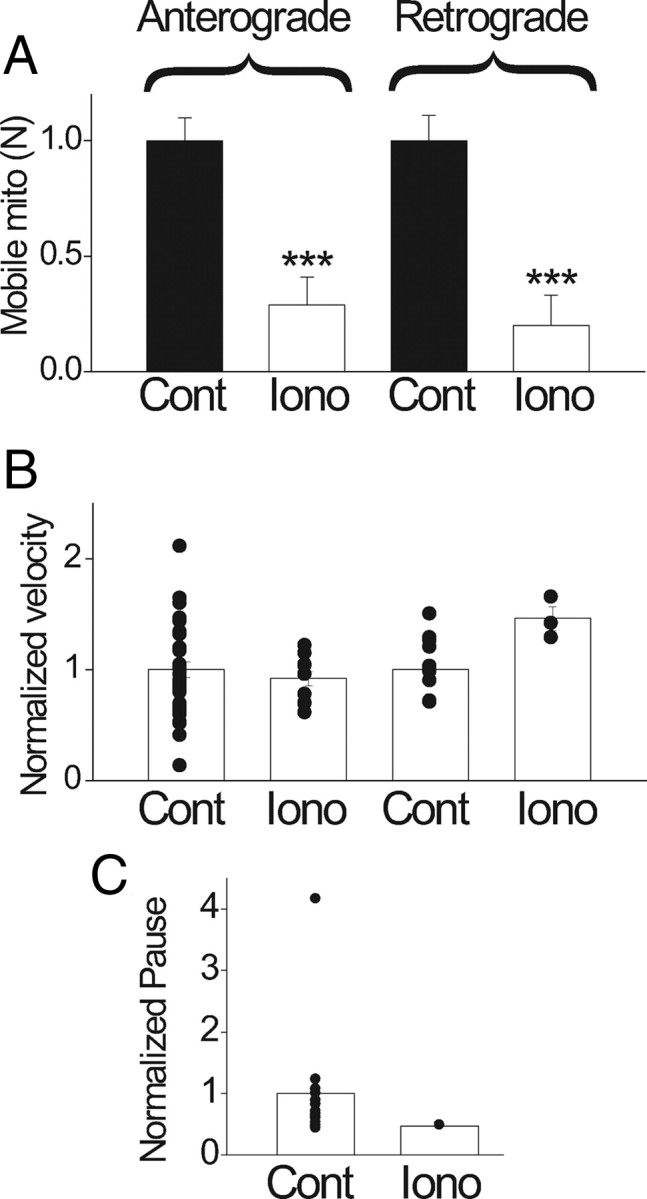
Effects of Ca ionophore on mitochondrial movement. Bath application of Ca ionophore ionomycin (10 μm) was used to raise cytosolic Ca. Control, Zero Ca plus ionomycin for 15 min. Iono, Fifteen minutes after switching from control to high Ca (15 mm Ca plus ionomycin). A, Number of mobile mitochondria decreased by 71% and 80%, respectively, in anterograde and retrograde directions (N = 6 nodes) from 0 to high calcium. B, Velocity was reduced by 9% in anterograde (from 0.416 ± 0.03 μm/s to 0.38 ± 0.03 μm/s; p > 0.05) and increased by 47% in retrograde (from 0.44 ± 0.03 μm/s to 0.65 ± 0.05 μm/s; p > 0.05). C, Pause duration was reduced by 50% (from 14.78 ± 3.5 s to 7.36 ± 0.0 s; p < 0.01). Changes in B and C are not considered significant because of the small number of mobile mitochondria in high Ca (Iono). ***p < 0.005. Error bars indicate SEM.
Blocking Na/K-ATPase blocks activity-dependent retardation of mitochondria
To examine whether activation of Na/K-ATPase plays a role in regulation of mitochondrial motility, we blocked the Na/K-ATPase with ouabain or lithium (Gordon et al., 1990) during action potentials. Nerves were incubated in a calcium-containing Ringer's solution with ouabain (0.5 mm) or with Na replaced by Li for 15 min before the experiments began. Ouabain (0.5 mm) and Li (which is permeable through Na channels) did not affect the compound action potentials and only have minor effects on the resting mobility of mitochondria before stimulation (resting N values are 89% and 108% of control for anterograde and retrograde movements in lithium, respectively, and 96% and 120% of the control for anterograde and retrograde movements in ouabain, respectively). Strikingly, activity-dependent retardation of mitochondria was completely abolished by Na-pump blockers during 2 min stimulations. Figure 8 shows that in lithium or ouabain, action potentials failed to reduce the number of mobile mitochondria for anterograde (A) and retrograde (B) directions (2 min stimulation data in normal Ringer's solution is shown for comparison). Furthermore, activity-dependent reduction in velocities (Fig. 9 A,B) and prolongation of pause duration (C) were also mostly abolished when the Na pumps were blocked. These studies suggest that activation of Na/K-ATPase during nerve activity retards mitochondrial motility.
Figure 8.
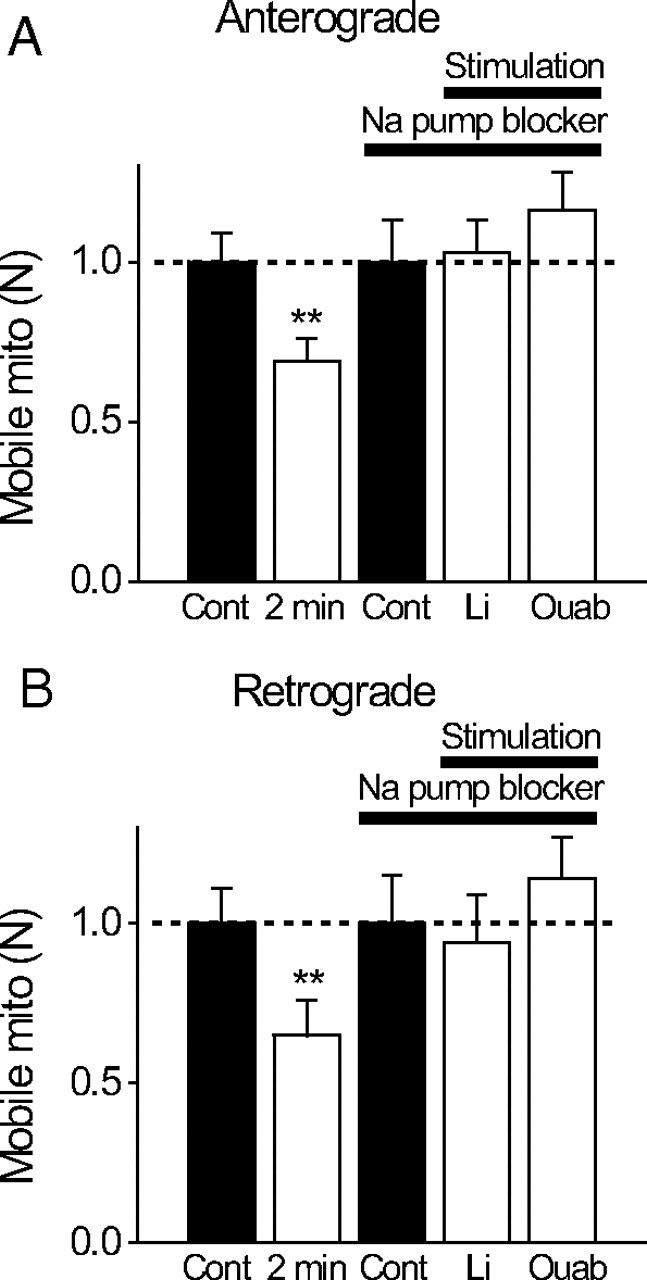
A, B, Activity-dependent reduction in number of mobile mitochondria is Na/K-ATPase dependent. Relative changes in the number of mobile mitochondria before [control (Cont)] and during repetitive stimulation (2 min; 200 Hz). Nerves were stimulated either in normal Ringer's solution or in two modified Ringer's solutions designed to block Na/K-ATPase but preserve action potentials [lithium replacing all bath Na (N = 6 nodes) or 0.5 mm ouabain (Ouab) in Ringer's solution (N = 6 nodes)]. Note that blocking Na/K-ATPase completely blocks activity-dependent reduction in the number of mobile mitochondria. **p < 0.01. Error bars indicate SEM.
Figure 9.

A–C, Activity-dependent changes in velocity and pause durations of mobile mitochondria is Na/K-ATPase dependent. Relative changes in these parameters before (Cont) and during stimulation (2 min; 200 Hz) in either normal or modified Ringer's solution [Li, N = 6; 0.5 mm ouabain (Ouab), N = 6] in which Na/K-ATPase was blocked but action potentials preserved. Note that blocking Na/K-ATPase in most cases blocked activity-dependent changes in velocity and pause durations, except in the case of retrograde movement in lithium. **p < 0.01; ***p < 0.005. Error bars indicate SEM.
Artificial stimulation of Na/K-ATPase retards mitochondrial motility
To directly confirm that activation of Na/K-ATPase retards mitochondrial motility, we artificially stimulated the Na/K-ATPase by bath application of a Ca-free mixture containing 10 μm veratridine (a sodium channel opener to elevate intracellular Na) and elevated extracellular K (from 3 to 20 mm). The Ca-free condition is important to ensure that any effects on mitochondrial motility produced by this mixture cannot be ascribed to calcium. This mixture dramatically reduced the number of mobile mitochondria to 19% and 12% of control values for the anterograde and retrograde directions, respectively (Fig. 10 A), without significantly affecting the velocities (B) and the pause duration (C). To verify that mitochondrial immobilization is caused by Na/K-ATPase activation, we blocked the Na/K-ATPase with ouabain (0.5 mm) during the mixture application. Ouabain dramatically prevented the mixture from reducing the number of mobile mitochondria (Fig. 10 A), proving that the mitochondrial immobilization is caused by Na/K-ATPase activation.
Figure 10.
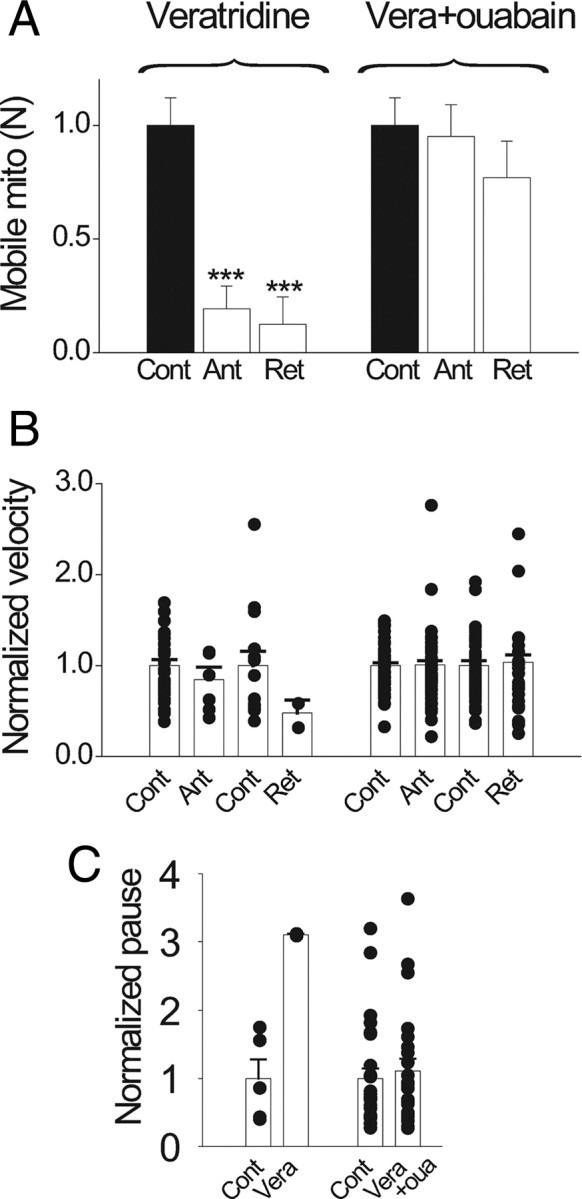
Artificial activation of Na/K-ATPase blocks mitochondrial movement. Nerves were incubated in a Ca-free solution for 15 min before switching to a Ca-free bath mixture designed to artificially active Na/K-ATPase [intracellular Na raised by 10 μm veratridine (Vera); extracellular K raised from 3 to 20 mm]. Plots show results relative to the control in the Na/K-ATPase-activating mixture. A, Artificial activation of Na/K-ATPase dramatically reduced the number of mobile mitochondria by 81% in anterograde (Ant) and 88% in retrograde (Ret; N = 6 nodes). This reduction was mostly prevented by ouabain (oua; 0.5 mm) coapplication (N = 6 nodes). ***p < 0.005. B, C, Activation of Na/K-ATPase had no significant effect on the velocity and pause durations. Error bars indicate SEM.
The effect of manipulation of Na pumps on mitochondrial motility is not attributable to secondary effects on intra-axonal Ca
Given the strength of direct molecular evidence for regulation of mitochondrial motility through elevated Ca, an important issue is whether pharmacological manipulation of Na pumps (ouabain, lithium, and veratridine) affects mitochondrial motility because of secondary effects on intra-axonal Ca. We therefore examined possible effects of these Na-pump modifiers on intra-axonal Ca at the node of Ranvier. First, we examined the effects of ouabain and lithium on the intra-axonal Ca response evoked by action potentials at different stimulation frequencies. Frequency dependence of the evoked Ca response was measured for each drug according to the paradigm of Figure 1 D. A control was first measured in normal Ringer's solution, followed by a measurement after 15 min of drug treatment in the same fiber. The result was expressed relative to the maximal response (200 Hz) in the control Ringer's solution for each respective drug. The results (Fig. 11) show that ouabain (A) and lithium (B) produced no significant change in the frequency dependence of evoked intra-axonal Ca response at the node. These frequency-dependence curves were generated with brief pulses. Figure 11 C shows that for long-duration pulses (2 min) there is no change in the shape of the evoked Ca response in the presence of ouabain or lithium. Second, we examined veratridine. In the motility experiments of Figure 10, we used veratridine to artificially activate the Na pumps in Ca-free solutions to show that Na-pump activation led to retardation of mitochondrial motility independent of intra-axonal Ca elevation. However, it remains possible that veratridine can still cause intracellular Ca release from mitochondria or ER under Ca-free conditions. We therefore directly measured intra-axonal Ca during veratridine treatment, in normal and in Ca-free bath solutions. In normal solutions (Ca present in the bath), veratridine caused the expected elevation in intra-axonal Ca (Fig. 11 D). However, veratridine no longer caused elevation in intra-axonal Ca when applied in Ca-free bath solutions (Fig. 11 D,E). This demonstrates that the retardation in mitochondrial motility induced by veratridine in Ca-free solutions (Fig. 10) cannot be explained by intra-axonal Ca elevation. Collectively, Figure 11 shows that the effects of Na pump manipulation on mitochondrial motility in Figures 8 –10 cannot be explained by secondary effects on intra-axonal Ca.
Figure 11.
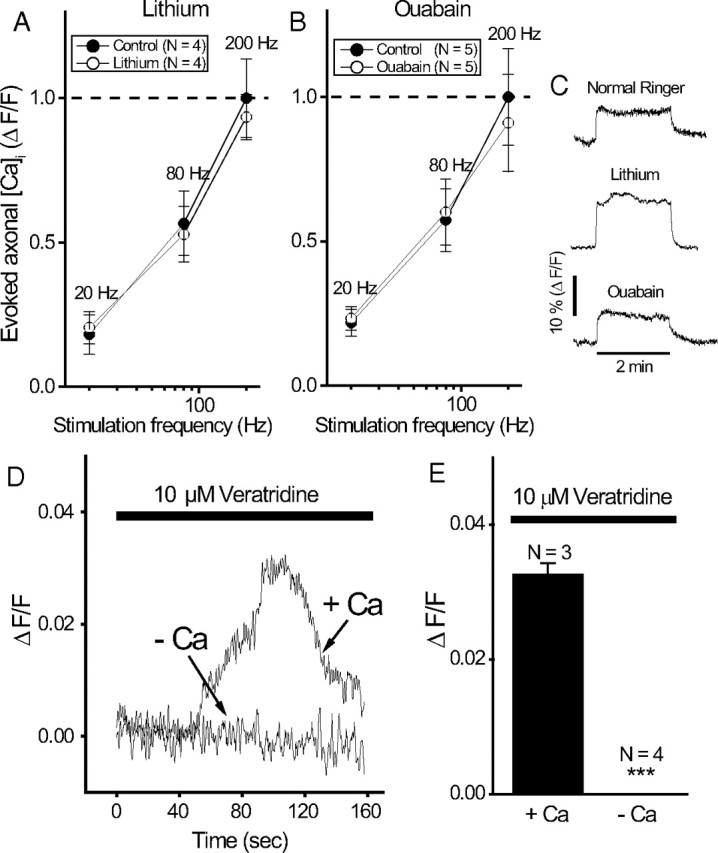
Manipulation of Na/K-ATPase does not cause secondary changes in intra-axonal Ca. A, B, Frequency dependence of evoked Ca axonal response in ouabain (A) and lithium (B). In each panel, the frequency dependence was first measured in the control (i.e., normal Ringer's solution), then measured again after 15 min of drug application in the same fiber. The evoked Ca responses were normalized relative to the peak response (200 Hz) in the control. The paradigm for measurement of evoked Ca response is similar to that in Figure 1 D. The frequency dependence of evoked Ca response generated by brief pulses (4 s duration) is shown. C, Shape of evoked Ca response is similar in normal (N = 3), lithium (N = 2), and ouabain (N = 2) during prolonged stimulation (2 min duration). Representative traces are shown here. D, Effects of veratridine plus 20 mm K on intra-axonal Ca in normal Ringer's and in Ca-free bath solutions. E, Averaged results of the peak Ca response from D. ***p < 0.005. Error bars indicate SEM.
Blocking cytoskeleton systems immobilizes mitochondria
Mitochondria are thought to use both the microtubule and microfilament (actin/myosin-based transport) systems for movement. To examine the role of these two cytoskeleton systems in mitochondrial motility in myelinated axons, we compared mitochondrial motility in nerves taken from the same frog with or without a 2 h incubation with nocodazole (to disrupt the microtubule network; 50 μm; N = 6 nodes) or cytochalasin D (to disrupt the actin network; 50 μg/ml; N = 6 nodes). Both agents resulted in a significant reduction in the number of mobile mitochondria (N reduced by 66% and 83% in anterograde and retrograde directions, respectively, for nocodazole; N reduced by 32% and 71% in anterograde and retrograde directions, respectively, for cytochalasin D) without significant effects on the velocities and pause durations.
Discussion
This work produces the first spatial resolution of nodal calcium signaling and shows that activity-dependent calcium elevation retards nodal mitochondrial motility in a manner similar to that reported for synapses. In addition, we have produced the first demonstration that physiologic activation of Na pumps retards mitochondrial motility, a novel feature in mitochondrial dynamics that might be unique to the node of Ranvier.
Action potentials evoke localized Ca signaling at PNS nodes of Ranvier
Given the exquisite nodal specialization of ionic channels in myelinated nerves (Chiu and Ritchie, 1980; Poliak and Peles, 2003), the first study to examine axonal calcium signaling in CNS myelinated fibers yielded a surprise (Zhang et al., 2006). Instead of localized nodal calcium signaling, activity-evoked calcium signaling in CNS axons is spatially uniform and bears no spatial relationship to myelination. In striking contrast to the CNS, this work shows that Ca signaling in PNS myelinated axons is highly localized to the node of Ranvier. Intriguingly, this is paralleled by a marked difference in axonal mitochondrial distribution in these two fiber types. Axonal mitochondrial density is increased at the nodal region in PNS (Fabricius et al., 1993), but is uniform in nodes and internodes in the CNS (Edgar et al., 2008). Our study suggests that this differential mitochondrial distribution is caused by a marked difference in spatial Ca signaling: discrete nodal Ca signaling in the PNS recruits mitochondria to the nodal region, whereas uniform nodal and internodal Ca signaling in the CNS produces uniform mitochondrial distribution. It is tempting to speculate that internodal calcium signaling in the CNS but not the PNS makes the myelinated axons of the former more prone to excitotoxic damage than those of the latter.
Action potentials regulate mitochondrial motility
Studies of mitochondrial motility in myelinated axons began in the 1970s using light microscopy (Cooper and Smith, 1974), and recently involved sophisticated transgenic mice expressing mitochondrial markers (Misgeld et al., 2007). Despite these advances, regulation of nodal mitochondrial movement by action potentials has not been studied. Our study demonstrated that mitochondria motility is retarded by action potentials via at least two mechanisms: a calcium-dependent and an Na-pump-dependent mechanism. The calcium-dependent mechanism likely involves a direct inhibitory action of calcium on an adaptor protein that controls mitochondrial motors, as already described in the synapse (Yi et al., 2004; Saotome et al., 2008; Cai and Sheng, 2009; Macaskill et al., 2009; Wang and Schwarz, 2009). The second mechanism involving regulation by physiologic activation of the Na pump is novel. At present, the signaling pathway that couples Na-pump activation to retardation of mitochondrial motility remains unclear. One clear possibility is local ATP depletion after Na-pump activation. Alternatively, mitochondrial motors could be stopped by an increase in ADP (Mironov, 2007). Finally, we cannot rule out a yet-to-be-identified direct coupling between Na pumps and mitochondria.
Coupling between Na-pumps and mitochondrial movement may be unique for the node of Ranvier
Compared with the synapse, regulation of mitochondria motility by Na pumps might be particularly important at the node of Ranvier because of a marked difference in ionic signaling mode and unique geometry.
First, unlike the synapse where the neurotransmitter-mediated Ca influx is very high, the evoked Ca response in a node is probably much smaller. In fact, some nodes in this study barely showed a detectable Ca response. This suggests that in a node, calcium signaling alone may not be strong enough to recruit mitochondria compared to a synapse where calcium influx is large. Hence, an extra recruitment mechanism mediated by Na pumps might be needed. Second, given its high Na channel density (Chiu, 1980) and a large surface-to-volume ratio attributable to nodal constriction, the node of Ranvier is geometrically unique to allow robust intracellular Na signaling to activate Na pumps to arrest mitochondria. Repetitive nerve activity has been shown to cause significant activation of the Na/K-ATPase in myelinated axons (Gordon et al., 1990). Hence, it is tempting to generalize that any system that relies heavily on Na signaling (the node being the prime example) might use Na-pump activation, rather than calcium, to translate nerve activity to mitochondrial movement modulation.
Granted this, however, there are several intriguing issues that require additional studies.
Synergism between Ca and Na/K-ATPase?
Why should Ca-free solution and blockage of Na/K-ATPase, each by itself, be so effective in blocking activity-dependent retardation of mitochondrial motility, particularly in the anterograde direction (compare Figs. 5, 8)? One possibility is synergism. For example, Ca elevation may draw mitochondria axially toward the plasma membrane, but because of a weak calcium rise, this by itself is not sufficient to arrest the mitochondria. However, once the mitochondria are drawn near the plasma membrane, local depletion of ATP created by Na/K-ATPase activity might act as the final cause for arresting mitochondria. This synergistic scenario would explain why blocking either component in this scheme (Na/K-ATPase or Ca rise) prevents action potentials from stopping mitochondria. When Ca rise is blocked, mitochondria are no longer drawn toward the plasma membrane to interact with the Na/K-ATPase. When Na/K-ATPase is blocked, it abolishes the micro-ATP domain that finally arrests the mitochondria initially drawn toward the membrane by calcium influx. Although speculative, some features of this scheme are possible. In cultured cells, Ca influx has been shown to induce axial movement of mitochondria toward the plasma membrane (Kolikova et al., 2006; Quintana et al., 2006). Furthermore, microdomains of ATP are known to exist in some systems (Kennedy et al., 1999), and microdomains of ATP might exist underneath the nodal membrane to interact with mitochondria drawn to its proximity. Our present study resolves only longitudinal movement of mitochondria, and high-resolution images of axial movement of mitochondria in the nodal region are needed to resolve this issue.
Normal and pathological implications
Action potentials reduced the number of mobile mitochondria at a node of Ranvier by ∼40%. Assuming a corresponding number of mitochondria gets recruited to the node, what is the function of this recruitment? First, mitochondria might be recruited to the node to match energy demands during intense stimulation. However, this mitochondrial recruitment constitutes only a small fraction of the total mitochondria, since approximately two-thirds are already immobile and unaffected by action potentials. On the other hand, mitochondria might be highly heterogeneous in their metabolic activity, and not all are metabolically useful to supply energy to the node. Mobile mitochondria might be the most metabolically active, and harvesting them is the best strategy to match energy needs to nerve activity. Indeed, our data suggest that the most rapid mitochondria are preferentially arrested by action potentials (Fig. 6 D, asterisk). Second, recruiting mitochondria to active nodes of Ranvier might serve to increase calcium buffering at that site. Mitochondria can take up plasmalemmal Ca influx, locally reducing Ca concentration. Third, activity-dependent immobilization of mitochondria might contribute to long-term patterning of mitochondria along myelinated axons, influencing spatial signaling of molecules such as reactive oxygen species with chronic biological impact. In our study, it is of interest that activity-dependent retardation of mitochondria shows only partial (anterograde) or no (retrograde) recovery when measured 5 min after cessation of activity. This raises the intriguing issue whether prolonged, intermittent nerve activity during development might contribute to permanent mitochondrial patterning. For example, are the immobile mitochondria (approximately two-thirds of total) in quiescent nerves caused by intermittent nerve activity during development?
Finally, our findings have pathophysiological implications for multiple sclerosis. Errors in activity-dependent immobilization of mitochondria may contribute to axonal pathology. Toxic wastes (free radicals) from highly mobile mitochondria may have less chance to linger to damage axons. Thus, although activity-dependent immobilization of mitochondria may serve regional energy demands, excessive immobilization in inappropriate and vulnerable sites may be injurious. The known patterns of abnormal hyperexcitable nerve activity in multiple sclerosis (Smith and McDonald, 1980; Smith and McDonald, 1999) may overretard mitochondria with damaging results. For example, in various animal models of dysmyelination, the reported inappropriate immobilization of mitochondria in the nodal region (Einheber et al., 2006) or the increased mitochondrial density in dysmyelinated regions (Andrews et al., 2006) may arise from excessive overrecruitment of mitochondria by action potentials. Furthermore, excessive retardation of mitochondria may occur because of inappropriately high expression of Nav1.6 in demyelinated axons (Craner et al., 2004; Waxman, 2006). The persistent component of Nav1.6, according to our hypothesis, will exacerbate Na influx and augment Na-pump-mediated stoppage of mitochondria. Errors in activity-dependent mitochondrial recruitment also might occur in multiple sclerosis because of a change in Na/K-ATPase expression (Young et al., 2008; Mahad et al., 2009), or a change in internal structure of the axon that affects the micro-ATP domain that couples Na/K-ATPase to mitochondrial motility. Excessive Na influx has been linked to axonal pathology, and Na/K-ATPase has been implicated, although the manner of involvement is unclear (Bechtold et al., 2005). It is of interest that ouabain has been shown to improve conduction in demyelination (Kaji and Sumner, 1989), raising the intriguing issue of whether excessive coupling of Na/K-ATPase to mitochondria occurs in multiple sclerosis, and whether blocking this excessive coupling has long-term benefits. Future studies need to examine possible defects in activity-dependent retardation of mitochondria in animal models of multiple sclerosis.
Footnotes
This work was supported in part by National Multiple Sclerosis Society Grant RG4054-A-8 (S.Y.C.), National Institutes of Health Grant RO1NS48216 (D.S.), and American Heart Association Grant EIA 0540154 (D.S.).
References
- Andrews H, White K, Thomson C, Edgar J, Bates D, Griffiths I, Turnbull D, Nichols P. Increased axonal mitochondrial activity as an adaptation to myelin deficiency in the Shiverer mouse. J Neurosci Res. 2006;83:1533–1539. doi: 10.1002/jnr.20842. [DOI] [PubMed] [Google Scholar]
- Andrews HE, Nichols PP, Bates D, Turnbull DM. Mitochondrial dysfunction plays a key role in progressive axonal loss in multiple sclerosis. Med Hypotheses. 2005;64:669–677. doi: 10.1016/j.mehy.2004.09.001. [DOI] [PubMed] [Google Scholar]
- Baloh RH. Mitochondrial dynamics and peripheral neuropathy. Neuroscientist. 2008;14:12–18. doi: 10.1177/1073858407307354. [DOI] [PubMed] [Google Scholar]
- Baloh RH, Schmidt RE, Pestronk A, Milbrandt J. Altered axonal mitochondrial transport in the pathogenesis of Charcot-Marie-Tooth disease from mitofusin 2 mutations. J Neurosci. 2007;27:422–430. doi: 10.1523/JNEUROSCI.4798-06.2007. [DOI] [PMC free article] [PubMed] [Google Scholar]
- Baron KT, Thayer SA. CGP37157 modulates mitochondrial Ca2+ homeostasis in cultured rat dorsal root ganglion neurons. Eur J Pharmacol. 1997;340:295–300. doi: 10.1016/s0014-2999(97)01433-7. [DOI] [PubMed] [Google Scholar]
- Bechtold DA, Yue X, Evans RM, Davies M, Gregson NA, Smith KJ. Axonal protection in experimental autoimmune neuritis by the sodium channel blocking agent flecainide. Brain. 2005;128:18–28. doi: 10.1093/brain/awh328. [DOI] [PubMed] [Google Scholar]
- Berthold CH. Morphology of normal peripheral axons. In: Waxman SG, editor. Physiology and pathobiology of axons. New York: Raven; 1978. pp. 3–63. [Google Scholar]
- Brough D, Schell MJ, Irvine RF. Agonist-induced regulation of mitochondrial and endoplasmic reticulum motility. Biochem J. 2005;392:291–297. doi: 10.1042/BJ20050738. [DOI] [PMC free article] [PubMed] [Google Scholar]
- Cai Q, Sheng ZH. Moving or stopping mitochondria: Miro as a traffic cop by sensing calcium. Neuron. 2009;61:493–496. doi: 10.1016/j.neuron.2009.02.003. [DOI] [PMC free article] [PubMed] [Google Scholar]
- Chan DC. Mitochondrial dynamics in disease. N Engl J Med. 2007;356:1707–1709. doi: 10.1056/NEJMp078040. [DOI] [PubMed] [Google Scholar]
- Chiu SY. Asymmetry currents in the mammalian myelinated nerve. J Physiol. 1980;309:499–519. doi: 10.1113/jphysiol.1980.sp013523. [DOI] [PMC free article] [PubMed] [Google Scholar]
- Chiu SY, Ritchie JM. Potassium channels in nodal and internodal axonal membrane of mammalian myelinated fibres. Nature. 1980;284:170–171. doi: 10.1038/284170a0. [DOI] [PubMed] [Google Scholar]
- Connelly CM. Recovery processes and metabolism of nerve. Rev Mod Phys. 1959;31:475–484. [Google Scholar]
- Cooper PD, Smith RS. The movement of optically detectable organelles in myelinated axons of Xenopus laevis . J Physiol. 1974;242:77–97. doi: 10.1113/jphysiol.1974.sp010695. [DOI] [PMC free article] [PubMed] [Google Scholar]
- Cox DA, Conforti L, Sperelakis N, Matlib MA. Selectivity of inhibition of Na(+)-Ca2+ exchange of heart mitochondria by benzothiazepine CGP-37157. J Cardiovasc Pharmacol. 1993;21:595–599. doi: 10.1097/00005344-199304000-00013. [DOI] [PubMed] [Google Scholar]
- Craner MJ, Hains BC, Lo AC, Black JA, Waxman SG. Co-localization of sodium channel Nav1.6 and the sodium-calcium exchanger at sites of axonal injury in the spinal cord in EAE. Brain. 2004;127:294–303. doi: 10.1093/brain/awh032. [DOI] [PubMed] [Google Scholar]
- David G. Mitochondrial clearance of cytosolic Ca2+ in stimulated lizard motor nerve terminals proceeds without progressive elevation of mitochondrial matrix [Ca2+] J Neurosci. 1999;19:7495–7506. doi: 10.1523/JNEUROSCI.19-17-07495.1999. [DOI] [PMC free article] [PubMed] [Google Scholar]
- Detmer SA, Chan DC. Functions and dysfunctions of mitochondrial dynamics. Nat Rev Mol Cell Biol. 2007;8:870–879. doi: 10.1038/nrm2275. [DOI] [PubMed] [Google Scholar]
- Dutta R, McDonough J, Yin X, Peterson J, Chang A, Torres T, Gudz T, Macklin WB, Lewis DA, Fox RJ, Rudick R, Mirnics K, Trapp BD. Mitochondrial dysfunction as a cause of axonal degeneration in multiple sclerosis patients. Ann Neurol. 2006;59:478–489. doi: 10.1002/ana.20736. [DOI] [PubMed] [Google Scholar]
- Edgar JM, McCulloch MC, Thomson CE, Griffiths IR. Distribution of mitochondria along small-diameter myelinated central nervous system axons. J Neurosci Res. 2008;86:2250–2257. doi: 10.1002/jnr.21672. [DOI] [PubMed] [Google Scholar]
- Einheber S, Bhat MA, Salzer JL. Disrupted Axo-glial junctions result in accumulation of abnormal mitochondria at nodes of Ranvier. Neuron Glia Biol. 2006;2:165–174. doi: 10.1017/S1740925X06000275. [DOI] [PMC free article] [PubMed] [Google Scholar]
- Fabricius C, Berthold CH, Rydmark M. Axoplasmic organelles at nodes of Ranvier. II. Occurrence and distribution in large myelinated spinal cord axons of the adult cat. J Neurocytol. 1993;22:941–954. doi: 10.1007/BF01218352. [DOI] [PubMed] [Google Scholar]
- Gordon TR, Kocsis JD, Waxman SG. Electrogenic pump (Na+/K(+)-ATPase) activity in rat optic nerve. Neuroscience. 1990;37:829–837. doi: 10.1016/0306-4522(90)90112-h. [DOI] [PubMed] [Google Scholar]
- Hollenbeck PJ, Saxton WM. The axonal transport of mitochondria. J Cell Sci. 2005;118:5411–5419. doi: 10.1242/jcs.02745. [DOI] [PMC free article] [PubMed] [Google Scholar]
- Hom JR, Gewandter JS, Michael L, Sheu SS, Yoon Y. Thapsigargin induces biphasic fragmentation of mitochondria through calcium-mediated mitochondrial fission and apoptosis. J Cell Physiol. 2007;212:498–508. doi: 10.1002/jcp.21051. [DOI] [PubMed] [Google Scholar]
- Kaji R, Sumner AJ. Effect of digitalis on central demyelinative conduction block in vivo . Ann Neurol. 1989;25:159–165. doi: 10.1002/ana.410250209. [DOI] [PubMed] [Google Scholar]
- Kennedy HJ, Pouli AE, Ainscow EK, Jouaville LS, Rizzuto R, Rutter GA. Glucose generates sub-plasma membrane ATP microdomains in single islet beta-cells. Potential role for strategically located mitochondria. J Biol Chem. 1999;274:13281–13291. doi: 10.1074/jbc.274.19.13281. [DOI] [PubMed] [Google Scholar]
- Kolikova J, Afzalov R, Giniatullina A, Surin A, Giniatullin R, Khiroug L. Calcium-dependent trapping of mitochondria near plasma membrane in stimulated astrocytes. Brain Cell Biol. 2006;35:75–86. doi: 10.1007/s11068-006-9000-1. [DOI] [PubMed] [Google Scholar]
- Macaskill AF, Rinholm JE, Twelvetrees AE, Rancibia-Carcamo IL, Muir J, Fransson A, Aspenstrom P, Attwell D, Kittler JT. Miro1 is a calcium sensor for glutamate receptor-dependent localization of mitochondria at synapses. Neuron. 2009;61:541–555. doi: 10.1016/j.neuron.2009.01.030. [DOI] [PMC free article] [PubMed] [Google Scholar]
- Mahad D, Ziabreva I, Lassmann H, Turnbull D. Mitochondrial defects in acute multiple sclerosis lesions. Brain. 2008;131:1722–1735. doi: 10.1093/brain/awn105. [DOI] [PMC free article] [PubMed] [Google Scholar]
- Mahad DJ, Ziabreva I, Campbell G, Lax N, White K, Hanson PS, Lassmann H, Turnbull DM. Mitochondrial changes within axons in multiple sclerosis. Brain. 2009;132:1161–1174. doi: 10.1093/brain/awp046. [DOI] [PMC free article] [PubMed] [Google Scholar]
- Mima T, Oga T, Rothwell J, Satow T, Yamamoto J, Toma K, Fukuyama H, Shibasaki H, Nagamine T. Short-term high-frequency transcutaneous electrical nerve stimulation decreases human motor cortex excitability. Neurosci Lett. 2004;355:85–88. doi: 10.1016/j.neulet.2003.10.045. [DOI] [PubMed] [Google Scholar]
- Mironov SL. Spontaneous and evoked neuronal activities regulate movements of single neuronal mitochondria. Synapse. 2006;59:403–411. doi: 10.1002/syn.20256. [DOI] [PubMed] [Google Scholar]
- Mironov SL. ADP regulates movements of mitochondria in neurons. Biophys J. 2007;92:2944–2952. doi: 10.1529/biophysj.106.092981. [DOI] [PMC free article] [PubMed] [Google Scholar]
- Misgeld T, Kerschensteiner M, Bareyre FM, Burgess RW, Lichtman JW. Imaging axonal transport of mitochondria in vivo . Nat Methods. 2007;4:559–561. doi: 10.1038/nmeth1055. [DOI] [PubMed] [Google Scholar]
- Pitter JG, Maechler P, Wollheim CB, Spat A. Mitochondria respond to Ca2+ already in the submicromolar range: correlation with redox state. Cell Calcium. 2002;31:97–104. doi: 10.1054/ceca.2001.0264. [DOI] [PubMed] [Google Scholar]
- Poliak S, Peles E. The local differentiation of myelinated axons at nodes of Ranvier. Nat Rev Neurosci. 2003;4:968–980. doi: 10.1038/nrn1253. [DOI] [PubMed] [Google Scholar]
- Quintana A, Schwarz EC, Schwindling C, Lipp P, Kaestner L, Hoth M. Sustained activity of calcium release-activated calcium channels requires translocation of mitochondria to the plasma membrane. J Biol Chem. 2006;281:40302–40309. doi: 10.1074/jbc.M607896200. [DOI] [PubMed] [Google Scholar]
- Saotome M, Safiulina D, Szabadkai G, Das S, Fransson A, Aspenstrom P, Rizzuto R, Hajnoczky G. Bidirectional Ca2+-dependent control of mitochondrial dynamics by the Miro GTPase. Proc Natl Acad Sci U S A. 2008;105:20728–20733. doi: 10.1073/pnas.0808953105. [DOI] [PMC free article] [PubMed] [Google Scholar]
- Smith KJ, McDonald WI. Spontaneous and mechanically evoked activity due to central demyelinating lesion. Nature. 1980;286:154–155. doi: 10.1038/286154a0. [DOI] [PubMed] [Google Scholar]
- Smith KJ, McDonald WI. The pathophysiology of multiple sclerosis: the mechanisms underlying the production of symptoms and the natural history of the disease. Philos Trans R Soc Lond B Biol Sci. 1999;354:1649–1673. doi: 10.1098/rstb.1999.0510. [DOI] [PMC free article] [PubMed] [Google Scholar]
- Stys PK. General mechanisms of axonal damage and its prevention. J Neurol Sci. 2005;233:3–13. doi: 10.1016/j.jns.2005.03.031. [DOI] [PubMed] [Google Scholar]
- Sun BB, Chiu SY. N-type calcium channels and their regulation by GABAB receptors in axons of neonatal rat optic nerve. J Neurosci. 1999;19:5185–5194. doi: 10.1523/JNEUROSCI.19-13-05185.1999. [DOI] [PMC free article] [PubMed] [Google Scholar]
- Thastrup O, Cullen PJ, Drobak BK, Hanley MR, Dawson AP. Thapsigargin, a tumor promoter, discharges intracellular Ca2+ stores by specific inhibition of the endoplasmic reticulum Ca2(+)-ATPase. Proc Natl Acad Sci U S A. 1990;87:2466–2470. doi: 10.1073/pnas.87.7.2466. [DOI] [PMC free article] [PubMed] [Google Scholar]
- Verbny Y, Zhang CL, Chiu SY. Coupling of calcium homeostasis to axonal sodium in axons of mouse optic nerve. J Neurophysiol. 2002;88:802–816. doi: 10.1152/jn.2002.88.2.802. [DOI] [PubMed] [Google Scholar]
- Wang X, Schwarz TL. The mechanism of Ca2+-dependent regulation of kinesin-mediated mitochondrial motility. Cell. 2009;136:163–174. doi: 10.1016/j.cell.2008.11.046. [DOI] [PMC free article] [PubMed] [Google Scholar]
- Waxman SG. Axonal conduction and injury in multiple sclerosis: the role of sodium channels. Nat Rev Neurosci. 2006;7:932–941. doi: 10.1038/nrn2023. [DOI] [PubMed] [Google Scholar]
- Waxman SG. Axonal dysfunction in chronic multiple sclerosis: meltdown in the membrane. Ann Neurol. 2008;63:411–413. doi: 10.1002/ana.21361. [DOI] [PubMed] [Google Scholar]
- Yang F, He XP, Russell J, Lu B. Ca2+ influx-independent synaptic potentiation mediated by mitochondrial Na(+)-Ca2+ exchanger and protein kinase C. J Cell Biol. 2003;163:511–523. doi: 10.1083/jcb.200307027. [DOI] [PMC free article] [PubMed] [Google Scholar]
- Yi M, Weaver D, Hajnoczky G. Control of mitochondrial motility and distribution by the calcium signal: a homeostatic circuit. J Cell Biol. 2004;167:661–672. doi: 10.1083/jcb.200406038. [DOI] [PMC free article] [PubMed] [Google Scholar]
- Young EA, Fowler CD, Kidd GJ, Chang A, Rudick R, Fisher E, Trapp BD. Imaging correlates of decreased axonal Na+/K+ ATPase in chronic multiple sclerosis lesions. Ann Neurol. 2008;63:428–435. doi: 10.1002/ana.21381. [DOI] [PubMed] [Google Scholar]
- Zhang CL, Verbny Y, Malek SA, Stys PK, Chiu SY. Nicotinic acetylcholine receptors in mouse and rat optic nerves. J Neurophysiol. 2004;91:1025–1035. doi: 10.1152/jn.00769.2003. [DOI] [PubMed] [Google Scholar]
- Zhang CL, Wilson JA, Williams J, Chiu SY. Action potentials induce uniform calcium influx in mammalian myelinated optic nerves. J Neurophysiol. 2006;96:695–709. doi: 10.1152/jn.00083.2006. [DOI] [PubMed] [Google Scholar]