Abstract
Purpose
In this investigation, the authors determined the strength of association between tongue kinematic and speech acoustics changes in response to speaking rate and loudness manipulations. Performance changes in the kinematic and acoustic domains were measured using two aspects of speech production presumably affecting speech clarity: phonetic specification and variability.
Method
Tongue movements for the vowels /ia/ were recorded in 10 healthy adults during habitual, fast, slow, and loud speech using three-dimensional electromagnetic articulography. To determine articulatory-to-acoustic relations for phonetic specification, the authors correlated changes in lingual displacement with changes in acoustic vowel distance. To determine articulatory-to-acoustic relations for phonetic variability, the authors correlated changes in lingual movement variability with changes in formant movement variability.
Results
A significant positive linear association was found for kinematic and acoustic specification but not for kinematic and acoustic variability. Several significant speaking task effects were also observed.
Conclusion
Lingual displacement is a good predictor of acoustic vowel distance in healthy talkers. The weak association between kinematic and acoustic variability raises questions regarding the effects of articulatory variability on speech clarity and intelligibility, particularly in individuals with motor speech disorders.
Keywords: tongue kinematics, vowel acoustics, electromagnetic articulography, speaking rate effects
Two commonly reported characteristics of dysarthric speech are imprecise and variable sound production patterns (Forrest & Weismer, 1995; Goozee, Murdoch, Theodoros, & Stokes, 2000; Jaeger, Hertrich, Stattrop, Schönle, & Ackermann, 2000; Kent, Netsell, & Bauer, 1975; Kleinow, Smith, & Ramig, 2001; McHenry, 2003; Neilson & O’Dwyer, 1984; Turner, Tjaden, & Weismer, 1995; Ziegler & van Cramon, 1986). Because these two aspects of articulatory performance have been measured primarily using either an articulatory kinematic or acoustic approach, the extent to which performance in one domain is indicative of performance in the other is not known. More knowledge about articulatory-to-acoustic relations is necessary to better predict the extent to which altering articulatory movements—for example, in the treatment of individuals with dysarthria—will produce targeted speech acoustics and perceptual changes. This information is also essential for a better understanding of the articulatory basis of speech intelligibility impairments in talkers with dysarthria.
Although vocal tract movements unquestionably engender acoustic change, the association between speech movements and acoustic outcomes may not be as strong as is often assumed because of motor equivalence and nonlinearities between vocal tract configurations and resulting formant frequencies. Motor equivalence refers to the ability to generate various motor actions with an equivalent end result (Lashley, 1951). With regard to speech, talkers are capable of producing the same sound through different vocal actions (Gay & Hirose, 1973; Guenther et al., 1999; Hertrich & Ackermann, 2000; Hughes & Abbs, 1976; Perkell, Matthies, Svirsky, & Jordan, 1993; Perkell et al., 1997). For example, talkers can vary the relative contributions of lip rounding and tongue body elevation to produce the vowel /u/ (Perkell et al., 1993). Nonlinear relations between vocal tract movements and speech output have been described in a relatively small number of modeling and empirical studies (e.g., Beckman et al., 1995; Gay, Boe, & Perrier, 1992; Perkell, 1996; Perkell & Nelson, 1985; Stevens, 1972, 1989). For example, the quantal theory, which is based on the classic modeling studies by Stevens (1972, 1989), predicts that formant frequencies are relatively unaffected by small incremental changes in the location of tongue–to–hard palate constrictions.
The purpose of the present study was to empirically determine the strength of articulatory-to-acoustic relations in two variables considered to impact speech intelligibility: phonetic specification and phonetic variability. Phonetic specification is defined as the distance between two vowels in articulatory or acoustic space. Articulatory specification is the extent of tongue displacement between the high vowel /i/ and the low vowel /a/; acoustic specification is the Euclidean distance between the high vowel /i/ and the low vowel /a/ in F1/F2 planar space.
Phonetic variability is defined as the variability of kinematic (kinematic variability) and acoustic (acoustic variability) patterns across several repetitions of the same utterance. The spatiotemporal index (STI) was used to quantify phonetic variability in both the articulatory and acoustic domains (Smith, Goffman, Zelaznik, Ying, & McGillem, 1995). The spatiotemporal variability of movement patterns has been primarily studied in the kinematic domain (e.g., Kleinow et al., 2001; McHenry, 2003, 2004).
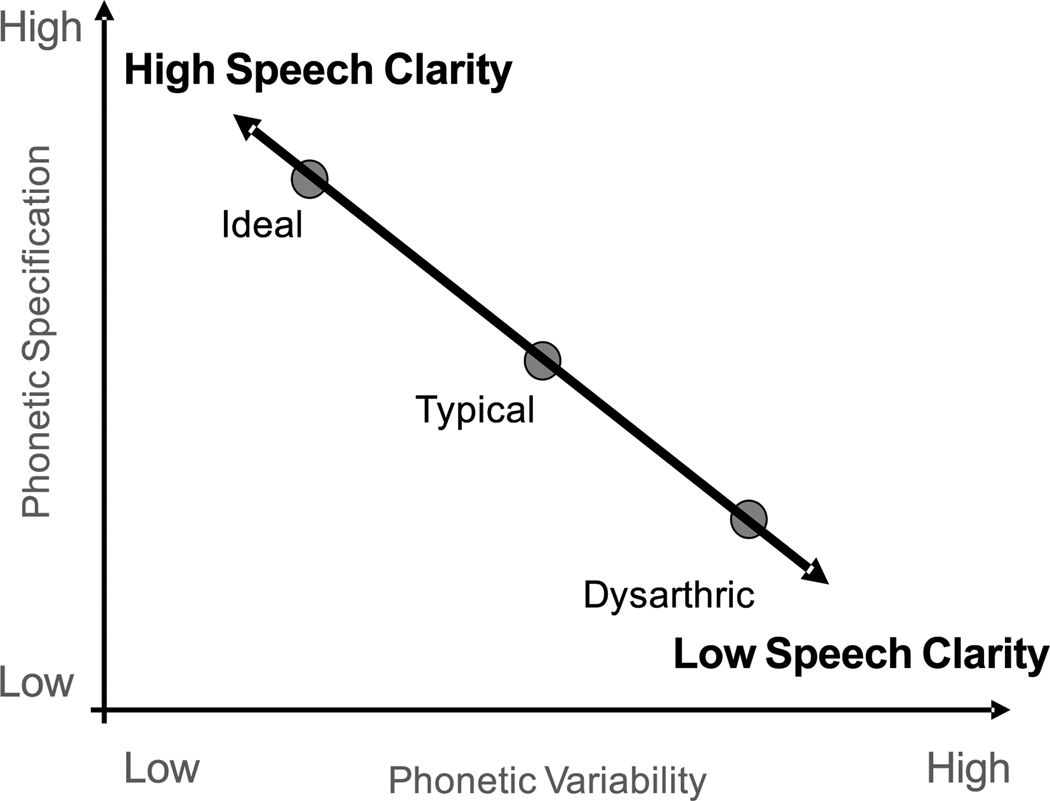
Figure 1 presents a hypothetical framework for predicting the effects of phonetic specification and phonetic variability on speech clarity and intelligibility. In this framework, the combination of high phonetic specification and low phonetic variability yields the clearest speech, even under difficult listening conditions such as the presence of environmental noise (e.g., Payton, Uchanski, & Braida, 1994). Therefore, we defined high phonetic specification and low phonetic variablity as the “ideal speech” for listeners. In contrast to ideal speech, the combination of low phonetic specification and high phonetic variability—two qualities commonly found in talkers with motor speech impairments—yields the most unintelligible speech. For simplicity, typical speech is hypothetically located near the middle of the speech clarity continuum with moderate levels of phonetic specification and variability.
Figure 1.
The hypothesized interactions of phonetic specification and phonetic variability and their effect on speech intelligibility.
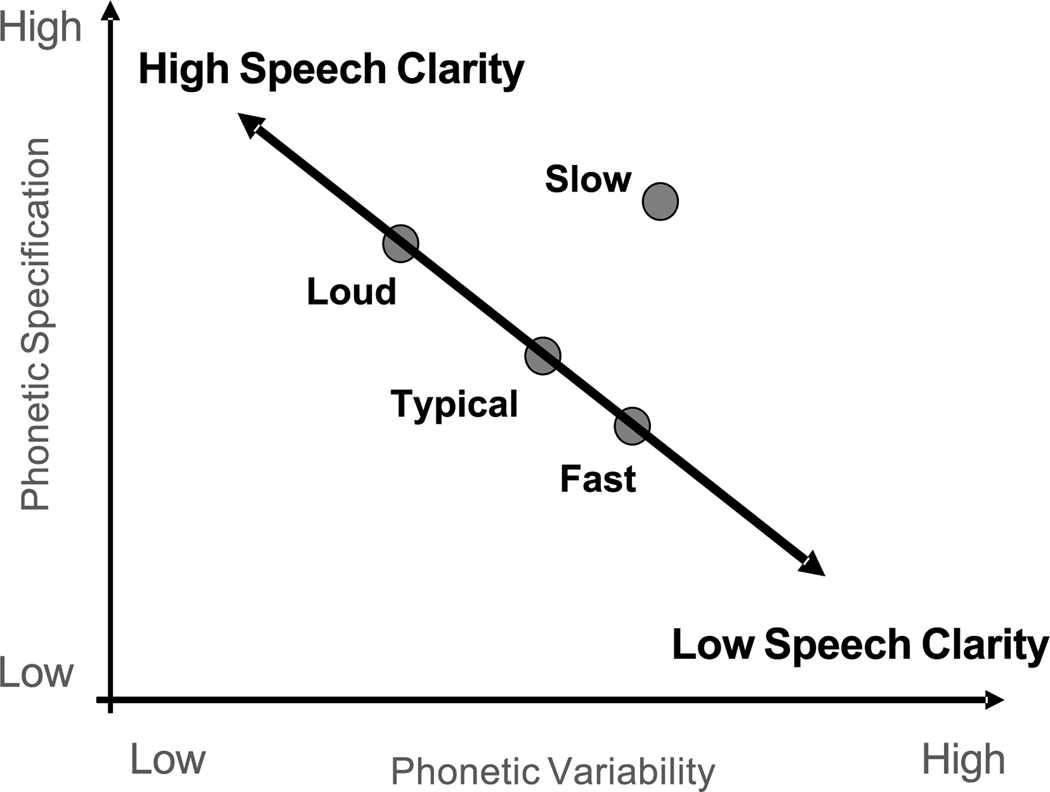
To examine the strength of the articulatory-to-acoustic association for phonetic specification and variability, we asked healthy talkers to modify their speaking rate and loudness. As portrayed in Figure 2, these speaking tasks provided a means to elicit natural variations in the degree of phonetic specification and variability, which could be examined in both the kinematic and acoustic domains. On the basis of the existing literature, Figure 2 illustrates the predicted changes in speech movements elicited by each speech task within the proposed framework.
Figure 2.
The experimental framework for speaking rate and loudness effects on articulatory specification and variability, and their hypothesized impact on speech intelligibility.
For example, prior research suggests that articulatory movements become overspecified or hyperarticulated (Lindblom, 1990) during slow and loud speech (Adams, Weismer, & Kent, 1993; Dromey, 2000; Dromey & Ramig, 1998; Schulman, 1989; Tasko & McClean, 2004). In contrast to slow and loud speech, articulatory movements are often underspecified or hypoarticulated during fast speech (Flege, 1988; Goozee, Stephenson, Murdoch, Darnell, & LaPointe, 2005; Kent & Moll, 1972; Nelson, Perkell, & Westbury, 1984). Underspecification or hypoarticulation, however, is not observed in some talkers who, instead of displacement reduction, increase articulatory movement speed to achieve faster rates (Engstrand, 1988; Gay & Hirose, 1973; Kuehn & Moll, 1976; McClean, 2000; Tasko & McClean, 2004). In comparison with typical speech, articulatory movement patterns tend to be (a) more variable during slow speech (Kleinow et al., 2001; Smith et al., 1995; Smith & Kleinow, 2000); (b) less variable during loud speech (Huber & Chandrasekaran, 2006); and (c) slightly more variable during fast speech (Kleinow et al., 2001; Smith & Kleinow, 2000).
If the association between speech kinematics and acoustics is strong, speaking rate and loudness manipulations should produce similar effects in both domains. Prior acoustic studies provide some support for this assertion: Relative to typical speech, slow and loud speech have been observed to elicit overspecified vowels in F1/F2 planar space, and fast speech has been observed to elicit underspecified vowel targets (Gay, 1978; Lindblom, 1963; Tjaden & Wilding, 2004; Turner et al., 1995). However, because both domains have rarely been studied together, the associations between articulatory and acoustic changes in response to speaking rate and loudness manipulations are poorly understood.
We conducted the present investigation to examine the articulatory-to-acoustic relations in typical talkers. Speaking rate and loudness manipulations were used for the purpose of eliciting natural variations in the degree of articulatory and acoustic specification and variability. Once applied to speech impaired populations, this information may be useful for identifying treatment approaches that elicit articulatory performance patterns that have predictable, positive effects on speech acoustics and intelligibility.
Method
Participants
Study participants were 10 healthy adult speakers (5 male, 5 female; range = 21–47 years; M = 29.1 years of age). They reported no history of speech, language, or hearing difficulty, and English was their native language (Midwestern dialect). All participants passed a bilateral hearing screening at 0.5, 1, 2, and 4 kHz at 25 dB.
Speech Tasks
Participants produced the sentence “Tomorrow Mia may buy you toys again” five times at their typical speaking rate and loudness. They were then instructed to repeat the sentence five times using speaking rates that were approximately twice as fast and half as fast as their typical speaking rate. In addition, participants were asked to produce five repetitions of the utterance using a loudness that was approximately twice as loud as their typical loudness. The order of the five speaking tasks was counterbalanced across Talkers 1–5.The data from Talkers 6–10 were used also as control data for a different study that required the sentence productions to be produced in the following order: typical, fast, loud, and slow. To our knowledge, there are no a priori reasons to anticipate order effects for a limited number of simple speech tasks produced by healthy controls.
Data Collection
Articulatory movements were captured using three-dimensional (3D) electromagnetic articulography (Model AG500; Medizintechnik Carstens), which tracked the position of small sensors (coils of approximately 2-mm diameter) located within an electromagnetic field. Participants were seated inside a Plexiglas cube that housed six electromagnets that generated electromagnetic pulses at distinct frequencies. The induced voltages recorded by each sensor were proportional to the relative strength of each electromagnet. These voltage signals were converted into three Cartesian coordinates and two angles that were expressed relative to an origin located at the center of the cube.
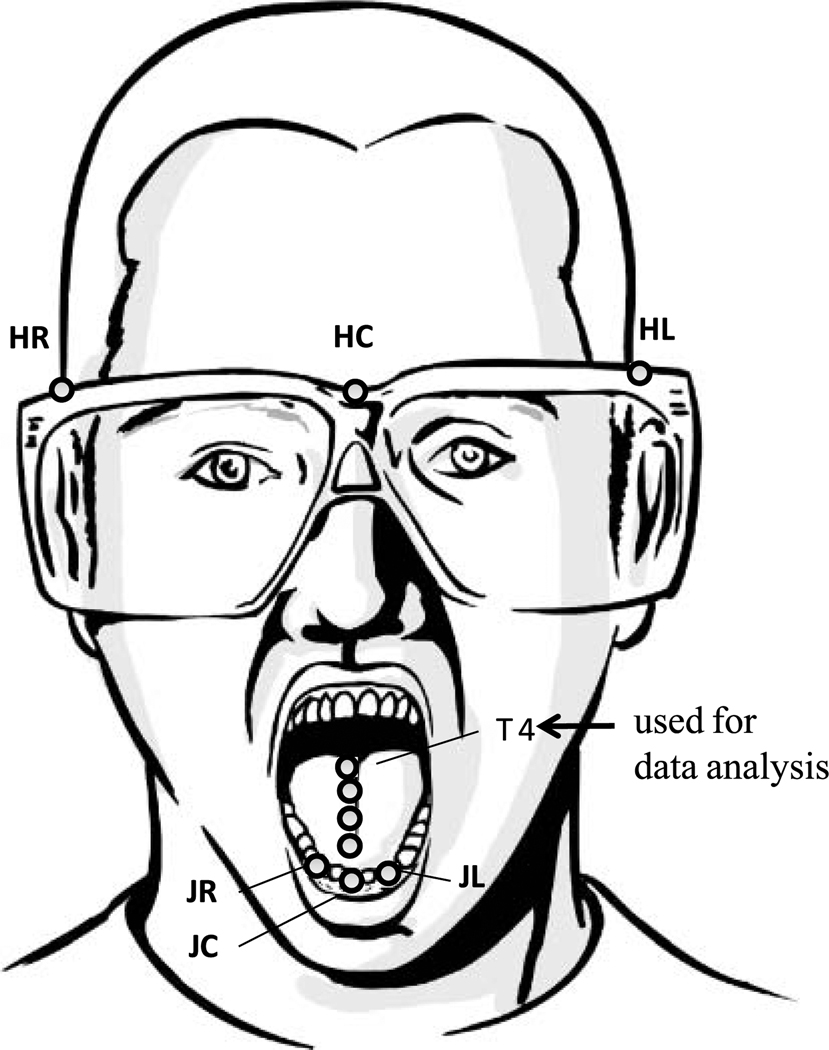
In the present study, four sensor coils were placed approximately 1.5 cm apart on the participant’s midsagittal tongue, with the most anterior and posterior sensors placed approximately 1.5 cm and 6 cm from the tip of the tongue, respectively (see Figure 3). Only the most posterior sensor was used for data analysis in this study. This sensor was selected because it captured the predominant tongue movement during the target production /ia/.
Figure 3.
Sensor placement. HR = head sensor right; HC = head sensor center; HL = head sensor left; T4 = tongue sensor; JR = jaw sensor right; JC = jaw sensor center; JL = jaw sensor left.
Three sensors were also placed on a pair of plastic goggles, which fit snuggly around the forehead. The data from these sensors were used to correct for the influence of head translation and rotation on tongue kinematics (see Figure 3). After sensor placement, each participant engaged in casual conversations for approximately 5 min to allow time to adjust to the presence of sensors on the tongue.
Acoustic data were obtained using a condenser microphone that was placed approximately 15 cm from the mouth. Acoustic recordings were digitized with a sampling rate of 16 kHz and 16-bit quantization level.
Validity of Tracking Using the AG500
Prior to analysis, the accuracy of the AG500 tracking was estimated based on the change in distance (i.e., range and SDs) between the three fixed head sensors (see Figure 3). Because all head sensors were placed on the rigid pair of goggles, the distance between each head sensor should ideally remain constant throughout the data collection session. For this analysis, the head sensor time histories during the target /ia/ were used. One repetition of each speaking task was randomly selected for each participant, resulting in 120 range and SD values, which were averaged across all participants. The error range was defined as the difference between the smallest and largest measured distance between each of the possible sensor pairs within one recording. The SD represented the deviation of the mean distance between the two sensors during each recording.
The use of head sensors rather than tongue sensors for the error estimation was necessary because the tongue is not a rigid object, and the distance between two sensors is expected to change during speech. Therefore, the error range and the SDs of the head sensor distances provided the best estimates available of the expected tracking errors. Table 1 shows the results of the error estimation. In general, the measurement error was acceptable for tracking of speech movements and showed convergence with previous findings of less than 0.5-mm error of the AG500 under ideal recording conditions (Yunusova, Green, & Mefferd, 2009).
Table 1.
Estimation of measurement errors (mm) based on head sensors (N = 120).
| Head sensor distance | |||
|---|---|---|---|
| Variable | Nose–right side |
Nose–left side |
Right side–left side |
| Mean error range | 0.31 | 0.28 | 0.36 |
| Mean error SD | 0.09 | 0.08 | 0.11 |
Data Parsing
The spectrographic view (frequency range 0–8000 Hz; 125-Hz bandwidth) of Wavesurfer (Sjölander & Beskow, 2006) was used to determine the beginning and ending of the target /ia/. The boundaries were defined by the offset and onset of the nasal “m” in “Mia may.”
To extract the first and second formant, the linear prediction coding (LPC)–based formant tracking algorithm (0.049-s window length) in Wavesurfer was applied to the parsed target. All formant trajectories were further manually checked and, when necessary, were edited using an LPC spectrum display to verify formant location. The spectrum section plots were set to an order factor of 20 for females and an order factor of 33 for males, with a fast fourier transform (FFT) analysis of 512 points. The first and second formant time histories were extracted at a frame interval of 0.001 s for further analysis in a customized MATLAB software program (The MathWorks, 2007).
Kinematic data extraction, parsing, and processing
The 3D movements of the posterior tongue sensor and nose bridge sensor were calculated and head corrected using software provided by Medizintechnik Carstens (CalPos and NormPos, respectively).
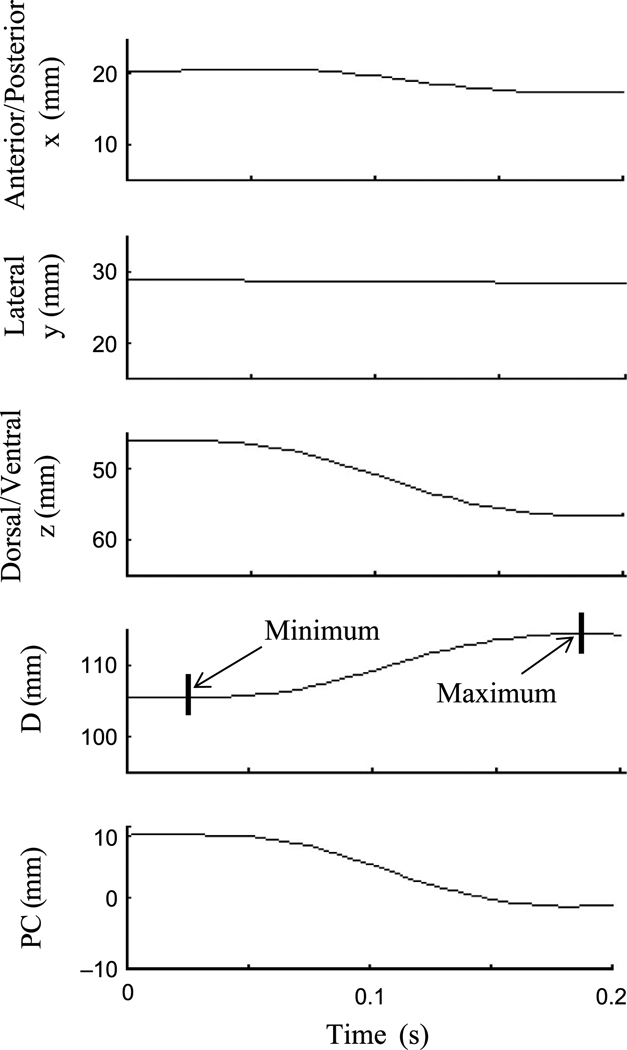
A 3D distance signal using the posterior tongue sensor and nose bridge sensor was calculated using a customized software program in MATLAB and then smoothed in MATLAB using a 10-Hz low-pass filter. Additionally, the first principal component of the posterior tongue sensor trajectory was derived from the filtered movements in the x, y, and z dimension using a customized software program in MATLAB. The acoustic signal was used to determine the target boundaries in the kinematic signals (see Figure 4).
Figure 4.
Determining articulatory specification. The tongue movement time histories of the x, y, and z dimensions are plotted together with the corresponding three-dimensional distance signal between the posterior tongue marker and the nose bridge marker (D) and the principal component signal (PC). The minimum and maximum displacements of the three-dimensional distance signal were used to determine articulatory specification. Kinematic target boundaries were based on the acoustic data.
The distance signal was used to determine phonetic specification; the principal component signal was used to determine phonetic variability. The rationale for using two different signals for phonetic specification and phonetic variability in the kinematic domain was that the Euclidean distance signal paralleled the approach to determine phonetic specification in the acoustic domain (see later subsection titled Determining phonetic specification), which was important for the validity of correlating kinematic and acoustic specification. However, one concern with using the Euclidean distance signal is the potential of rotation artifacts (Green, Wilson, Wang, & Moore, 2007). Specifically, the Euclidean distance poorly represents tongue movements that form an arc-shaped path relative to the head sensor. Because the principal component accounted for most of the movements in all three dimensions (see later subsection titled Determining phonetic variability), we compared articulatory specification that was calculated based on the Euclidean distance signal and principal component signal to determine potential rotational artifacts. Comparisons showed that both approaches yielded the same results, thus suggesting that rotational artifacts did not significantly affect measurements of articulatory specification.
The principal component approach was chosen for the calculations of kinematic phonetic variability to parallel the calculations of acoustic phonetic variability, which required the reduction of two dimensions of formant movements (F1 and F2) into one dimension (see later subsection titled Determining phonetic variability). By using similar signal processing procedures in the kinematic and acoustic domain, we maximized the validity of correlating kinematic and acoustic variability. Both signal processing approaches (i.e., principal component and Euclidean distance) have been used previously to reduce 3D kinematic data into a single dimension (Hertrich & Ackermann, 2000; Hoole & Kühnert, 1995; Smith et al., 1995).
Data Analysis
Speech task performances
The duration of the target /ia/ was measured based on the parsed acoustic signal using the spectrogram plot in Wavesurfer. This measure was used to verify speaking rate changes according to the speech tasks. Relative loudness was determined by extracting the mean dB value across the target /ia/ using Wavesurfer. Relative loudness was used to verify the changes in loudness according to the speech tasks.
Determining phonetic specification
To maximize the validity of comparisons between kinematic and acoustic domains, similar data conditioning and analysis techniques were used on both signals. In the kinematic domain, tongue displacement was represented by the distance signal of the posterior tongue sensor to the nose bridge sensor. Articulatory specification was measured by calculating the Euclidean distance between /i/ and /a/ in 3D movement space. Specifically, the Euclidean distance between tongue displacement extrema during the productions of /ia/ was algorithmically determined using a customized MATLAB program. Five 3D Euclidean distance values associated with the five repetitions of the target utterance were averaged for each talker within each speech task.
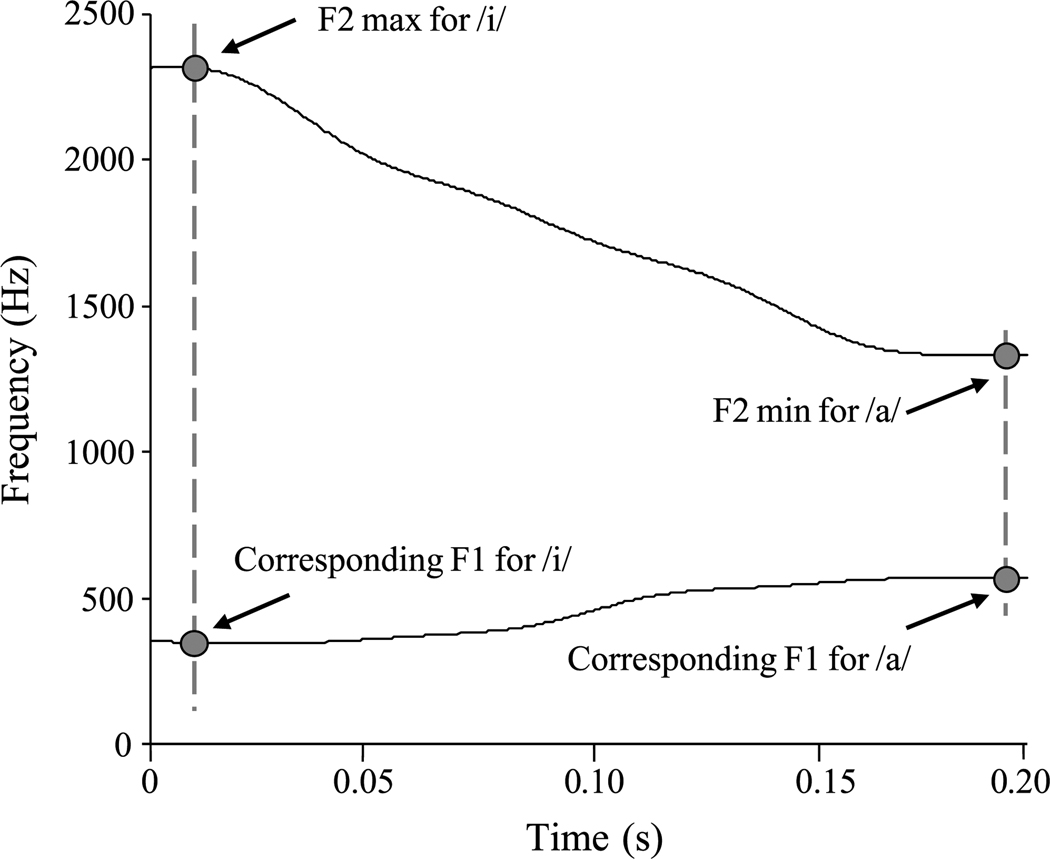
In the acoustic domain, specification was represented as the Euclidian distance between /i/ and /a/ in F1/F2 planar space. The F1 and F2 trajectories were imported to MATLAB and smoothed using a 30-Hz LP filter for typical, fast, and loud and a 5-Hz LP filter for slow. Filter selections were based on visual inspections of the filtered and unfiltered formant trajectories. A customized MATLAB algorithm graphically displayed the F1 and F2 trajectories and indicated the F2 maximum for /i/ and the F2 minimum for /a/ (see Figure 5).
Figure 5.
Determining acoustic specification. F1 and F2 formant trajectories are plotted for the target /ia/. The F2 maximum and minimum and their corresponding F1 values were used to determine the acoustic specification of the two vowels. max = maximum; min = minimum; Hz = Hertz; s = seconds.
Acoustic extrema associated with each vowel were identified algorithmically based on zero-crossings in the associated formant velocity trace. The experimenter manually selected F2 values for /i/ and /a/ based on the indicated F2 extrema. The corresponding F1 values were then extracted to define the F1/F2 planar space for /i/ and /a/. Note that F1 extrema were not always captured with this approach, considering F2 extrema and F1 extrema did not always occur at the same time. The rationale for selecting the F2 extrema was based on Tjaden and Weismer’s (1998) report that F2 formant trajectories are sensitive to speaking rate manipulation. However, when the F2 extrema remained steady over a relatively long period (i.e., during slow speech), the F2 value at the time of the F1 extrema was selected to capture the acoustic vowel specification most accurately. After extracting F1 and F2 for /i/ and /a/, the Euclidean distance between /i/ and /a/ in F1/F2 planar space was calculated. Euclidian distance values within each speech task were then averaged for each talker.
Determining phonetic variability
For each analyzed target, the first principal component of the posterior tongue sensor trajectory was derived from the filtered movements in the x, y, and z dimension. On average, the principal component accounted for 98% of the 3D movement (range = 70%–99%). The principal component signal was inverted if its movements were in the direction opposite those of the 3D time histories.
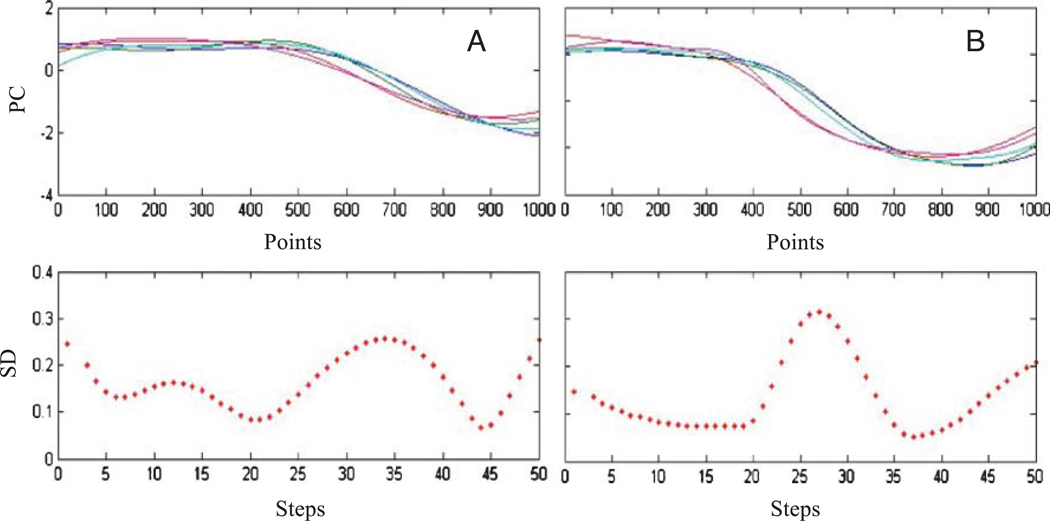
For each subject and speaking task, the STI was calculated on the principal component signals representing the tongue movements associated with the five repetitions of the target utterance. The five principal component signals were first de-meaned and divided by their SDs. Then, all signals were time normalized to 1,000 points using a spline interpolation function (see Figure 6, Panel A). Next, 50 nonoverlapping windows with 20 consecutive data points were created along the x-axis, and the SD within each window was determined. Finally, the sum of 50 SD values provided the STI score (Smith et al., 1995). For each speech task, STI scores were averaged across all 10 participants.
Figure 6.
Determining phonetic variability. Panel A: Kinematic variability. The time- and amplitude-normalized principal component of the three-dimensional tongue movement is plotted for each repetition of /ia/. The SD within a 20-point window is plotted below the movement traces. Panel B: Acoustic variability. The time- and amplitude-normalized principal component of the first and second formant movement is plotted for each repetitions of /ia/. The SD within a 20-point window is plotted below the formant movement traces.
The procedures to calculate acoustic variability paralleled those used to estimate kinematic variability (see Figure 7, Panel B). The first principal component was derived from the smoothed F1 and F2 trajectories. Across all analyzed repetitions, the principal component accounted for, on average, 99% of the F1 and F2 trajectory movements (range = 88%–100%). Each principal component was de-meaned and divided by its SD and then was time normalized to 1,000 points using a spline interpolation algorithm.
Figure 7.
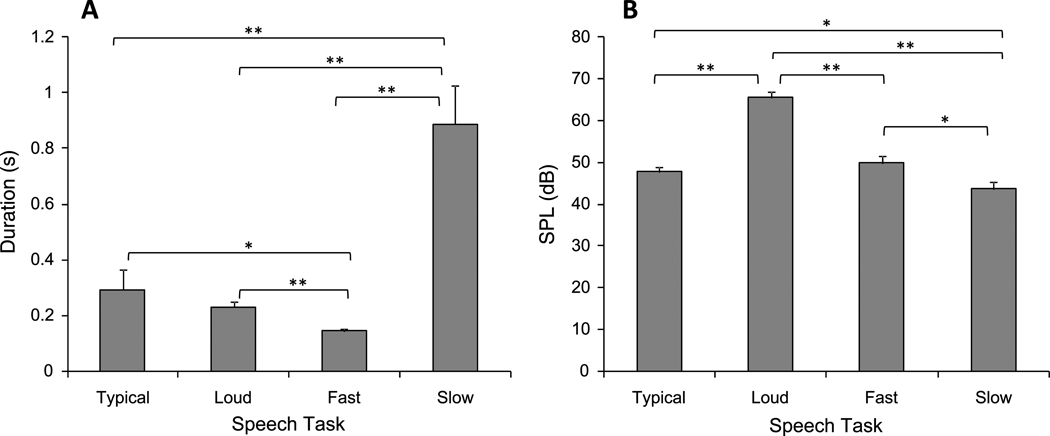
Speech task performance. Panel A displays the averages of the duration means (+ SE) for each speech task (N = 10). Panel B shows the averages of the loudness means (+ SE) for each speech task (N = 10). SE = standard error. *p < .05. **p < .01. SPL = sound pressure level; dB = decibels.
Because the kinematic and acoustic principal components accounted for approximately the same percentage of variance in the 3D signals, the acoustic and kinematic principal components were deemed to be equally representative of the raw data in their respective domains.
Statistical Analyses
To verify that our speaking tasks elicited targeted changes in rate and loudness, we subjected the duration and loudness values to a repeated measures analysis of variance (ANOVA). Post hoc analyses included paired sample t tests, which were used to test mean differences between each speech task. The effect of the speech task on articulatory and acoustic specification was determined by submitting the mean displacement and mean vowel distance values to separate repeated measures ANOVA tests. Post hoc analyses between speech conditions were examined using paired sample t tests.
Pearson’s correlations were computed to determine the strength of association between articulatory and acoustic phonetic specification. These correlations were performed across and within talkers. The strength of articulatory-to-acoustic association of phonetic variability across and within talkers was calculated the same way.
Reliability of Measurements
The reliability of kinematic measures was not assessed because these measured were algorithmically determined. Measurement reliability of the formant trajectories was calculated by randomly selecting one condition of each participant and re-tracking F1 and F2 values of all repetitions within the selected condition. The reliability of the acoustic specification was calculated using the difference between the Euclidian distance of the reanalyzed data and the original Euclidian distance. On average, Euclidian distances differed by 37 Hz (SD = 26 Hz). The STI values of reanalyzed conditions were compared to the original STI values. The difference between the reanalyzed and original STI values was 0.78 (SD = 0.61), which was acceptable for the purpose of this study.
Results
Task Performance
Figure 7 displays the average of the mean duration and SPL values and their standard errors (SEs) for each speech task. A significant main effect was found for duration, F(1.33, 11.96) = 17.34, p = .001. Post hoc analyses showed that slow speech elicited significantly longer target duration than did typical (p < .01), loud (p < .01), and fast (p < .01) speech. Further, fast speech elicited significantly shorter target duration than did loud (p < .01), typical (p = .03), and slow (p < .01) speech.
The main effect of speech intensity was statistically significant, F(3, 27) = 64.39, p < .0001. Loud speech was produced at significantly greater intensities than were typical (p < .01), fast (p < .01), and slow (p < .01) speech. Further, slow speech was produced at significantly lower intensities than was fast speech (p < .05) and typical speech (p < .05). Taken together, these findings suggest that the protocol for eliciting the targeted rate and loudness changes was successful.
Articulatory-to-Acoustic Relations
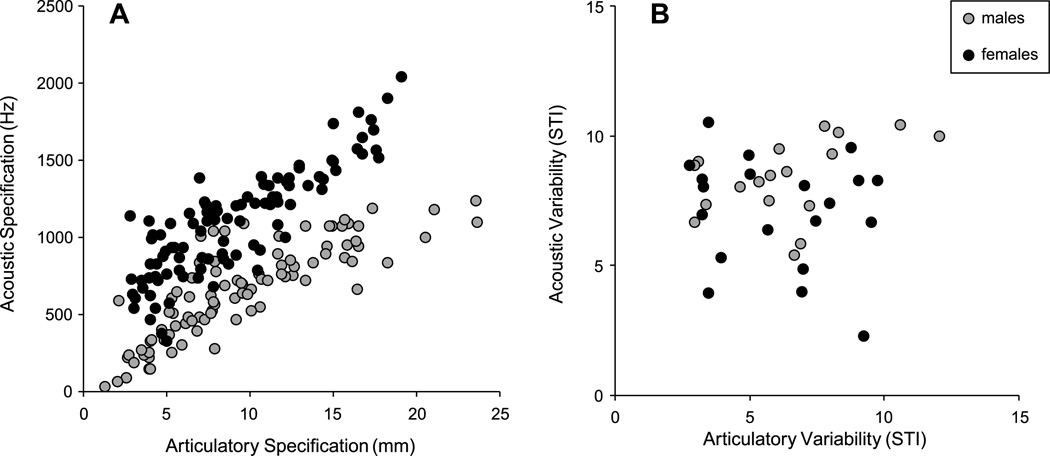
Articulatory specification is plotted as a function of acoustic specification in Panel A of Figure 8. Because two separate lines of regressions were evident, correlations were calculated for male and female talkers. Pearson’s correlations were high across male, r(98) = .83, p < .01, and female, r(98) = .86, p < .01, talkers. When analyzing the articulatory-to-acoustic correlation for each individual talker, all but two talkers revealed significant correlations (see Table 2).
Figure 8.
Articulatory-to-acoustic relations. Panel A: Lingual displacement is displayed as a function of vowel distance size. All five repetitions of all speech tasks from all talkers were included (N = 198), and two outliers were removed. Panel B: Kinematic variability is plotted as a function of acoustic variability. Two outliers were removed (N = 38). mm = millimeters.
Table 2.
Articulatory-to-acoustic correlations for phonetic specification (N = 20).
| Talker | Specification |
|---|---|
| S1 | .89** |
| S2 | .77** |
| S3† | .91** |
| S4 | .89** |
| S5 | .60** |
| S6 | .92** |
| S7 | .96** |
| S8 | .80** |
| S9 | .97** |
| S10† | .42 |
Note. In two cases, one outlier was removed from the correlation analysis for phonetic specification. S = subject.
N = 19.
p < .01.
Articulatory phonetic variability is plotted as a function of acoustic phonetic variability in Panel B of Figure 9. No significant correlation between articulatory and acoustic STI values was found.
Figure 9.
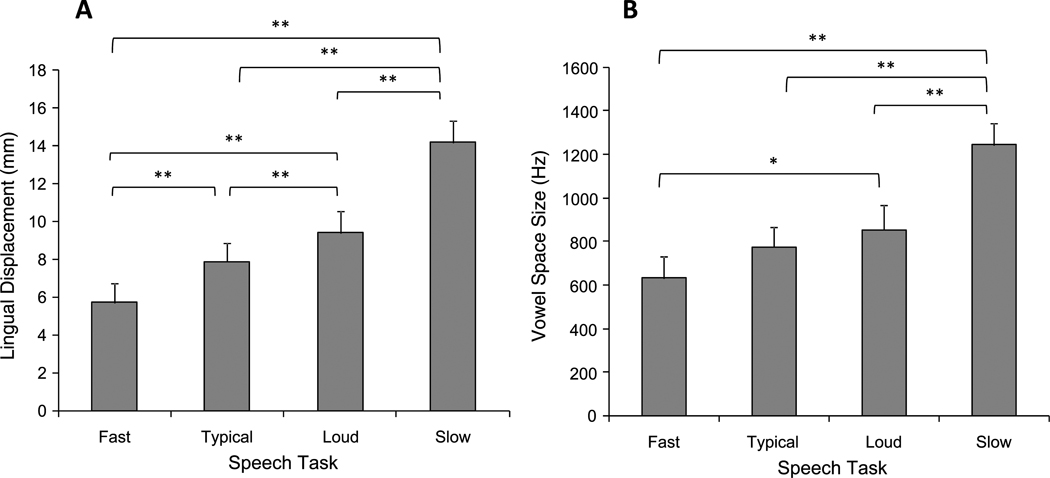
Speech task effects for phonetic specification. Panel A displays the averages of the tongue displacement means (+ SE) for each speech task (N = 10). Panel B shows the corresponding averages of vowel distance means (+ SE) for each speech task (N = 10). *p < .05. **p < .01.
Phonetic Specification
The results for articulatory and acoustic specification are displayed in Panels A and B, respectively, of Figure 9. A significant task effect was found for lingual displacement, F(3, 27) = 32.901, p < .001, and for acoustic vowel distance, F(3, 27) = 16.13, p < .001. Table 3 displays the paired sample t tests for the task effects on articulatory and acoustic specification.
Table 3.
Paired sample t tests for phonetic specification.
| Speech task comparison | Difference in displacement in mm M (SE) |
t(9) | Difference in vowel distance in Hz M (SE) |
t(9) |
|---|---|---|---|---|
| Slow vs. typical | 6.29 (1.29) | 4.88** | 466 (59.36) | 7.85** |
| Slow vs. loud | 4.76 (1.18) | 4.02** | 388 (62.53) | 6.19** |
| Slow vs. fast | 8.44 (0.99) | 8.54** | 610 (58.59) | 4.73** |
| Loud vs. fast | 3.69 (0.49) | 7.41** | 220 (55.63) | 1.83* |
| Loud vs. typical | 1.53 (0.41) | 3.70** | 77 (37.08) | 2.09 |
| Typical vs. fast | 2.16 (0.48) | 4.50** | 143 (48.13) | 1.40 |
p < .05.
p < .01.
In the kinematic domain, slow speech elicited significantly larger lingual displacements than did typical (p < .01), loud (p < .01), and fast (p < .01) speech. Further, loud speech elicited significantly larger displacements than did typical (p < .01) and fast (p < .01) speech. Lingual displacements during fast speech were significantly smaller than they were during typical (p < .01) and loud (p < .01) speech. In the acoustic domain, vowel distances were significantly larger during slow speech than during typical (p < .01), loud (p < .01), and fast (p < .01) speech. Vowel distances were also significantly larger during loud speech than during fast speech (p < .01).
A mixed-group ANOVA found a significant gender effect for acoustic vowel distances, F(1,8) = 8.66, p = .02, with a significant Task × Gender interaction, F(3, 24) = 4.375, p = .01; however, no significant differences between males and females were found for lingual displacements. Female talkers produced significantly greater vowel distances than did male talkers during slow (mean difference = 472.14Hz, SE = 130.3), loud (mean difference = 536.70 Hz, SE = 143.3), and typical (mean difference = 420.24, SE = 120.6) speech. Moreover, the mean difference in acoustic vowel distance between loud and typical speech approached statistical significance after covarying gender effects (p = .05).
Phonetic Variability
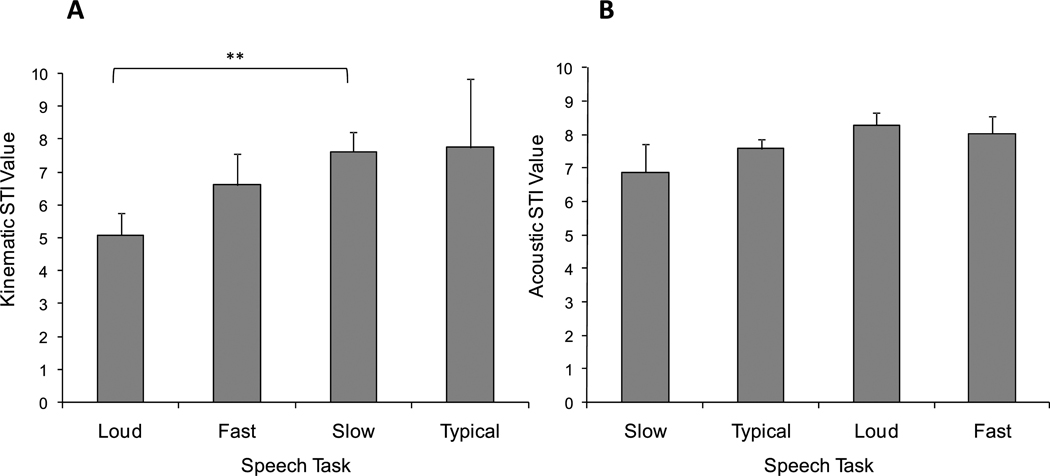
For each domain (kinematic and acoustic), one STI value was calculated for each participant for each speech task. Panels A and B of Figure 10 display the main effects for articulatory and acoustic variability, respectively. A one-way within-subjects ANOVA yielded a significant task effect for articulatory variability, F(3, 24) = 3.27, p = .04. However, only loud speech was significantly less variable than slow speech, t(9) = −3.21, p = .01. Loud speech tended to be less variable than typical and fast speech, typical speech tended to be less variable than slow and fast speech, and fast speech tended to be less variable than slow speech. A one-way within-subjects ANOVA revealed no significant task effects for acoustic variability. Further, gender effects were not found in the kinematic or acoustic domain for the STI values.
Figure 10.
Speech task effects for phonetic variability. Panel A displays the mean of the kinematic spatiotemporal index (STI) values (+ SE) for each speech task (N = 10). The tasks are shown in ascending order with the lowest STI value on the left side. The mean acoustic STI values (+ SE) for each speech task (N = 10) are shown in Panel B. **p < .01.
Descriptive Evaluation of the Hypothetical Framework
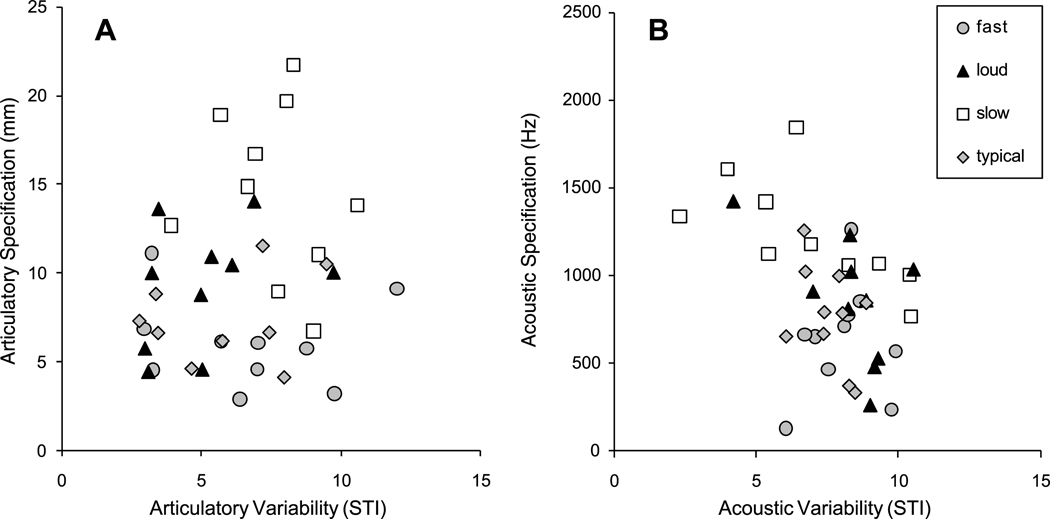
Figure 11 shows the articulatory (Panel A) and acoustic (Panel B) results of the hypothetical framework for rate and intensity effects on phonetic specification and variability. In the kinematic domain, articulatory performance measures for slow speech were primarily located in the region of high articulatory specification and high kinematic variability. In contrast to slow speech, the results for loud, fast, and typical speech were talker specific.
Figure 11.
Testing the experimental framework. In Panel A, articulatory specification is displayed as a function of kinematic variability. Articulatory specification is represented as the mean of the lingual displacements (n = 5) in each speech task for each talker. Variability is represented as the resulting kinematic STI value of five trajectories in each speech task for each talker. One outlier was removed for the typical and fast speech tasks. In Panel B, acoustic specification is displayed as a function of acoustic variability. Acoustic specification is represented as the mean of the vowel distance (n = 5) in each speech task for each talker. Variability is represented as the resulting acoustic STI value of five trajectories in each speech task for each talker.
The acoustic results were similar to the kinematic findings with respect to specification; however, the spread along the x-axis (variability) tended to be smaller. Moreover, for some talkers, slow speech tended to be more specified and less variable than other conditions.
Discussion
In this study, 10 typical adult talkers systematically varied their speaking rate and loudness to elicit changes in tongue kinematics along two dimensions that presumably impact speech clarity and intelligibility: articulatory specification and variability. Task-specific changes in specification and variability of both tongue and formant trajectories were measured. The data were used to examine articulatory-to-acoustic relations in response to speaking rate and loudness changes.
Changes in tongue displacement were strongly correlated with changes in acoustic vowel distance, whereas changes in tongue movement spatiotemporal variability were not associated with changes in formant variability. Furthermore, our experimental framework for predicting the effects of speaking task on specification and variability on articulatory kinematics was confirmed only for some talkers during slow speech.
Articulatory-to-Acoustic Relations for Phonetic Specification
Changes in phonetic specification in the articulatory and acoustic domains were strongly correlated across and within talkers. Although females and males exhibited a similar degree of articulatory specification (specifically during slow, loud, and typical speech), female talkers exhibited significantly greater acoustic specification than did male talkers. This finding may be due to vocal tract size differences between males and females (Fant, 1975). Specifically, because females have smaller vocal tracts than males, an equivalent degree of articulatory specification may produce relatively greater acoustic specification in females than in males. The gender difference in the acoustic domain may explain earlier findings of perceptual studies showing that the vowels of females were more intelligible during clear speech in noise compared with the vowels of males (Bradlow & Bent, 2002; Ferguson, 2004).
Task-related changes in articulatory displacements and acoustic vowel distances occurred in the predicted direction (fast < typical < loud < slow) and were in accordance with previous studies (for studies on kinematics, see Dromey & Ramig, 1998; Goozee et al., 2005; Huber & Chandrasekaran, 2006; Kent & Moll, 1972; Tasko & McClean, 2004; and Schulman, 1989; for studies on acoustics, see Gay, 1968; Lindblom, 1963; Tjaden & Wilding, 2004; Turner et al., 1995).
The observation that kinematic specification was well preserved in the acoustic domain suggests that this indicator of articulatory performance may have important clinical implications for treatments designed to improve speech intelligibility. Specifically, individuals with compromised speech intelligibility may benefit from therapies designed to maximize the specification of speech movements. In this study on healthy talkers, the greatest degree of articulatory specification was achieved through reductions in speaking rate. This effect was consistent across speakers in both the articulatory and acoustic domains.
Overall, the effect of loud speech on articulatory and acoustic specification was not as large and consistent across talkers as was the effect of slow speech. As mentioned previously, loud speech was significantly more specified than typical speech in the articulatory kinematic domain; however, acoustic vowel distances during loud speech were highly variable across talkers and, consequently, not statistically different from typical speech. After covarying gender effects to reduce variability among talkers, differences in acoustic specification between typical and loud speech approached statistical significance.
In one of the 10 talkers in this study, articulatory specification was not predictive of acoustic specification. In this case, only minimal increases in articulatory specification elicited disproportionally large increases in acoustic specification. One possibility is that this talker moved other parts of the vocal tract (i.e., tongue root, larynx) instead of or in addition to the tongue dorsum to produce the target vowels. Thus, future studies are warranted to explore talker-specific articulatory responses to task demands to fully understand the factors that influence the articulatory-to-acoustic relationship.
Articulatory-to-Acoustic Relations for Phonetic Variability
Current understanding about the influence of movement variability on speech acoustics, speech clarity, and speech intelligibility is very limited. In our healthy talkers, the degree of kinematic variability did not predict the degree of acoustic variability, even though speaking rate and loudness manipulations elicited a wide range of STI values in both domains. This lack of correspondence between articulatory and acoustic variability raises questions regarding the extent to which the observed articulatory variability contributes to intelligibility impairments. However, our results are based on healthy talkers and, therefore, should be considered tentative because kinematic variability is expected to be greater in talkers with speech motor impairments than in our neurologically intact talkers. Moreover, in individuals with impaired speech, articulatory variability may interact with articulatory imprecision in ways that are detrimental to speech intelligibility.
A potential limitation of this study is that very short and simple signals were analyzed to determine phonetic variability. Previous studies have typically measured articulatory movements associated with multiple words in an entire sentence (e.g., “Buy Bobby a puppy”). The use of a very short target utterance was, however, necessary for the analysis of continuous formant trajectories. This concern was mitigated by the findings that a range of kinematic variability was elicited in response to speaking rate and loudness changes and that these changes are in agreement with prior findings (Huber & Chandrasekaran, 2006; Kleinow et al., 2001). Therefore, although the use of short and simple signals probably accounted for the relatively low STI values obtained in this study in comparison with those reported in previous studies, it did not appear to be a confounding factor.
In contrast to articulatory movements, the spatiotemporal variability of formant movements has rarely been studied. One of the few existing studies found that the shape of formant movements was distinct for slow and habitual speech (Berry & Weismer, 2003); however, the variability of formant movements within a speaking rate condition was not examined in their study. In the present study, speaking rate or loudness changes did not appear to affect the spatiotemporal variability of formant movements, even though the movement shapes across speech tasks may have differed.
Our approach of correlating movement variability of a single lingual fleshpoint with movement variability of formants will not account for the potential effect of other vocal tract movements (i.e., larynx height, tongue root, degree of lip rounding and protrusion) on acoustic change. This study, however, was designed to minimize these effects. Specifically, we chose a stimulus utterance (/ia/) that elicited large movements of the posterior tongue and attached a tracking sensor to that region. The effectiveness of this approach was supported by the phonetic specification findings, in which we observed very strong correlations between posterior tongue movement and formant change. Based on these findings, we might expect to observe similar associations for phonetic variability between the two domains if similar associations existed. Future investigations correlating vocal tract area functions with formant change are needed to resolve this issue.
Quantal Theory and Present Findings
Although the present investigation was not specifically designed to test the quantal theory (Stevens, 1972, 1989), the strong linear association observed in this study between articulatory and acoustic specification is not consistent with the notion of nonlinear relations between the scaling of vocal tract movement and its associated acoustic output. Perhaps speaking rate and loudness manipulations elicited articulatory changes that were too coarse to observe quantal effects. In the present study, quantal relations may, however, account for the poor association observed between kinematic and acoustic variability. In contrast to the articulatory changes in phonetic specification, the magnitude of the deviations in articulatory movements that constitute phonetic variability may be smaller and, therefore, less likely to engender acoustic change. In addition, the observed acoustic stability could also be the result of motor equivalence, in which other vocal tract structures (i.e., jaw, lips) are working with the tongue to minimize acoustic variability. Although additional studies are needed to understand the functional significance of quantal effects on phonetic variability, the present findings motivate additional studies to examine the possibility that speech acoustics may be relatively unaffected by small amounts of articulatory variability as quantified by the STI.
One limitation of using the principal component and STI approaches to address movement variability is that inconsistencies across trials in the spatial locations and the magnitude of change are not well preserved in both kinematic and acoustic space. Despite this limitation, the preserved variability in the kinematic domain was systematic across tasks, which allowed us to determine if this variability was expressed in the acoustic domain.
Descriptive Results of the Hypothetical Framework: Kinematic and Acoustic Findings
Improved knowledge about (a) how speaking rate and loudness manipulations affect articulatory performance measures and (b) how changes in the kinematic domain are reflected in the acoustic domain will have important clinical implications because rate and loudness manipulations are commonly used to improve speech intelligibility. Our hypothetical framework relates changes in phonetic specification and variability to their potential effects on speech clarity and intelligibility. Based on previous findings of jaw and lip movements, we hypothesized that loud speech would elicit both highly specified and stable articulatory movements of the tongue (Dromey & Ramig, 1998; Huber & Chandrasekaran, 2006; Kleinow et al., 2001; Schulman, 1989), whereas slow speech would elicit highly specified articulatory movements that were more variable relative to the other speech tasks (Adams et al., 1993; Kleinowet al., 2001;Tasko & McClean, 2004). For slow speech, articulatory specification was significantly higher than all other speech conditions, and articulatory variability was significantly higher than loud speech.
In the acoustic domain, phonetic specification and variability did not follow the predicted pattern across tasks and speakers; however, slow speech was significantly more specified and tended to be less variable, acoustically, than any other speech tasks. The low acoustic variability finding for slow speech was in the opposite direction of that predicted by the kinematic findings in our framework. The finding of high acoustic specification and low acoustic variability during slow speech suggests that in healthy talkers, a speaking rate reduction may be an effective articulatory strategy to enhance speech clarity. The extent to which these findings have implications for improving speech intelligibility in persons with dysarthria requires further investigation.
Acknowledgments
This research was supported by Barkley Trust and Research Grant Number R01 DC009890 from the National Institute on Deafness and Other Communication Disorders, awarded to the second author. We would like to thank Erin Wilson, Ignatius Nip, and Yana Yunusova for their helpful comments on earlier versions of this article.
Footnotes
Parts of this work were presented at the American Speech-Language-Hearing Association Convention in San Diego, California (November 2005); at the Motor Speech Conference in Austin, Texas (March, 2006); and at the International Conference on Speech Motor Control in Nijmegen, the Netherlands (June 2006).
References
- Adams SG, Weismer G, Kent RD. Speaking rate and speech movement velocity profiles. Journal of Speech and Hearing Research. 1993;36:41–54. doi: 10.1044/jshr.3601.41. [DOI] [PubMed] [Google Scholar]
- Beckman ME, Jung T-P, Lee S-H, de Jong K, Krishnamurthy AK, Ahalt SC, Cohen KB. Variability in the production of quantal vowels revisited. The Journal of the Acoustical Society of America. 1995;97:471–490. [Google Scholar]
- Berry J, Weismer G. Effects of speaking rate on second formant trajectories of selected vocalic nuclei. The Journal of the Acoustical Society of America. 2003;113:3362–3378. doi: 10.1121/1.1572142. [DOI] [PubMed] [Google Scholar]
- Bradlow AR, Bent T. The clear speech effect for non-native listeners. The Journal of the Acoustical Society of America. 2002;112:271–283. doi: 10.1121/1.1487837. [DOI] [PubMed] [Google Scholar]
- Dromey C. Articulatory kinematics in patients with Parkinson disease using different speech treatment approaches. Journal of Medical Speech-Language Pathology. 2000;8:155–161. [Google Scholar]
- Dromey C, Ramig LO. Intentional changes in sound pressure level and rate: Their impact on measures of respiration, phonation, and articulation. Journal of Speech, Language, and Hearing Research. 1998;41:1003–1018. doi: 10.1044/jslhr.4105.1003. [DOI] [PubMed] [Google Scholar]
- Engstrand O. Articulatory correlates of stress and speaking rate in Swedish VCV utterances. The Journal of the Acoustical Society of America. 1988;83:1863–1875. doi: 10.1121/1.396522. [DOI] [PubMed] [Google Scholar]
- Fant G. Non-uniform vowel normalization. Speech Transmission Lab, Quarterly Progress Report (STL-QPSR) 1975;16(2–3):1–19. [Google Scholar]
- Ferguson SH. Talker differences in clear and conversational speech: Vowel intelligibility for normal-hearing listeners. The Journal of the Acoustical Society of America. 2004;116:2365–2373. doi: 10.1121/1.1788730. [DOI] [PubMed] [Google Scholar]
- Flege JE. Effects of speaking rate on the position and velocity of movements in vowel production. The Journal of the Acoustical Society of America. 1988;84:901–916. doi: 10.1121/1.396659. [DOI] [PubMed] [Google Scholar]
- Forrest K, Weismer G. Dynamic aspects of lower lip movements in Parkinsonian and neurological normal geriatric speakers’ production of stress. Journal of Speech, Language, and Hearing Research. 1995;38:262–270. doi: 10.1044/jshr.3802.260. [DOI] [PubMed] [Google Scholar]
- Gay T. Effect of speaking rate on diphthong formant movements. The Journal of the Acoustical Society of America. 1968;44:1570–1573. doi: 10.1121/1.1911298. [DOI] [PubMed] [Google Scholar]
- Gay T. Effect of speaking rate on vowel formant movements. The Journal of the Acoustical Society of America. 1978;63:223–230. doi: 10.1121/1.381717. [DOI] [PubMed] [Google Scholar]
- Gay T, Hirose H. Effects of speaking rate on labial consonant production. Phonetica. 1973;27:44–56. doi: 10.1159/000259425. [DOI] [PubMed] [Google Scholar]
- Gay T, Boe LJ, Perrier P. Acoustic and perceptual effects of changes in vocal tract constrictions for vowels. The Journal of the Acoustical Society of America. 1992;92:1301–1309. doi: 10.1121/1.403924. [DOI] [PubMed] [Google Scholar]
- Goozee JV, Murdoch BE, Theodoros DG, Stokes PD. Kinematic analysis of tongue movements in dysarthria following traumatic brain injury using electromagnetic articulography. Brain Injury. 2000;14:153–174. doi: 10.1080/026990500120817. [DOI] [PubMed] [Google Scholar]
- Goozee JV, Stephenson DK, Murdoch BE, Darnell RE, LaPointe LL. Lingual kinematic strategies used to increase speech rate: Comparison between younger and older adults. Clinical Linguistics & Phonetics. 2005;19:319–334. doi: 10.1080/02699200420002268862. [DOI] [PubMed] [Google Scholar]
- Green JR, Wilson EM, Wang Y-T, Moore CA. Estimating mandibular motion based on chin surface targets during speech. Journal of Speech, Language, and Hearing Research. 2007;50:928–939. doi: 10.1044/1092-4388(2007/066). [DOI] [PMC free article] [PubMed] [Google Scholar]
- Guenther FH, Espy-Wilson CY, Boyce SE, Matthies ML, Zandipour M, Perkell JS. Articulatory tradeoffs reduce acoustic variability during American English “r” production. The Journal of the Acoustical Society of America. 1999;105:2854–2865. doi: 10.1121/1.426900. [DOI] [PubMed] [Google Scholar]
- Hertrich I, Ackermann H. Lip-jaw and tongue-jaw coordination during rate-controlled syllable repetitions. The Journal of the Acoustical Society of America. 2000;107:2236–2247. doi: 10.1121/1.428504. [DOI] [PubMed] [Google Scholar]
- Hoole P, Kühnert B. Patterns of lingual variability in German vowel production; Proceedings of the International Conference on Phonetic Science; Stockholm, Sweden. 1995. Retrieved from http://www.phonetik.uni-muenchen.de/~hoole/pdf/philit_links.html. [Google Scholar]
- Huber JE, Chandrasekaran B. Effects of increased sound pressure level on lower lip and jaw movements. Journal of Speech, Language, and Hearing Research. 2006;21:173–187. doi: 10.1044/1092-4388(2006/098). [DOI] [PMC free article] [PubMed] [Google Scholar]
- Hughes O, Abbs JH. Labial-mandibular coordination in the production of speech: Implications for the operation of motor equivalence. Phonetica. 1976;44:199–221. doi: 10.1159/000259722. [DOI] [PubMed] [Google Scholar]
- Jaeger M, Hertrich I, Stattrop U, Schönle P-W, Ackermann H. Speech disorders following severe traumatic brain injury: Kinematic analysis of syllable repetitions using electromagnetic articulography. Folia Phoniatrica et Logopaedica. 2000;52:187–196. doi: 10.1159/000021533. [DOI] [PubMed] [Google Scholar]
- Kent RD, Moll KL. Cinefluorographic analyses of selected lingual consonants. Journal of Speech and Hearing Research. 1972;15:453–473. doi: 10.1044/jshr.1503.453. [DOI] [PubMed] [Google Scholar]
- Kent R, Netsell R, Bauer L. Cineradiographic assessment of articulatory mobility in the dysarthrias. Journal of Speech and Hearing Disorders. 1975;40:467–480. doi: 10.1044/jshd.4004.467. [DOI] [PubMed] [Google Scholar]
- Kleinow J, Smith A, Ramig LO. Speech motor stability in IPD: Effect of rate and loudness manipulations. Journal of Speech, Language, and Hearing Research. 2001;44:1041–1051. doi: 10.1044/1092-4388(2001/082). [DOI] [PubMed] [Google Scholar]
- Kuehn DP, Moll KL. A cineradiographic study of VC and CV articulatory velocities. Journal of Phonetics. 1976;4:303–320. [Google Scholar]
- Lashley KS. The problem of serial order in behavior. In: Jeffress LA, editor. Cerebral mechanisms in behavior. New York: Wiley; 1951. pp. 1122–1131. [Google Scholar]
- Lindblom B. A spectrographic study of vowel reduction. The. Journal of the Acoustical Society of America. 1963;35:1773–1781. [Google Scholar]
- Lindblom B. Explaining phonetic variation: A sketch of the H and H theory. In: Hardcastle W, Marshal A, editors. Speech production and speech modeling. Dordrecht, the Netherlands: Kluwer Academic Publishers; 1990. pp. 403–439. [Google Scholar]
- McClean MD. Patterns of orofacial movement velocity across variations in speech rate. Journal of Speech, Language, and Hearing Research. 2000;43:205–216. doi: 10.1044/jslhr.4301.205. [DOI] [PubMed] [Google Scholar]
- McHenry MA. The effect of pacing strategies on the variability of speech movement sequences in dysarthria. Journal of Speech, Language, and Hearing Research. 2003;46:702–710. doi: 10.1044/1092-4388(2003/055). [DOI] [PubMed] [Google Scholar]
- McHenry MA. Variability within and across physiological systems in dysarthria: A comparison of STI and VOT. Journal of Medical Speech-Language Pathology. 2004;12:179–182. [Google Scholar]
- Neilson PD, O’Dwyer NJ. Reproducibility and variability in athetoid dysarthria of cerebral palsy. Journal of Speech and Hearing Research. 1984;27:502–517. doi: 10.1044/jshr.2704.502. [DOI] [PubMed] [Google Scholar]
- Nelson WL, Perkell JS, Westbury JR. Mandible movements during increasingly rapid articulations of single syllables: Preliminary observations. The Journal of the Acoustical Society of America. 1984;75:945–951. doi: 10.1121/1.390559. [DOI] [PubMed] [Google Scholar]
- Payton KL, Uchanski RM, Braida LD. Intelligibility of conversational and clear speech in noise and reverberation for listeners with normal and impaired hearing. The Journal of the Acoustical Society of America. 1994;95:1581–1592. doi: 10.1121/1.408545. [DOI] [PubMed] [Google Scholar]
- Perkell JS. Properties of the tongue help to define vowel categories: Hypotheses based on physiologically oriented modeling. Journal of Phonetics. 1996;24:3–22. [Google Scholar]
- Perkell JS, Matthies M, Lane H, Guenther F, Wilhelms Tricarico R, Wozniak J, Guiod P. Speech motor control: Acoustic goals, saturation effects, auditory feedback and internal models. Speech Communication. 1997;22(2–3):227–249. [Google Scholar]
- Perkell JS, Matthies ML, Svirsky MA, Jordan MI. Trading relations between tongue-body raising and lip rounding in production of the vowel /u/: A pilot motor equivalence study. The Journal of the Acoustical Society of America. 1993;93:2948–2961. doi: 10.1121/1.405814. [DOI] [PubMed] [Google Scholar]
- Perkell JS, Nelson WL. Variability in production of the vowels /i/ and /a/ The Journal of the Acoustical Society of America. 1985;77:1889–1895. doi: 10.1121/1.391940. [DOI] [PubMed] [Google Scholar]
- Schulman R. Articulatory dynamics of loud and normal speech. The Journal of the Acoustical Society America. 1989;85:295–312. doi: 10.1121/1.397737. [DOI] [PubMed] [Google Scholar]
- Sjölander K, Beskow J. Wavesurfer (Version 1.8.5) [Computer software] Stockholm, Sweden: KTH Centre for Speech Technology; 2006. [Google Scholar]
- Smith A, Goffman L, Zelaznik HN, Ying G, McGillem C. Spatiotemporal stability and patterning of speech movement sequences. Experimental Brain Research. 1995;104:493–501. doi: 10.1007/BF00231983. [DOI] [PubMed] [Google Scholar]
- Smith A, Kleinow J. Kinematic correlates of speaking rate changes in stuttering and normally fluent adults. Journal of Speech, Language, and Hearing Research. 2000;43:521–536. doi: 10.1044/jslhr.4302.521. [DOI] [PubMed] [Google Scholar]
- Stevens KN. The quantal nature of speech: Evidence from articulatory-acoustic data. In: Denes PB, David EE Jr, editors. Human communication: A unified view. New York: McGraw-Hill; 1972. pp. 51–66. [Google Scholar]
- Stevens KN. On the quantal nature of speech. Journal of Phonetics. 1989;17:3–45. [Google Scholar]
- Tasko ST, McClean MD. Variations in articulatory movement with changes in speech task. Journal of Speech, Language, and Hearing Research. 2004;47:85–100. doi: 10.1044/1092-4388(2004/008). [DOI] [PubMed] [Google Scholar]
- The MathWorks. MATLAB and Simulink (Version 2007b) [Computer software] Natick, MA: Author; 2007. [Google Scholar]
- Tjaden K, Weismer G. Speaking-rate-induced variability in F2 trajectories. Journal of Speech, Language, and Hearing Research. 1998;41:976–989. doi: 10.1044/jslhr.4105.976. [DOI] [PubMed] [Google Scholar]
- Tjaden K, Wilding G. Rate and loudness manipulations in dysarthria: Acoustic and perceptual findings. Journal of Speech, Language, and Hearing Association. 2004;47:766–783. doi: 10.1044/1092-4388(2004/058). [DOI] [PubMed] [Google Scholar]
- Turner GS, Tjaden K, Weismer G. The influence of speaking rate on vowel distance and speech intelligibility for individuals with amyotrophic lateral sclerosis. Journal of Speech and Hearing Research. 1995;38:1001–1013. doi: 10.1044/jshr.3805.1001. [DOI] [PubMed] [Google Scholar]
- Yunusova Y, Green JR, Mefferd AS. Accuracy assessment of AG500, electromagnetic articulograph. Journal of Speech, Language, and Hearing Research. 2009;52:547–555. doi: 10.1044/1092-4388(2008/07-0218). [DOI] [PMC free article] [PubMed] [Google Scholar]
- Ziegler W, van Cramon D. Spastic dysarthria after acquired brain injury: An acoustic study. British Journal of Disorders of Communication. 1986;21:173–187. doi: 10.3109/13682828609012275. [DOI] [PubMed] [Google Scholar]


