Background: Inositol pyrophosphates mediate some effects of activated Plc1.
Results: Plc1 and Kcs1 activate early after release from G1 block and increase the level of InsP7 and InsP8.
Conclusion: Plc1- and Kcs1-mediated increase in pyrophosphates is important for progression through S phase.
Significance: This appears to be the first evidence for a link between Kcs1-generated pyrophosphates and cell cycle.
Keywords: Cell Signaling, Inositol Phosphates, Inositol Phospholipid, Phosphatidylinositol Signaling, Phospholipase C
Abstract
Several studies have demonstrated the activation of phosphoinositide-specific phospholipase C (Plc) in nuclei of mammalian cells during synchronous progression through the cell cycle, but the downstream targets of Plc-generated inositol 1,4,5-trisphosphate are poorly described. Phospholipid signaling in the budding yeast Saccharomyces cerevisiae shares similarities with endonuclear phospholipid signaling in mammals, and many recent studies point to a role for inositol phosphates, including InsP5, InsP6, and inositol pyrophosphates, in mediating the action of Plc. In this study, we investigated the changes in inositol phosphate levels in α-factor-treated S. cerevisiae, which allows cells to progress synchronously through the cell cycle after release from a G1 block. We found an increase in the activity of Plc1 early after release from the block with a concomitant increase in the levels of InsP7 and InsP8. Treatment of cells with the Plc inhibitor U73122 prevented increases in inositol phosphate levels and blocked progression of cells through S phase after pheromone arrest. The enzymatic activity of Kcs1 in vitro and HPLC analysis of [3H]inositol-labeled kcs1Δ cells confirmed that Kcs1 is the principal kinase responsible for generation of pyrophosphates in synchronously progressing cells. Analysis of plc1Δ, kcs1Δ, and ddp1Δ yeast mutants further confirmed the role that a Plc1- and Kcs1-mediated increase in pyrophosphates may have in progression through S phase. Our data provide genetic, metabolic, and biochemical evidence that synthesis of inositol pyrophosphates through activation of Plc1 and Kcs1 plays an important role in the signaling response required for cell cycle progression after mating pheromone arrest.
Introduction
In the past 20 years, several studies have demonstrated activation of phosphoinositide-specific phospholipase C (Plc)2 in nuclei of mammalian cells in response to external stimuli or during synchronous progression through the cell cycle. Insulin-like growth factor-mediated increase in the level of nuclear diacylglycerol and the activity of Plc-β1 isoform occurs independently from the classical pathway at the cell membrane (1–3). In synchronized leukemia cells, the same isoform was found to be activated during the G1 and G2/M phases of the cell cycle (4–6), the Plc-δ1 isoform showed cell cycle-dependent control of nuclear localization in NIH-3T3 fibroblasts (7), and two peaks of Plc activity were measured in nuclei of regenerating rat liver (8). Although an increase in the level of diacylglycerol and inositol trisphosphate (InsP3) has been detected in nuclei, there is a paucity of data on how these nuclear messengers regulate nuclear processes, and for some of them, like InsP3, there is no proof that they play the same role in regulation of calcium levels as the classical one at the cell membrane (9). Major progress in understanding the possible functional role of the pathway has been recently made by genetic and biochemical studies in the budding yeast Saccharomyces cerevisiae. Phospholipid signaling in yeast shares many similarities with endonuclear phosphoinositide signaling in mammals; yeasts have enzymes to generate nuclear PtdInsP2, and they have Plc1 encoded by a PLC1, which is a homolog of the mammalian Plc-δ1, but they lack important elements of the “classical” phosphoinositide signaling because they have no InsP3 receptor in their genome and do not utilize diacylglycerol to activate protein kinase C. However, yeast uses InsP3 as a precursor for the synthesis of higher inositol phosphates and pyrophosphates, and these products have been proven to regulate several important nuclear events (10). In yeast models, the possible role of higher inositol phosphates in the progression through the cell cycle has not been investigated, but the association of Plc1 with kinetochore has been found to be important for proper chromosome segregation and cell cycle progression (11).
In S. cerevisiae, inositol phosphates and pyrophosphates are generated by complex action of four different kinases, as shown in Fig. 1. Ins(1,4,5)P3 is first phosphorylated by dual specificity InsP3/InsP4 6-/3-kinase Ipk2 into Ins(1,4,5,6)P4 (InsP4) and Ins(1,3,4,5,6)P5 (InsP5), and Ipk1 then phosphorylates Ins(1,3,4,5,6)P5 into Ins(1,2,3,4,5,6)P6. The synthesis of diphosphoinositol phosphates or pyrophosphates in yeast is mediated by two kinases: Kcs1 phosphorylates InsP5 into 5-PP-InsP4 and phosphorylates InsP6 into 5-PP-InsP5 (InsP7); Vip1 phosphorylates InsP6 into InsP7 isomer 1-PP-InsP5. (PP)2-InsP4 (InsP8) is generated by either Kcs1-mediated phosphorylation of 1-PP-InsP5 or Vip1-mediated phosphorylation of 5-PP-InsP5. The majority of enzymes responsible for synthesis of inositol phosphates can be found in the nucleus, and all of them have been reported to have some role in nuclear processes (10). A major role of Ipk2 and its products, InsP4 and InsP5, is transcriptional regulation by modulation of chromatin remodeling in response to nutrients (12, 13). The yeast Ipk1 and its product, InsP6, regulate mRNA export (14) and nonhomologous end joining (15), Kcs1 activity modulates telomere length by generation of 5-PP-InsP4 (16), and Vip1-generated InsP7 binds to the cyclin-CDK-CDK inhibitor complex to regulate transcription of the yeast phosphate (Pi)-responsive (PHO) genes (17).
FIGURE 1.

The pathway involved in the synthesis of inositol phosphates in S. cerevisiae. InsP3 serves as a substrate for the inositol kinase Ipk2, which phosphorylates both the D-6 and D-3 position hydroxyl groups to produce InsP5. InsP5 is phosphorylated by Ipk1 at 2-hydroxyl to generate InsP6. The synthesis of diphosphoinositol phosphates is mediated by two kinases; Kcs1 phosphorylates InsP5 into 5-PP-InsP4 and InsP6 into 5-PP-InsP5 (InsP7), and Vip1 phosphorylates InsP6 into InsP7 isomer 1-PP-InsP5. (PP)2-IP4 (InsP8) is generated by either Kcs1-mediated phosphorylation of 1-PP-InsP5 or Vip1-mediated phosphorylation of 5-PP-InsP5.
In this study, we investigated changes in inositol phosphate levels in α-factor-treated S. cerevisiae, which allows cells to progress synchronously through the cell cycle after release from the G1 block. The results of this study show an increase in the activity of Plc1 early after release from the block with a concomitant increase in the level of InsP7 and InsP8. The increase in the level of inositol pyrophosphates was found to be due to the activation of Kcs1, which is necessary for the progression of the cells through the S phase of the cell cycle.
EXPERIMENTAL PROCEDURES
Reagents
Reagents were obtained from the following sources: all media and supplements for yeast growth from Formedium; α-factor mating pheromone from Zymo Research; U73122 from Calbiochem; glass beads (diameter 425–600 μm), RNase A, proteinase K, bovine brain extract (Type I, Folsch fraction V), InsP6, and PtdInsP2 from Sigma; [3H]PtdInsP2 (20 Ci/mmol) and [γ-32P]ATP (6,000 Ci/mmol) from PerkinElmer Life Sciences; [3H]inositol (30 Ci/mmol) from PerkinElmer Life Sciences or American Radiolabeled Chemicals; Calmodulin-Sepharose 4B from Amersham Biosciences; InsP5 from Cell Signaling; and Sytox from Invitrogen. All other chemicals were of analytical grade.
Yeast Strains, Growth Conditions
S. cerevisiae strains used in this study are isogenic with W303 MATa (leu2-3,112, his3-11,15, ura3-1, ade2-1, trp1-1, rad5-535, can1-100). Deletion strains ddp1::HIS3, kcs1::HIS3, plc1::KANMX were generated as described previously (16). For labeling experiments, cells were inoculated in synthetic medium without inositol with the addition of 5.7 mg/ml ammonium sulfate, 0.82 mg/ml amino acids, 2% glucose, and 5 μCi/ml [3H]inositol (labeling medium) and grown to achieve isotopic equilibrium (8–9 divisions) in a shaker incubator at 30 °C and 200 rpm (20). At the end of incubation, cells were collected, counted, resuspended in fresh labeling medium at a concentration of 2.5 × 10⁶/ml, grown into mid-logarithmic phase, and then incubated in the presence of 5 μm α-factor mating pheromone for 6 h (WT and ddp1Δ) or 24 h (kcs1Δ and plc1Δ). The G1-arrested cells were washed twice with synthetic medium lacking inositol, released into fresh labeling medium, and allowed to progress synchronously through the cell cycle. At the indicated time points, cells were harvested by centrifugation (2,000 × g, 4 °C, 4 min). For flow cytometric analysis, cells were grown as described above, except that cold inositol was added into the medium at the same concentration as [3H]inositol. At the indicated time points, 1 ml of cell suspension was harvested, fixed with 9 ml of 90% ethanol, and stored at −20 °C.
Extraction and Analysis of [3H]Inositol-labeled Phosphoinositides and Inositol Polyphosphates
For phosphoinositide analysis, the pellet was resuspended in 0.3 ml of 2:1 (v/v) methanol/water containing 0.08 m HCl, 6.7 mm Na2HPO4, 0.83 mm EDTA, and 0.83 mm EGTA and vortexed for 30 s. Acid-washed glass beads (0.8-g diameter, 425–600 μm) were added, and the slurry was alternately vortexed (30 s) and cooled on ice (30 s) through 10 cycles. Afterward, 0.47 ml of methanol (containing 0.12 m HCl) and 1.33 ml of chloroform were added, the slurry was vortexed (30 s), and the monophasic mixture was left on ice (15 min). Bovine brain phosphoinositides (10 μg, Type I, Folsch fraction V) were added in 2:1 (v/v) chloroform/methanol, and samples were vortexed (30 s) and cooled on ice. After adding 0.4 ml of a mixture of 0.1 m HCl, 0.1 m Na2HPO4, 5 mm tetra-n-butyl-ammonium hydrogen sulfate, 2.5 mm EDTA, and 2.5 mm EGTA, mixing yielded a two-phase system (separated at 3,000 × g, 5 min, 4 °C) (18). The chloroform-rich lower phase was transferred to a glass vial and dried in vacuo by roto-evaporation, and excess HCl was removed by repeated drying in vacuo with methanol. Lipids were deacylated (monomethylamine reagent, 53 °C, 50 min), and the separation of all of the glycerophosphoinositides was achieved using an HPLC high resolution 5 μm Partisphere SAX column (Whatman) with a discontinuous gradient up to 1 m (NH4)2HPO4 × H3PO4 (pH 3.8) exactly as described in a previous study (19).
For inositol polyphosphate analysis, the pellet was resuspended in 0.2 ml of extraction buffer (1 m HClO4, 3 mm EDTA, and 0.1 mg/ml InsP6), glass beads were added, and cells were disrupted by vortexing, as described above. After centrifugation for 1 min in a microcentrifuge, the soluble extract was transferred to a new tube, 0.2 ml of neutralization buffer (1 m K2CO3 and 3 mm EDTA) was added to achieve pH 6–8, neutralization was allowed overnight at 4 °C, the final volume was adjusted to 0.5 ml, and samples were filtered using Spin-X microcentrifuge tubes and stored for HPLC analysis. Separation of all the inositol phosphates was achieved using a high resolution 5 μm Partisphere SAX column (Whatman) at a flow rate of 1 ml/min, with a gradient generated by mixing buffers A (1 mm EDTA) and B 1.3 m (NH4)2HPO4 × H3PO4 (pH 3.8) as follows: 0–10 min, 0% buffer B; 10–75 min, 0–100% buffer B; 75–85 min, 100% buffer B using the Ultimate 3000 HPLC system (Dionex) (20).
Assay of Plc Activity
Cells were grown in a synthetic medium with cold inositol, synchronized, and harvested as described above. Pellet was resuspended in 0.2 ml of ice-cold lysis buffer (0.3 m mannitol, 0.1 m KCl, 50 mm Tris-HCl (pH 7.5), 1% Nonidet P-40, 50 mm NaF, 0.1 mm Na3VO4, 1 mm EGTA, 1 mm PMSF, 1 μg/ml leupeptin, and 1 μg/ml aprotinin), and cells were disrupted, as described above. The homogenate was centrifuged in a microcentrifuge at 14,000 × g for 5 min at 4 °C. The resultant supernatant was clarified by centrifugation at 90,000 × g for 60 min at 4 °C in a Beckman SW 27 rotor. Plc activity was measured as described by Crljen et al. (8). 100 μg of protein were incubated in 0.2 ml of assay buffer (100 mm NaCl, 50 mm, HEPES (pH 7.0), 200 μm CaCl2, 1 mg/ml bovine serum albumin, 100 μm PtdInsP2) and 50,000 cpm of [3H]PtdInsP2/assay. After 10 min at 37 °C, the reaction was stopped by adding 1 ml of chloroform/methanol (1:1, v/v), followed by 0.25 ml of 2.4 n HCl. After a brief centrifugation, the top phase was removed, and the amount of InsP3 was quantified by liquid scintillation counting.
Assay of InsP6 Kinase Activity
[32P]InsP6 was produced enzymatically in 0.3 ml of buffer (50 mm HEPES (pH 7.5), 1 mm EDTA, 50 mm KCl and 10 mm MgCl2) with 30 μl of [γ-32P]ATP, 45 μl of GST-atIpk1 (1 mg/ml), and 15 μl of InsP5 (100 μm). The reaction was run at 37 °C for 60 min, the enzyme was added once again after 30 min, and the enzyme was subsequently heat-inactivated at 95 °C for 10 min (21). Yeast Kcs1-TAP cells were grown in a synthetic medium and synchronized as described above. At the indicated time points, cells were harvested and disrupted using glass beads in 1 ml of ice-cold binding buffer (50 mm HEPES (pH 7.4) 150 mm NaCl, 10 mm 2-mercaptoethanol, 1 mm magnesium acetate, 1 mm imidazole, 2 mm CaCl2, 2 mm NaF, 1 mm PMSF, 1 μg/ml leupeptin, and 1 μg/ml aprotinin). The homogenate was centrifuged at 14,000 × g for 20 min at 4 °C. Calmodulin-Sepharose 4B (10 μl) was added to the supernatant and incubated at 4 °C for 2 h. The resin was washed twice with binding buffer containing 500 mm NaCl and then twice with 100 mm NaCl (22). The resin was then used to perform an InsP6 kinase assay using 50,000 cpm/assay of [32P]InsP6 in 20 μl of assay buffer (50 mm HEPES (pH 7.5), 100 mm KCl, 5 mm MgCl2, 1 mm ATP and 1 μm InsP6). The reaction was run for 30 min at 37 °C and terminated by adding 1 μl of 1 m HCl and placing on ice. After centrifugation for 1 min in a microcentrifuge, 5 μl of reaction mixture was spotted onto PEI-TLC plates and developed in a tank equilibrated with buffer containing 1.09 m KH2PO4, 0.72 m K2HPO4, 2.07 m HCl (21). After autoradiography, spots corresponding to InsP6 and InsP7 were scraped and counted for radioactivity in a liquid scintillation counter.
Flow Cytometric Analysis
Cells were washed by 50 mm sodium citrate, pH 7.4; sonicated; incubated in 50 mm sodium citrate, pH 7.4, containing 0.25 mg/ml of RNase A at 50 °C for 1 h; and then treated with 1 mg/ml of proteinase K at 50 °C for 1 h, washed, and resuspended in 50 mm sodium citrate containing 1 μm Sytox. The DNA fluorescence analyses were performed on at least 10,000 cells for each sample with the FACSCalibur system (BD Biosciences), and the data were analyzed using CellQuest and ModFit software (BD Biosciences).
Statistical Evaluation
The data are shown as means ± S.E. For statistical analysis, Student's t test for unpaired samples at a level of significance of 0.05 was used.
RESULTS
Yeast cells were grown in synthetic medium containing 0.2 μm inositol with an average cell doubling time of 3 h. To allow synchronous progression through the cell cycle, logarithmically growing cells were first incubated in the presence of α-factor for 6 h and then washed and released into fresh medium. An aliquot of cells was harvested at the indicated times, stained with Sytox, and analyzed by FACS. As shown in Fig. 2A, G1-arrested cells returned to a cycling state with the majority of cells completing S phase within 2 h after reseeding. To test for the possible de novo synthesis of inositol phospholipids and phosphates, a pulse experiment was performed by adding fresh medium containing 3H-labeled inositol to logarithmically growing cells or cells that were washed and released from α-factor block. The results demonstrated a significant increase in the incorporation of radiolabel into both PtdInsP2 (Fig. 2B) and InsP6 (Fig. 2C) 30–120 min after release from the block.
FIGURE 2.
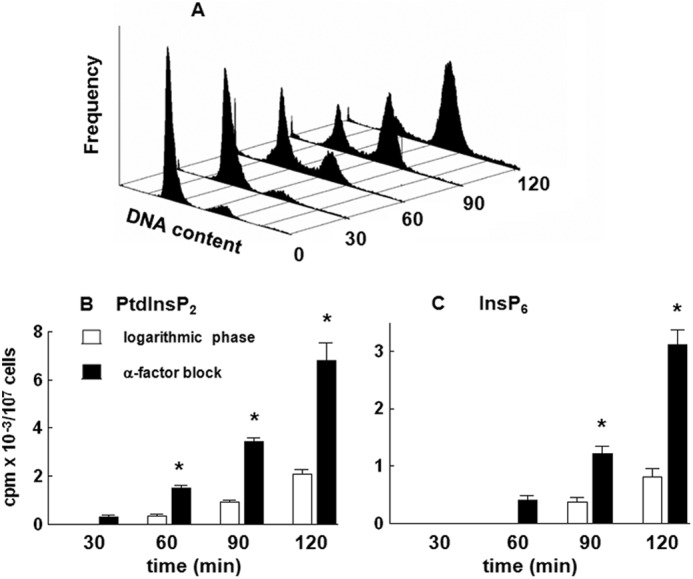
Release of the wild type yeast cells from α-factor block stimulates incorporation of [3H]inositol into PtdInsP2 and InsP6. Cells were synchronized in G1 with α-factor, released into fresh medium, harvested at the indicated times, stained with Sytox, and assessed for cell cycle distribution by flow cytometric analysis as described under “Experimental Procedures.” A, representative histogram. Logarithmic phase (open bars) or cells released from α-factor block (black bars) were pulse-labeled with 50 μCi/ml [3H]inositol for the indicated times, harvested, and analyzed for radiolabel incorporation into PtdInsP2 (B) and InsP6 (C) by HPLC as described under “Experimental Procedures.” The results are means ± S.E. (error bars) for three different experiments. *, p < 0.05 (Student's t test) with respect to logarithmic phase cells.
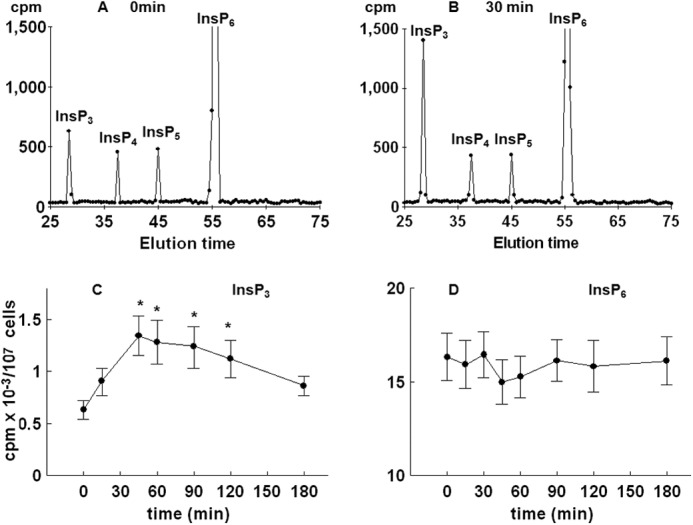
To further test for possible changes in the level of inositol phospholipids and phosphates, yeast cells were first cultured for 8–9 cell divisions in medium containing [3H]inositol and then synchronized by G1 arrest, released into fresh labeling medium, and allowed to progress synchronously through the cell cycle. Comparison of HPLC elution profiles of inositol phosphates at times 0 (Fig. 3A) and 30 min after release from the block (Fig. 3B) indicated an increase in the level of InsP3, a decrease in the level of InsP6 (not shown), an increase in two peaks eluted after InsP6 that corresponded to InsP7 and InsP8, and no changes in the level of InsP4 and InsP5. Time course analysis of the level of InsP3 in synchronized cells revealed a significant increase in the level as early as 15 min after the release from the block, the peak level was measured at 30 min, and the level returned to the basal level in G1-arrested cells at 90 min after release (Fig. 3C). As shown in Fig. 3D, time course analysis of the level of PtdInsP2 mirrored the changes in the level of InsP3, and both changes corresponded well with the time-dependent increase in the activity of Plc1 when measured in an assay that uses exogenous [3H]PtdInsP2 as a substrate (Fig. 3E).
FIGURE 3.
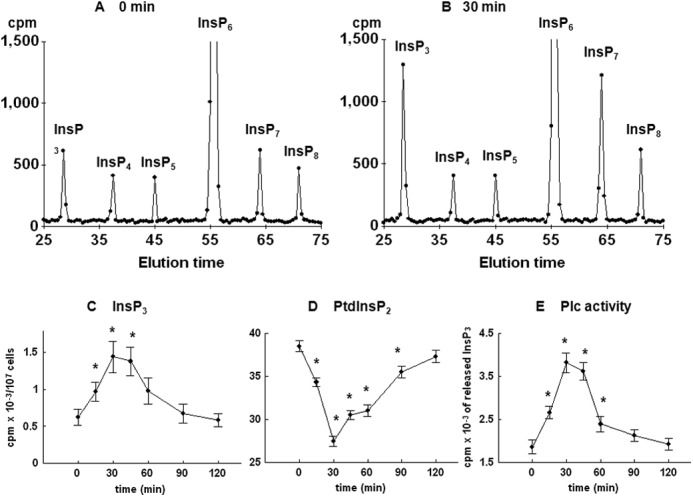
Release of the wild type yeast cells from α-factor block stimulates Plc activity. Cells were labeled, synchronized in G1 with α-factor, released into fresh medium, and harvested at the indicated times. Inositol lipids and phosphates were analyzed by HPLC, whereas Plc activity was assayed using PtdInsP2 as substrate as described under “Experimental Procedures.” Shown is the HPLC elution profile of inositol polyphosphates at time 0 (A) or 30 min after the release of the cells from α-factor block (B). Shown is the time course analysis of the level of InsP3 (C) and PtdInsP2 (D). E, Plc activity after the release of the cells from α-factor block. The results are means ± S.E. (error bars) for three different experiments. *, p < 0.05 (Student's t test) with respect to time 0.
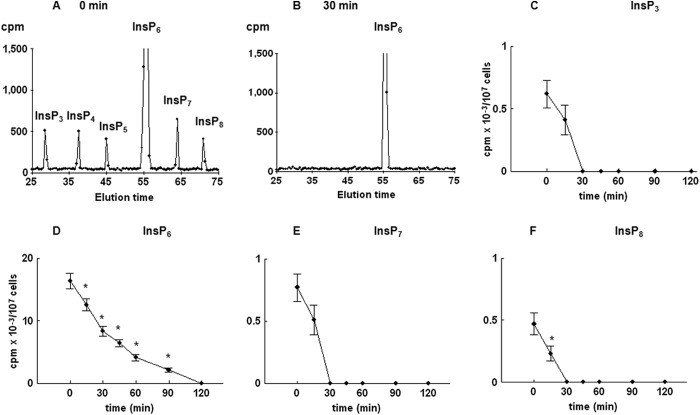
To confirm that observed changes in the level of PtdInsP2 and inositol phosphates were initiated by an increase in the activity of Plc1, labeled cells were synchronized in G1 with α-factor, washed, and released into fresh medium containing the commercially available Plc inhibitor U73122. Comparison of HPLC elution profiles of inositol phosphates at times 0 (Fig. 4A) and 30 min after release from the block in the presence of U73122 (Fig. 4B) confirmed that the presence of Plc inhibitor completely abolished all peaks eluted, except for the peak corresponding to InsP6. Furthermore, the presence of Plc inhibitor prevented time-dependent changes in the level of PtdInsP2 (results not shown); decreased the level of InsP3 (Fig. 4C), InsP7 (Fig. 4E), and InsP8 (Fig. 4F) as early as 15 min after release; and completely abolished the peaks at 30–120 min. Regarding InsP6, the time course analysis showed that the presence of U73122 caused a progressive decline in the level of InsP6, which reached zero at 120 min after release (Fig. 4D). It is important to note that 10 μm U73122 completely inhibited activity of Plc1 when assayed using exogenous [3H]PtdInsP2 as a substrate (results not shown).
FIGURE 4.
The effect of the Plc inhibitor (U73122) on the level of inositol phosphates in the wild type yeast cells released from α-factor block. Cells were labeled, synchronized in G1 with α-factor, released into fresh medium containing 10 μm U73122, and harvested at the indicated times, and inositol phosphates were analyzed by HPLC as described under “Experimental Procedures.” Shown is the HPLC elution profile of inositol phosphates at time 0 (A) or 30 min after the release of the cells from α-factor block (B). Shown is the time course of changes in the level of InsP3 (C), InsP6 (D), InsP7 (E), and InsP8 (F) after the release of the cells from α-factor block. The results are means ± S.E. (error bars) for three different experiments. *, p < 0.05 (Student's t test) with respect to time 0.
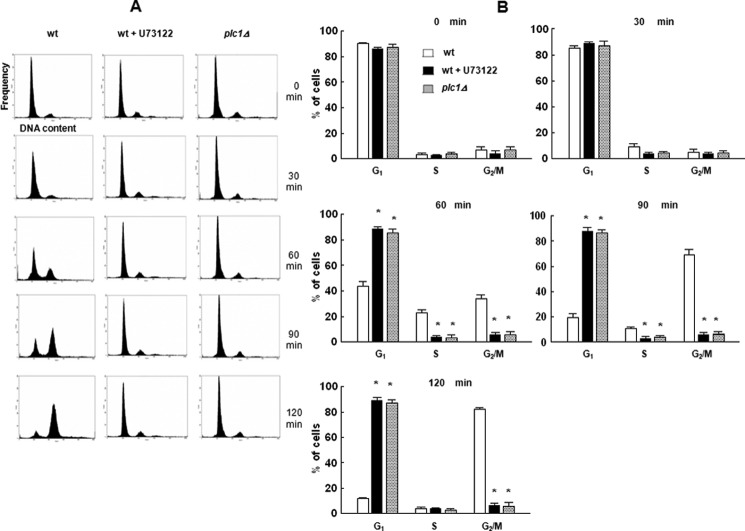
To test for the role of Plc1 activation in the progression through the cell cycle, FACS analysis was performed on wild type cells arrested by α-factor and released into medium in the presence of U73122 or vehicle (control). As shown in Fig. 5, the presence of Plc inhibitor completely prevented the progression through the S phase. A similar block in the progression through the cell cycle was observed in plc1Δ mutants, in which no inositol phosphates could be detected by HPLC (results not shown).
FIGURE 5.
Plc inhibitor (U73122)-treated wild type cells and plc1Δ cells do not progress through the S phase of the cell cycle. Cells were synchronized in G1 with α-factor, released into fresh medium or medium containing 10 μm U73122, harvested at the indicated times, stained with Sytox, and assessed for cell cycle distribution by flow cytometric analysis as described under “Experimental Procedures.” A, representative histograms. B, time course of changes in the percentage of the cells in G1, S, and G2/M phase. Open bars, wild type cells; black bars, wild type cells treated with inhibitor; gray bars, plc1Δ cells. The results are means ± S.E. (error bars) for three different experiments. *, p < 0.05 (Student's t test) with respect to wild type.
Time-dependent changes in the level of inositol phosphates were further investigated. As shown in Fig. 6, the time-dependent decrease in the levels of InsP6 (Fig. 6A) was mirrored by an increase in the level of both InsP7 (Fig. 6B) and InsP8 (Fig. 6C). In S. cerevisiae, Kcs1 is one of the two kinases responsible for the phosphorylation of InsP6 and generation of pyrophosphates (10). To test whether an increase in the level of InsP7 and InsP8 was due to the activity of Kcs1, endogenous Kcs1-TAP was purified from yeast cells harvested at different time points after release from the block and assayed for its ability to phosphorylate exogenous [32P]InsP6. As shown in Fig. 6D, an increase in the activity of Kcs1 in vitro paralleled the observed changes in the level of pyrophosphates.
FIGURE 6.
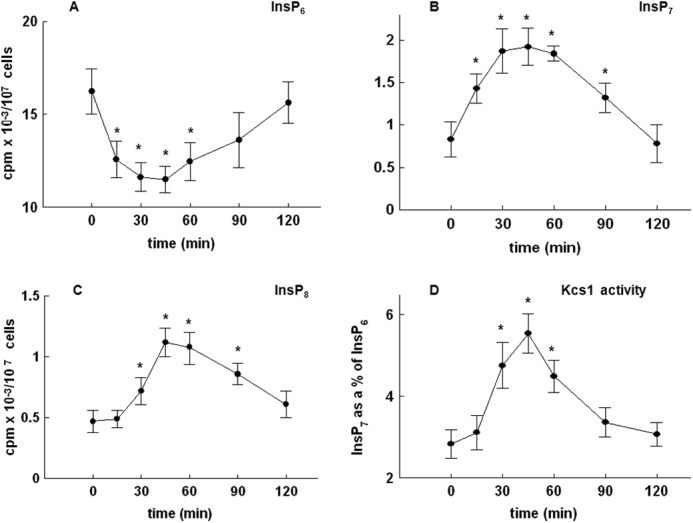
Release of the wild type yeast cells from α-factor block stimulates Kcs1 activity. Cells were labeled, synchronized in G1 with α-factor, released into fresh medium, and harvested at the indicated times. Inositol phosphates were analyzed by HPLC, whereas Kcs1 activity was assayed using InsP6 as the substrate as described under “Experimental Procedures.” Shown are the time course of changes in the level of InsP6 (A), InsP7 (B), and InsP8 (C) and Kcs1 activity (D) after the release of the cells from α-factor block. The results are means ± S.E. (error bars) for three different experiments. *, p < 0.05 (Student's t test) with respect to time 0.
The labeling experiments of the present study were performed by using synthetic medium containing only radiolabeled inositol (5 μCi/ml), which results in a final concentration of inositol (0.2 μm) that is significantly lower than the 11 μm inositol concentration in complete standard synthetic medium. To rule out the possibility that the observed changes in the level of inositol phosphates were influenced by a lack of inositol in labeling medium, two additional sets of experiments were performed using different labeling protocols. First, cells were labeled using synthetic medium containing only radiolabeled inositol, but at a concentration (50 μCi/ml [3H]inositol) that increases the final concentration to 2 μm. In a second protocol, cells were labeled using standard synthetic complete medium (containing 11 μm unlabeled inositol) that was supplemented with 10 μCi/ml [3H]inositol, which results in a total inositol concentration of 11.4 μm (16). Again, labeled cells were arrested with α-factor, released into fresh labeling medium, and allowed to progress synchronously through the cell cycle. As shown in Fig. 7, the time course changes in the levels of InsP3, InsP6, InsP7, and InsP8 for both labeling protocols follow a similar pattern when compared with time course changes of the level of inositol phosphates extracted from the cells that were labeled using synthetic medium containing only 5 μCi/ml [3H]inositol (Figs. 3C and 6, A–C). Furthermore, the proportion of radioactivity in each of the inositol phosphates, for each time point, using different labeling protocols is similar (1:4.3:0.6). Similar to results obtained using labeling medium containing 5 μCi/ml [3H]inositol (Fig. 3, A and B), no time-dependent changes in the level of InsP4 andInsP5 were observed using additional labeling protocols, but still the proportions of radioactivity in each of the inositol phosphates were similar to the ones observed above (1:4.3:0.6) (results not shown). Therefore, although the amount of radioactivity that can be determined in each of the inositol phosphates varies because of different amounts of labeled and unlabeled inositol used in labeling medium, it can be concluded that cells reach isotopic equilibrium in all labeling conditions tested, including the one using only 5 μCi/ml [3H]inositol in labeling medium, as has been suggested by Azevedo and Saiardi (20).
FIGURE 7.
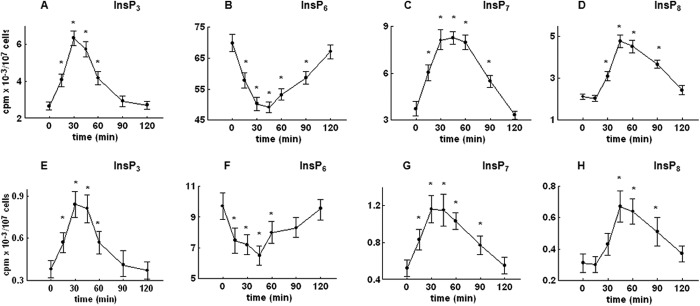
The effect of different labeling protocols on the level of inositol phosphates in the wild type yeast cells released from α-factor block. Cells were labeled using synthetic medium containing 50 μCi/ml [3H]inositol (top) or standard synthetic complete medium containing 11 μm unlabeled inositol, supplemented with 10 μCi/ml [3H]inositol (bottom). Cells were synchronized in G1 with α-factor, released into fresh medium, and harvested at the indicated times, and inositol phosphates were analyzed by HPLC as described under “Experimental Procedures.” Shown is the time course of changes in the level of InsP3 (A and E), InsP6 (B and F), InsP7 (C and G), and InsP8 (D and H) after the release of the cells from α-factor block. The results are means ± S.E. (error bars) for three different experiments. *, p < 0.05 (Student's t test) with respect to time 0.
To further assess the physiological role of Kcs1-generated pyrophosphates in cell cycle progression, yeast strains with mutations in enzymes involved in pyrophosphate metabolism were investigated. HPLC analysis of [3H]inositol-labeled kcs1Δ strain cells revealed no peaks eluted after InsP6 in α-factor arrested cells (Fig. 8A) or cells collected 30 min after release from the block (Fig. 8B), confirming that Kcs1 participates in mediating changes observed in pyrophosphates in synchronously progressing cells. In contrast, the lack of Kcs1 activity had no effects on Plc1 activation because the level of InsP3 (Fig. 8, A and B) and time-dependent changes of InsP3 (Fig. 8C) in cells released from the block were similar to those observed in wild type cells. The basal level of InsP6 measured in the kcs1Δ strain was similar to the one in wild type cells, suggesting that the deletion of KCS1 does not alter InsP6 levels, as previously described (16). In contrast to wild type cells, the time course analysis of the level of InsP6 in synchronized cells showed no significant decrease at any time point after release from the block (Fig. 8D).
FIGURE 8.
Changes in inositol phosphate levels in kcs1Δ cells following the release from α-factor block. Cells were labeled, synchronized in G1 with α-factor, released into fresh medium, and harvested at the indicated times, and inositol phosphates were analyzed by HPLC as described under “Experimental Procedures.” HPLC elution profile of inositol polyphosphates at time 0 (A) or 30 min after the release of the cells from α-factor block (B). Time course of changes in the level of InsP3 (C) and InsP6 (D) after the release of the cells from α-factor block. The results are means ± S.E. for three different experiments. *, p < 0.05 (Student's t test) with respect to time 0.
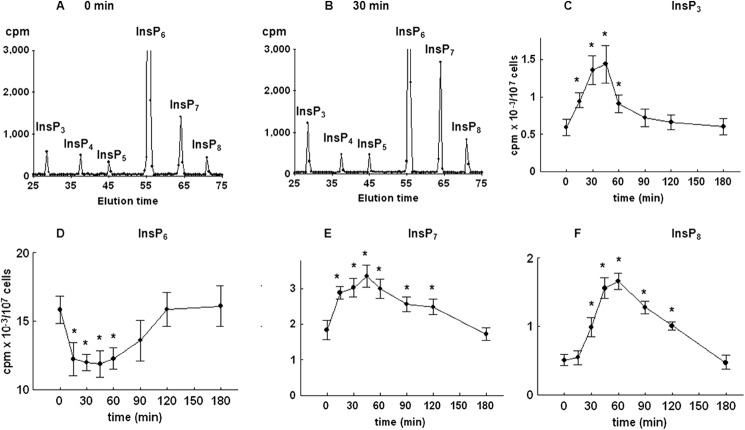
DDP1 encodes a diphosphoinositol-polyphosphate phosphatase that dephosphorylates both InsP8 and InsP7 down to InsP6 (23); disruption of the DDP1 gene in yeast strain ddp1Δ increases the level of pyrophosphates (16). When labeled ddp1Δ cells were arrested by the presence of α-factor, HPLC analysis revealed an increase in the basal level of InsP7 (Fig. 9A) in comparison with wild type cells (Fig. 3A). At 30 min after release from the block, the increase in the peaks corresponding to pyrophosphates (Fig. 9B) was more prominent than the increase in wild type cells (Fig. 3B). Similar to wild type cells, the time-dependent decline in the level of InsP6 (Fig. 9D) was mirrored by an increase in both InsP7 (Fig. 9E) and InsP8 (Fig. 9F).
FIGURE 9.
Changes in inositol phosphate levels in ddp1Δ cells following the release from α-factor block. Cells were labeled, synchronized in G1 with α-factor, released into fresh medium, and harvested at the indicated times, and inositol phosphates were analyzed by HPLC as described under “Experimental Procedures.” Shown is the HPLC elution profile of inositol polyphosphates at time 0 (A) or 30 min after the release of the cells from α-factor block (B). Shown is the time course of changes in the level of InsP3 (C), InsP6 (D), InsP7 (E), and InsP8 (F) after the release of the cells from α-factor block. The results are means ± S.E. for three different experiments. *, p < 0.05 (Student's t test) with respect to time 0.
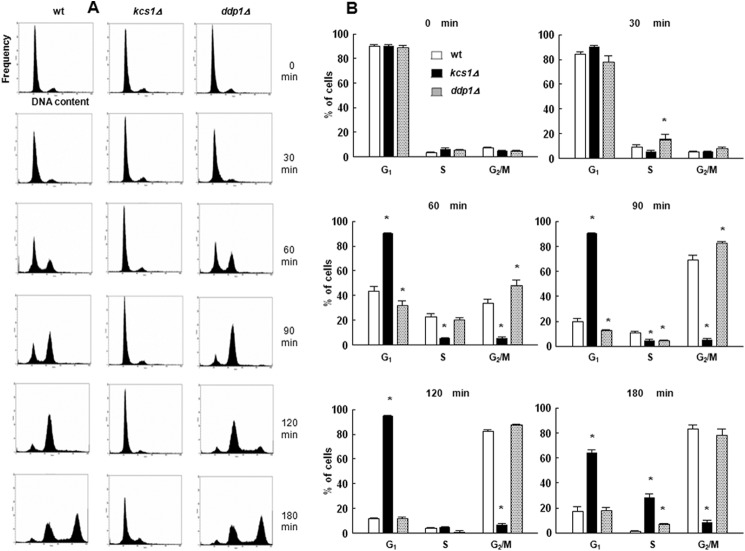
Both mutant yeast strains were subjected to FACS analysis. As shown in Fig. 10, kcs1Δ cells remain arrested in G1 phase up to 120 min after being washed from α-factor and start to show some progression into S phase at 180 min after release. In contrast, the majority of G1-arrested and released ddp1Δ cells reached G2/M phase earlier than wild type cells.
FIGURE 10.
Progression of kcs1Δ and ddp1Δ cells through the cell cycle following the release from α-factor block. Cells were synchronized in G1 with α-factor, released into fresh medium, harvested at the indicated times, stained with Sytox, and assessed for cell cycle distribution by flow cytometric analysis as described under “Experimental Procedures.” A, representative histograms. B, time course of changes in the percentage of the cells in G1, S, and G2/M phase. Open bars, wild type cells; black bars, kcs1Δ cells; gray bars, ddp1Δ cells. The results are means ± S.E. for three different experiments. *, p < 0.05 (Student's t test) with respect to wild type.
DISCUSSION
Although a search of the literature reveals many studies related to phosphoinositide signaling in regulation of the cell cycle, there are few studies that report cell cycle-associated changes in the levels of higher inositol phosphates or pyrophosphates, and all of these have been performed in mammalian cells (24, 25). The route of synthesis of higher inositol phosphates and pyrophosphates in mammalian cells is much more complicated than the pathway operating in yeast cells; e.g. there are at least three different mammalian isoforms of inositol hexakisphosphate kinases instead of two in yeasts and four mammalian diphosphoinositol-polyphosphate phosphatases instead of a single Ddp1 in yeasts (26). However, the common theme between yeasts and mammals is that the synthesis of higher inositol phosphates starts with InsP3 being generated by a Plc-mediated hydrolysis of PtdInsP2.
The results of our study demonstrate an early activation of Plc1 in yeast cells allowed to progress synchronously through S phase after the release from G1 block. A significant delay in cell cycle progression of deletion mutants of the PLC1 gene (that make no InsP3–8) as well as wild type cells released from the block in the presence of a Plc inhibitor suggests that Plc1 activation has a functional role in progression through S phase during mating pheromone signaling. In S. cerevisiae, there is only one Plc1 encoded by the gene PLC1 (9, 10). In mammalian cells, at least 13 Plc isoforms have been identified, and many of them, including Plc-β, -γ, -δ, and - ζ, have been found to be activated in nuclei of cells at a particular phase of the cell cycle (27). A sole Plc1 in yeasts corresponds best to the mammalian Plc-δ1, and this is the isoform that has been most consistently found to be associated with nuclei of mammalian cells somewhere at the beginning of S phase. In regenerating rat liver, Plc-δ1 participated in the increase in the Plc activity in nuclei at 20 h after hepatectomy (8). In synchronized NIH3T3 cells, the level of Plc-δ1 in nuclei increased at the G1/S boundary (7), and “knockdown” of Plc-δ1 in rat C6 glioma cells significantly decreased proliferation and delayed the progression through S phase (28). Enhanced degradation of cyclin E levels in mammalian cells (28) has been suggested to mediate the role of Plc in cell cycle control, but it is not clear how the enzyme might interact with the cell cycle machinery to regulate progression through different phases of the cell cycle (9, 27).
Data from the present study support the hypothesis that at least some of the effects of cell cycle-associated activation of Plc1 are due to the generation of higher inositol phosphates. The kinetics of the increase in the levels of PP-InsP5 and (PP)2-InsP4 corresponds well with the time frame of the increase in the activity of Plc1. There are very few previous reports of specific stimuli that acutely increase the level of pyrophosphates, but a 20–25% decrease in InsP6 levels 30 min after release from the α-factor block is similar to the one observed previously following a 30-min exposure of U2-OS cells to 200 mm sorbitol (29). In the present study, the total radioactivity in the inositol pyrophosphate region of the chromatograph (i.e. [3H]InsP7 plus [3H]InsP8) equals half of the change in InsP6 level, suggesting that at least half of the decrease in InsP6 level could be ascribed to phosphorylation into pyrophosphates. In contrast to sorbitol-stimulated cells, in which the Vip1-mediated increase of (PP)2-InsP4 was nearly quantitatively balanced by a corresponding decrease in PP-InsP5 levels (29), the level of both pyrophosphates increased during the progression through the S phase. Again, a significant delay in cell cycle progression in yeast mutants lacking Kcs1, which is clearly responsible for the generation of pyrophosphates in synchronized cells, as well as accelerated progression through S phase of yeast strains lacking the principal pyrophosphates phosphatase Ddp1 suggest the possible role of pyrophosphates in the progression through the S phase.
It is unclear what might be the possible link between the Kcs1-mediated increase in diphosphoinositol polyphosphates and the progression of yeast cells through S phase of the cell cycle. The KCS1 gene was first identified in a screen for suppression of temperature sensitivity of a mutation of the protein kinase C gene (30) and was later found to have kinase activity responsible for the phosphorylation of InsP5 into PP-InsP4 and InsP6 into PP-InsP5 (31, 32). Loss-of-function studies have implicated pyrophosphates in regulation of DNA hyperrecombination (33) and Kcs1-generated PP-InsP4 as a negative regulator of telomere length (16, 34), but it is unclear whether pyrophosphates directly regulate these processes. The most selective putative intracellular receptor for pyrophosphates is the Pho80-Pho85-Pho81 cyclin-dependent kinase-cyclin kinase inhibitor complex (17), and that provides a link to the regulation of cytoskeletal dynamics and cell cycle because the human homolog of Pho85 is Cdk5 (35). However, InsP7, which has been isolated as a cellular component that directly regulates the complex in response to phosphate starvation, is a distinct stereoisomer, 1-PP-InsP5, generated by Vip1 kinase, but not Kcs1-generated 5-PP-InsP5 (17). Previous analyses of yeast Kcs1 mutants suggested a role for the kinase in vacuole biogenesis (32, 36), cell wall integrity (36), and proper endocytic trafficking (37), and this may also provide a clue to the possible function of Kcs-generated pyrophosphates in cell cycle progression, because the process of bud formation during progression of yeast cells through S phase is certainly associated with a significant change in the cell wall morphology that might include phospholipid signaling (38). A novel possible mode of pyrophosphate-mediated signaling has been recently proposed that includes a direct transfer of phosphate groups from PP-InsPs to protein substrates in a kinase-independent manner (39). For Kcs1 mutants, the analysis revealed a decrease in the phosphorylation of some nucleolar proteins, including nucleolin (39). However, studies in mammalian cells ruled out the possibility that nucleolin serves as a molecular target for inositol pyrophosphate response to osmotic stress in vivo (40).
Regardless of detailed mechanisms, our findings provide the first evidence for time-dependent increase in the activity of Plc1 and an increase in the level of pyrophosphates in yeast cells synchronized by α-factor arrest and release. In synchronized yeast cells, the increase in the level of InsP7 and InsP8 is due to the activation of Kcs1, which is necessary for the progression of the cells through S phase of the cell cycle.
Acknowledgments
We thank Samuel Gattis for valuable help with InsP6 kinase assay and Dunja Tankovic for excellent technical assistance.
This work was supported, in whole or in part, by National Institutes of Health Grants R01-HL55672-15 and R01-CA129132 (to J. Y. and A. B., respectively). This work was also supported by Ministry of Science, Education, and Sport of the Republic of Croatia Grants 108-1081347-0173 (to H. B.) and 108-1081347-1448 (to D. V.); Unity through Knowledge Fund Grant 02/07 (to H. B. and A. B.); and University of Zagreb Development Fund Grant 380-181/102-12-21 (to H. B.).
- Plc
- phospholipase C
- PtdInsP2
- phosphatidylinositol 4,5-bisphosphate
- InsP3
- inositol trisphosphate
- InsP4
- inositol tetrakisphosphate
- InsP5
- inositol pentakisphosphate
- InsP6
- inositol hexakisphosphate
- InsP7 (also referred to as PP-InsP5)
- diphosphoinositol pentakisphosphate
- InsP8 (also referred to as (PP)2-InsP4)
- bisphosphoinositol tetrakisphosphate
- PP-InsP4
- diphosphoinositol tetrakisphosphate
- CDK
- cyclin-dependent kinase.
REFERENCES
- 1. Divecha N., Banfić H., Irvine R. F. (1991) The polyphosphoinositide cycle exists in the nuclei of Swiss 3T3 cells under the control of a receptor (for IGF-I) in the plasma membrane, and stimulation of the cycle increases nuclear diacylglycerol and apparently induces translocation of protein kinase C to the nucleus. EMBO J. 10, 3207–3214 [DOI] [PMC free article] [PubMed] [Google Scholar]
- 2. Martelli A. M., Gilmour R. S., Bertagnolo V., Neri L. M., Manzoli L., Cocco L. (1992) Nuclear localization and signalling activity of phosphoinositidase Cβ in Swiss 3T3 cells. Nature 358, 242–245 [DOI] [PubMed] [Google Scholar]
- 3. Faenza I., Matteucci A., Manzoli L., Billi A. M., Aluigi M., Peruzzi D., Vitale M., Castorina S., Suh P. G., Cocco L. (2000) A role for nuclear phospholipase Cβ 1 in cell cycle control. J. Biol. Chem. 275, 30520–30524 [DOI] [PubMed] [Google Scholar]
- 4. Sun B., Murray N. R., Fields A. P. (1997) A role for nuclear phosphatidylinositol-specific phospholipase C in the G2/M phase transition. J. Biol. Chem. 272, 26313–26317 [DOI] [PubMed] [Google Scholar]
- 5. Lukinovic-Skudar V., Donlagic L., Banfić H., Visnjic D. (2005) Nuclear phospholipase C-β1b activation during G2/M and late G1 phase in nocodazole-synchronized HL-60 cells. Biochim. Biophys. Acta 1733, 148–156 [DOI] [PubMed] [Google Scholar]
- 6. Lukinovic-Skudar V., Matkovic K., Banfic H., Visnjic D. (2007) Two waves of the nuclear phospholipase C activity in serum-stimulated HL-60 cells during G1 phase of the cell cycle. Biochim. Biophys. Acta 1771, 514–521 [DOI] [PMC free article] [PubMed] [Google Scholar]
- 7. Stallings J. D., Tall E. G., Pentyala S., Rebecchi M. J. (2005) Nuclear translocation of phospholipase C-δ1 is linked to the cell cycle and nuclear phosphatidylinositol 4,5-bisphosphate. J. Biol. Chem. 280, 22060–22069 [DOI] [PubMed] [Google Scholar]
- 8. Crljen V., Visnjić D., Banfić H. (2004) Presence of different phospholipase C isoforms in the nucleus and their activation during compensatory liver growth. FEBS Lett. 571, 35–42 [DOI] [PubMed] [Google Scholar]
- 9. Irvine R. F. (2003) Nuclear lipid signalling. Nat. Rev. Mol. Cell Biol. 4, 349–360 [DOI] [PubMed] [Google Scholar]
- 10. Tsui M. M., York J. D. (2010) Roles of inositol phosphates and inositol pyrophosphates in development, cell signaling and nuclear processes. Adv. Enzyme Reg. 50, 324–337 [DOI] [PMC free article] [PubMed] [Google Scholar]
- 11. Lin H., Choi J. H., Hasek J., DeLillo N., Lou W., Vancura A. (2000) Phospholipase C is involved in kinetochore function in Saccharomyces cerevisiae. Mol. Cell Biol. 20, 3597–3607 [DOI] [PMC free article] [PubMed] [Google Scholar]
- 12. Odom A. R., Stahlberg A., Wente S. R., York J. D. (2000) A role for nuclear inositol 1,4,5-triphosphate kinase in transcriptional control. Science 287, 2026–2029 [DOI] [PubMed] [Google Scholar]
- 13. Steger D. J., Haswell E. S., Miller A. L., Wente S. R., O'Shea E. K. (2003) Regulation of chromatin remodeling by inositol polyphosphates. Science 299, 114–116 [DOI] [PMC free article] [PubMed] [Google Scholar]
- 14. York J. D., Odom A. R., Murphy R., Ives E. B., Wente S. R. (1999) A phospholipase C-dependent inositol polyphosphate kinase pathway required for efficient messenger RNA export. Science 285, 96–100 [DOI] [PubMed] [Google Scholar]
- 15. Hanakahi L. A., Bartlet-Jones M., Chappell C., Pappin D., West S. C. (2000) Binding of inositol phosphate to DNA-PK and stimulation of double-strand break repair. Cell 102, 721–729 [DOI] [PubMed] [Google Scholar]
- 16. York S. J., Armbruster B. N., Greenwell P., Petes T. D., York J. D. (2005) Inositol diphosphate signaling regulates telomere length. J. Biol. Chem. 280, 4264–4269 [DOI] [PubMed] [Google Scholar]
- 17. Lee Y. S., Mulugu S., York J. D., O'Shea E. K. (2007) Regulation of a cyclin-CDK-CDK inhibitor complex by inositol pyrophosphates. Science 316, 109–112 [DOI] [PMC free article] [PubMed] [Google Scholar]
- 18. Perera N. M., Michell R. H., Dove S. K. (2004) Hypo-osmotic stress activates Plc1p-dependent phosphatidylinositol 4,5-bisphosphate hydrolysis and inositol hexakisphosphate accumulation in yeast. J. Biol. Chem. 279, 5216–5226 [DOI] [PubMed] [Google Scholar]
- 19. Sindić A., Aleksandrova A., Fields A. P., Volinia S., Banfić H. (2001) Presence and activation of nuclear phosphoinositide 3-kinase C2β during compensatory liver growth. J. Biol. Chem. 276, 17754–17761 [DOI] [PubMed] [Google Scholar]
- 20. Azevedo C., Saiardi A. (2006) Extraction and analysis of soluble inositol polyphosphates from yeast. Nat. Protoc. 1, 2416–2422 [DOI] [PubMed] [Google Scholar]
- 21. Mulugu S., Bai W., Fridy P. C., Bastidas R. J., Otto J. C., Dollins D. E., Haystead T. A., Ribeiro A. A., York J. D. (2007) A conserved family of enzymes that phosphorylate inositol hexakisphosphate. Science 316, 106–109 [DOI] [PubMed] [Google Scholar]
- 22. Onnebo S. M., Saiardi A. (2009) Inositol pyrophosphates modulate hydrogen peroxide signalling. Biochem. J. 423, 109–118 [DOI] [PubMed] [Google Scholar]
- 23. Safrany S. T., Ingram S. W., Cartwright J. L., Falck J. R., McLennan A. G., Barnes L. D., Shears S. B. (1999) The diadenosine hexaphosphate hydrolases from Schizosaccharomyces pombe and Saccharomyces cerevisiae are homologues of the human diphosphoinositol polyphosphate phosphohydrolase overlapping substrate specificities in a MutT-type protein. J. Biol. Chem. 274, 21735–21740 [DOI] [PubMed] [Google Scholar]
- 24. Guse A. H., Greiner E., Emmrich F., Brand K. (1993) Mass changes of inositol 1,3,4,5,6-pentakisphosphate and inositol hexakisphosphate during cell cycle progression in rat thymocytes. J. Biol. Chem. 268, 7129–7133 [PubMed] [Google Scholar]
- 25. Barker C. J., Wright J., Hughes P. J., Kirk C. J., Michell R. H. (2004) Complex changes in cellular inositol phosphate complement accompany transit through the cell cycle. Biochem. J. 380, 465–473 [DOI] [PMC free article] [PubMed] [Google Scholar]
- 26. Saiardi A. (2012) Cell signalling by inositol pyrophosphates. Subcell. Biochem. 59, 413–443 [DOI] [PubMed] [Google Scholar]
- 27. Visnjic D., Banfic H. (2007) Nuclear phospholipid signaling. Phosphatidylinositol-specific phospholipase C and phosphoinositide 3-kinase. Pflugers Arch. 455, 19–30 [DOI] [PubMed] [Google Scholar]
- 28. Stallings J. D., Zeng Y. X., Narvaez F., Rebecchi M. J. (2008) Phospholipase C-δ1 expression is linked to proliferation, DNA synthesis, and cyclin E levels. J. Biol. Chem. 283, 13992–14001 [DOI] [PubMed] [Google Scholar]
- 29. Pesesse X., Choi K., Zhang T., Shears S. B. (2004) Signaling by higher inositol polyphosphates. Synthesis of bisdiphosphoinositol tetrakisphosphate (“InsP8”) is selectively activated by hyperosmotic stress. J. Biol. Chem. 279, 43378–43381 [DOI] [PubMed] [Google Scholar]
- 30. Huang K. N., Symington L. S. (1995) Suppressors of a Saccharomyces cerevisiae pkc1 mutation identify alleles of the phosphatase gene PTC1 and of a novel gene encoding a putative basic leucine zipper protein. Genetics 141, 1275–1285 [DOI] [PMC free article] [PubMed] [Google Scholar]
- 31. Saiardi A., Erdjument-Bromage H., Snowman A. M., Tempst P., Snyder S. H. (1999) Synthesis of diphosphoinositol pentakisphosphate by a newly identified family of higher inositol polyphosphate kinases. Curr. Biol. 9, 1323–1326 [DOI] [PubMed] [Google Scholar]
- 32. Saiardi A., Caffrey J. J., Snyder S. H., Shears S. B. (2000) The inositol hexakisphosphate kinase family. Catalytic flexibility and function in yeast vacuole biogenesis. J. Biol. Chem. 275, 24686–24692 [DOI] [PubMed] [Google Scholar]
- 33. Luo H. R., Saiardi A., Yu H., Nagata E., Ye K., Snyder S. H. (2002) Inositol pyrophosphates are required for DNA hyperrecombination in protein kinase C1 mutant yeast. Biochemistry 41, 2509–2515 [DOI] [PubMed] [Google Scholar]
- 34. Saiardi A., Resnick A. C., Snowman A. M., Wendland B., Snyder S. H. (2005) Inositol pyrophosphates regulate cell death and telomere length through phosphoinositide 3-kinase-related protein kinases. Proc. Natl. Acad. Sci. U.S.A. 102, 1911–1914 [DOI] [PMC free article] [PubMed] [Google Scholar]
- 35. Huang D., Friesen H., Andrews B. (2007) Pho85, a multifunctional cyclin-dependent protein kinase in budding yeast. Mol. Microbiol. 66, 303–314 [DOI] [PubMed] [Google Scholar]
- 36. Dubois E., Scherens B., Vierendeels F., Ho M. M., Messenguy F., Shears S. B. (2002) In Saccharomyces cerevisiae, the inositol polyphosphate kinase activity of Kcs1p is required for resistance to salt stress, cell wall integrity, and vacuolar morphogenesis. J. Biol. Chem. 277, 23755–23763 [DOI] [PubMed] [Google Scholar]
- 37. Saiardi A., Sciambi C., McCaffery J. M., Wendland B., Snyder S. H. (2002) Inositol pyrophosphates regulate endocytic trafficking. Proc. Natl. Acad. Sci. U.S.A. 99, 14206–14211 [DOI] [PMC free article] [PubMed] [Google Scholar]
- 38. Garrenton L. S., Stefan C. J., McMurray M. A., Emr S. D., Thorner J. (2010) Pheromone-induced anisotropy in yeast plasma membrane phosphatidylinositol-4,5-bisphosphate distribution is required for MAPK signaling. Proc. Natl. Acad. Sci. U.S.A. 107, 11805–11810 [DOI] [PMC free article] [PubMed] [Google Scholar]
- 39. Saiardi A., Bhandari R., Resnick A. C., Snowman A. M., Snyder S. H. (2004) Phosphorylation of proteins by inositol pyrophosphates. Science 306, 2101–2105 [DOI] [PubMed] [Google Scholar]
- 40. Yang L., Reece J. M., Cho J., Bortner C. D., Shears S. B. (2008) The nucleolus exhibits an osmotically regulated gatekeeping activity that controls the spatial dynamics and functions of nucleolin. J. Biol. Chem. 283, 11823–11831 [DOI] [PMC free article] [PubMed] [Google Scholar]


