

Abstract
Purpose: To investigate the use of the whole-breast sound speed measurement as a marker of breast density (BD), a known risk factor for breast cancer.
Methods: As part of an ongoing study of breast cancer detection, 249 patients were scanned with a clinical prototype that operates on the principles of ultrasound tomography. Typically, 40–100 sound speed tomograms were reconstructed from the scan data, corresponding to the entire volume of the breast of each patient. The data were used to estimate the volume averaged sound speed (VASS) of the breast for each patient. The corresponding mammograms were used to calculate mammographic percent density (MPD) using CUMULUS software. Film mammograms were available for 164 patients while 85 digital mammograms were available for the remaining patients. Standard statistical techniques were used to determine associations of breast sound speed with a variety of mammographic measures such as percent density, area of dense tissue, and area of nondense tissue. Furthermore, associations of breast sound speed with continuous variables such as age and weight and dichotomous variables such as parity and menopausal status were also assessed.
Results: VASS was found to be significantly associated with MPD. The Spearman correlation coefficient (rs) between VASS and MPD was found to be 0.77 and 0.71 for film and digital mammography, respectively. VASS was positively correlated with dense areas by mammography, both digital (rs = 0.46) and film (rs = 0.56). VASS was negatively associated with nondense area by mammography, both digital (rs = −0.58) and film (rs = −0.63). BD by all methods was less in postmenopausal than in premenopausal women. The MPD was lower in the postmenopausal group (by 6.6%, p < 0.08, for the digital group and 7.73%, p < 0.007, for the film group). The VASS was also lower in the postmenopausal group (by 15 m/s, p < 0.001 for the digital group and 8 m/s, p < 0.08, for the film group). The association of MPD with age was characterized with rs = −0.06 (p < 0.6) for digital mammography and rs = −0.53 (p < 0.002) for film mammography. For weight, the MPD associations were characterized by rs = −0.53 (p < 0.0001) for digital mammography and −0.38 (p < 0.0001) for film mammography. The association of VASS with age was rs = −0.33 (p < 0.002) for the digital group and −0.17 (p < 0.03) for the film group. For weight, the relationship was characterized with rs = −0.45 (p < 0.001) for the digital group and −0.37 (p < 0.0001) for the film group.
Conclusions: The association between VASS and MPD is strong for both film and digital mammography, suggesting that VASS is a viable measure of breast density. This result sets the stage for future work that will focus on directly testing the association of VASS with breast cancer risk.
Keywords: breast density, breast cancer, ultrasound tomography, mammography
INTRODUCTION
In a landmark study, McCormack and dos Santos Silva have reviewed the data on the association of breast density (BD) by mammography with risk of breast cancer in a systematic meta-analysis of data for >14 000 cases and 226 000 noncases from 42 studies.1 They found that mammographic BD was consistently associated with risk of breast cancer. In a study by Boyd et al., the breast cancer risk associated with density did not differ by age, menopausal status, or ethnicity and cannot be explained by the “masking” of cancers by dense tissue.2
The ability to predict the future occurrence of disease in individuals could facilitate the design and application of preventive strategies and intervention trials, and improved clinical decision-making.3 Prediction of the risk of developing breast cancer is less well developed than risk prediction of other diseases, such as cardiovascular disease.4 The most widely used current method of predicting risk of breast cancer is the Gail model,5 that includes age, age at menarche, age at first live birth, number of previous benign breast biopsies, and number of first-degree relatives with breast cancer. BD, assessed by mammography, and expressed as a percentage of the mammogram occupied by radiologically dense tissue (percent mammographic density), reflects variations in breast tissue composition and is more strongly associated with breast cancer risk than most of the other variables in the Gail model.1 The addition of BD to the Gail model increased the concordance statistic (c) from 0.607 to 0.642,6 a larger effect than the addition of seven single nucleotide polymorphisms associated with breast cancer (c = 0.632).7 Unlike most other risk factors for breast cancer, breast density can be changed, suggesting that it may be a target for preventive interventions.8
The radiographic appearance of the breast on mammography varies among women, and reflects variations in breast tissue composition, and the different x-ray attenuation characteristics of these tissues.8 Variations in BD on mammography reflect variations in the amounts of collagen and number of cells, both epithelial and nonepithelial, in the breast.9 A high BD is associated with an increased risk of both invasive breast cancer and in situ breast cancer and atypical hyperplasia, hyperplasia without atypia, and columnar cell lesions.10, 11, 12, 13 The biological basis of the associations of BD on mammography with risk of invasive breast cancer and with proliferative breast lesions may all be the result of exposure to breast mitogens combined with mutagens and is discussed in detail in Ref. 13. Interventions that change cell proliferation in the breast, including Tamoxifen and hormone therapy, also change BD.8, 14
John Wolfe, at Wayne State University in Detroit (USA), was the first to describe differences in risk of breast cancer associated with variations in the mammographic appearance of the breast.15, 16 Since then, other qualitative and quantitative methods of measuring BD by mammography17 have been applied to the assessment of BD in relation to risk of breast cancer. Currently, computer-assisted methods of measurement (CUMULUS and other similar programs) based on interactive thresholding are the most accurate for mammography-based estimates of BD.17 Quantitative assessment of mammograms requires a trained observer and digitized film images, or processed images from digital mammography. Reliability between readers is high. For example, observers utilizing CUMULUS achieve an intraclass correlation coefficient (ICC) of 0.9 or greater,2 the class referring to the group of readers.
Measurement of BD in mammographic images reflects variations in breast tissue composition, the x-ray attenuation properties of those tissues, and the methods used to generate the images. With digital mammography there is a more linear scale with a wider dynamic range, and different degrees of density are seen as different shades of grey. When a threshold is set using a program such as CUMULUS, some slightly dense areas (that may have been rendered white on film) will fall below the threshold and not be counted as “density.” This effect can be accentuated by image processing that takes place in digital imaging where contrast between tissues is maximized. Differences among manufacturers in the production of processed images, and the expected future evolution of the technology to further improve cancer detection, mean that mammography is likely to remain a “moving target” for the measurement of BD.
Many of the current methods of measurement using mammography are based on the two-dimensional projected area of the breast rather than the three-dimensional volumes of the tissues. Furthermore, previous attempts to measure the volume of BD in mammograms have not improved risk prediction compared to measurement of projected area.18, 19 It is possible that this failure is likely due to the sensitivity of the volume measure of BD to errors in the measurement of the thickness of the breast.
Almost all of the methods of measuring BD in mammograms are subjective and thus require training and may vary between observers.20, 21 Stable, standardized, quantitative, volumetric measurements of BD have been difficult to obtain with mammography, and the associated radiation exposure limits the use of repeated measurements and precludes application to young women.22
Potential alternatives to mammography for the measurement of BD include magnetic resonance (MR),23 dual-energy x-ray absorption (DEXA),24 and ultrasound tomography (UST).25 MR is a useful research tool but because of limited access and expense it is not a practical method for wide application. DEXA uses low dose radiation, but a radiation-free method may be preferred at early ages, when susceptibility to the carcinogenic effects of radiation is greatest and repeated measures might be required. UST is an emerging breast imaging modality that is both radiation-free and inexpensive compared to MRI while providing volumetric characterization of breast tissue.25, 26
In contrast to MRI and x-ray methods, UST measures the biomechanical tissue properties of mass density and bulk elastic modulus. The primary method by which to assess breast density with ultrasound tomography is through the measurement of sound speed.25, 26 The average speed of sound (c) through human tissue is related to tissue density and elasticity as c ∝ (K/ρ)1/2, where K is the elastic constant and ρ is the material density of the tissue through which sound waves travel. At first sight, this relationship would imply that density cannot be evaluated from sound speed without independent knowledge of elasticity. However, in human tissue, the elastic constant scales as K ∝ ρ3.27, 28 Substitution into the above equation for sound speed allows us to factor out the dependence on elasticity, thereby not only eliminating it as a confounding factor but also establishing a linear relationship between sound speed and tissue density (c ∝ ρ). Our previous studies have shown results consistent with this relationship.29, 30, 31, 32
This paper presents results from a study comparing the volume averaged sound speed (VASS) of the breast with mammographic percent density (MPD). The purpose of the study was to determine whether VASS is a viable measure of BD and a possible alternative to MPD.
METHODS
Patient recruitment and data collection
About 249 subjects were examined by UST and mammography at the Karmanos Cancer Institute (KCI). All imaging procedures were performed under an Institutional Review Board-approved protocol, in compliance with the Health Insurance Portability and Accountability Act, with informed consent obtained from all patients The subjects were initially recruited for a breast cancer diagnosis study of patients presenting with a suspicious finding in the breast, resulting in a database of UST scans of the affected breast along with the associated mammograms. The recruitment criteria of the study ensured that the UST scans were performed within 12 months of the mammogram for each patient. The archived data span a period of 7 yr, from 2005 to 2012.32, 33 We calculated the VASS from the UST data and the MPD from the mammographic data of the affected breast. The original UST scans were performed by a research nurse who was not subsequently involved in the breast density measurements. UST data of the contralateral breast were not available in this archive because the original diagnostic study focused on scanning only the affected breast. Consequently, the BD measurements were technically influenced by the presence of masses. The implications on the study however are minor and are discussed below. Mammograms of the contralateral breast were available and were used in a subset of the analysis, as described below.
Mammographic measurements
During the recruitment process, KCI upgraded its mammographic units from film to digital. Subjects were therefore imaged with either a GE film mammography unit [N = 164] or a GE Senographe Essential 2008 digital unit [N = 85]. The timing of this transition allowed us to compare VASS and MPD separately from film and digital mammography. The methods used to measure mammograms are those described previously.11 Images were read, by one reader (NFB), using the CUMULUS 4 software. The interactive computer-assisted method was used to generate measurements of the areas of dense tissue and total area, and percent dense and nondense areas derived from these measurements. Reproducibility was assessed by rereading a randomly selected 10% sample of images, randomly distributed among the images being read, within and between each reading session.
UST measurements
The UST data used in this study were originally acquired with an investigational prototype located at the Alexander J. Walt Comprehensive Breast Center at the Karmanos Cancer Institute in Detroit, MI (Fig. 1). The prototype is described fully in pervious publications.32, 33 Here we summarize the basic operating characteristics.
With data acquisition time of 0.03 s per slice, the prototype scans patients without intraslice motion artifacts.
Operating at a central frequency of 2 MHz, where ultrasound attenuation is relatively low, consistent penetration of the whole breast diameter is assured.
The exams are operator-independent and cover the entire volume of the breast.
A flexible table-top made out of sail-cloth is designed to take advantage of the patient's weight which pushes the maxilla and chest wall into the water tank and within range of the ring transducer. Furthermore, the pendant position of the breast and the acquisition of data in coronal planes assures access to the normally difficult regions directly behind the nipple, ensuring a density measurement that characterizes the entire breast.
The fixed array configuration of the transducer allows calibration to an absolute external standard, usually expressed in km/s, ensuring negligible patient to patient errors.
Figure 1.

The UST clinical prototype. A patient lies in the prone position such that the breast is suspended inside a water tank that contains the ultrasound sensor.
As shown in Figs. 12, the patient lies prone on a table made of flexible sailcloth, with the breast suspended in an imaging tank filled with warm water below the table. The ultrasound sensor, shown in Fig. 2, in the shape of a ring, consists of 256 equally spaced array elements. Each element is designed with a wide fan beam response in the coronal plane and a narrow beam response out of plane to assure thin 5 mm image slices. The array surrounds the breast and moves from the chest wall to the nipple on a motorized gantry, gathering data along the way. A typical whole breast exam takes about 1 min to perform. A sound speed image is generated for each position of the transducer, yielding an image stack (Fig. 2—right). The images are produced from algorithms that utilize “bent-ray” tomographic techniques for greater computational efficiency while accounting for refractive effects.30, 31 The exam is operator independent and, since the method is based on acquiring acoustic signals, there is no ionizing radiation.
Figure 2.
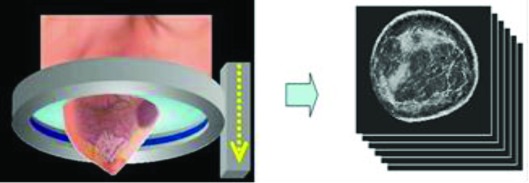
The ultrasound ring array surrounds the breast as it moves on a vertical trajectory from the chest wall to the nipple, acquiring data at discrete steps along the way. Each acquired dataset yields images of sound speed, as shown.
The speed of sound is a measure that is obtained by determining the arrival times of signals emitted by one portion of the transducer and received at another. Since the physical parameters of transducer shape and size are determined precisely at the time of manufacture, the speed of sound can be calculated in km/s on an absolute scale that can be easily replicated between current and future machines without the need for phantom calibrations.28, 29, 30, 31
Ultrasound tomography measure of BD
Subjects were scanned at 1 mm intervals, from the chest wall to the nipple. The number of ring positions depends upon the size of the breast, and typically, 40–100 positions are required. Sound speed tomograms were created from these data for each ring position. The resulting images were stacked into an image cube using the software package IMAGEJ (Fig. 2). Reproducibility of the UST measurements was assessed by repeating a randomly selected 10% sample of measurements.
The calculation of VASS is largely operator independent but requires some semiautomated editing of the image stacks to remove contributions from (i) the water that surrounds the breast, (ii) the chest wall, and (iii) the nipple since none of these contributions are relevant to BD calculations.
Water removal
The UST exams require that the subject's breast is immersed in body-temperature water which has a sound speed of ∼1.52 km/s. This sound speed value falls within the range of breast tissue, being higher than fat and lower than dense glandular tissue. Consequently, its sound speed signal cannot be removed by simple thresholding. An elliptical fitting method (IMAGEJ package) was used to draw a border around the breast, approximating the breast boundary, and remove all signal outside the border, as illustrated in Fig. 3.
Figure 3.
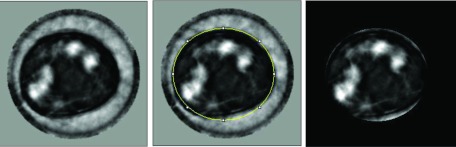
Process of segmentation of the water signal from UST sound speed images. Left: Coronal cross section of breast showing dense glandular tissue (white), fatty tissue (dark), water signal (grey). Center: An elliptical ROI is used to approximate the boundary of the breast (i.e., the breast–water interface). Right: After blanking of pixels outside the breast boundary, all water signal is removed. The variations in the sound speed of water are the result of errors in the reconstruction process.
Chest wall and nipple correction
Sagittal and axial projections of the images stacks were used to guide the removal of image slices that correspond to the chest wall and nipple. Typically, 10–15 slices are removed from each image stack as a result of this process.
VASS calculation
The remaining “clean” stack, free of water, chest wall, and nipple signal, was used to automatically calculate the volume average sound speed of the breast. The calculation was performed using the “average” routine inside the “Image Stack” portion of the IMAGEJ software package. The routine simply sums all sound speed pixel values and divides by the total number of pixels counted within the breast boundary. This process yields a volume-averaged sound speed of the breast, as follows.
-
1)The volume of the breast, V, calculated through a direct count of all pixels
where δ is a voxel located at position (x,y,z); Δx, Δy, Δz are the dimensions of the voxels (1 mm3, in our measurements); and Nx, Ny, and Nz are the dimensions of the sound speed image stack (221 × 221 × 75 pixels). -
2)
The above breast volume was used to calculate the mean (volume averaged) sound speed for each patient using the formula: , where c is the sound speed value of each voxel.
Comparison of VASS and MPD
We compared UST sound speed measurements of the breast with percent density measured by mammography using CUMULUS—85 by digital mammography and 164 by film. All CUMULUS measurements were made in one craniocaudal view of the breast without knowledge of the associated sound speed measure.
In the analysis we included only those subjects who had both mammographic and sound speed breast measurements.
We used a two-sample t test or Wilcoxon test for continuous variables, and a chi square test for categorical variables to compare selected characteristics of 85 and 164 subjects with digital and film mammogram, respectively.
We assessed the association of percent mammographic density and sound speed with the selected characteristics, by digital and film mammography, using the Spearman correlation coefficient for continuous variables and a two-sample t test to compare the means of continuous variables according to image type. We also used the Spearman correlation coefficient to assess the correlation between the sound speed and the mammographic breast measurements.
We compared the variance in sound speed that could be accounted for by each of the mammographic measures, or their combination. Using a stratified analysis by mammography type, we fit a simple linear regression model with VASS as an outcome and each of the mammographic measures as predictors for both the dense and nondense areas in the model.
In stratified analysis, we compared regression coefficients of mammographic measurements between the models containing dense area and nondense area as a separate predictor and when both of them were in the model.
RESULTS
VASS measures of BD were found to be strongly associated with measurements of MPD. The statistical analysis also yielded a variety of associations of MPD and VASS with both continuous and dichotomous risk factors. The results are detailed below.
Characteristics of film and digital mammography
Table 1 summarizes the characteristics of the digital and film mammography datasets, including MPD, dense area (total area of dense tissue measured on mammogram), nondense area (total area of remaining tissue), total area (total area of mammogram), and VASS, as well as age, weight, height, and age at menarche of subject. Also shown in Table 1 are dense area, nondense area, total area, and MPD for both the affected and contralateral breast. A comparison between the affected and contralateral breast data shows no systematic differences that would result from the inclusion of masses in the affected breasts (i.e., mass visible on mammogram). This issue is formally addressed in the error analysis section below where we conclude that the inclusion of masses does not significantly impact the BD measurements.
Table 1.
Descriptive statistics for mammographic measurements, sound speed, and selected characteristics, by digital and film mammography.
| Mean (SD) or % |
|||
|---|---|---|---|
| Digital mammograms | Film mammograms | ||
| (n = 85) | (n = 164) | P2 | |
| Affected1 breast, n = 85, 164 | |||
| Percent density | 25.0 (15.7) | 29.2 (17.1) | 0.06 |
| Dense area (cm2) | 37.2 (21.9) | 49.7 (32.9) | 0.005 |
| Nondense area (cm2) | 146.8 (100.4) | 139.2 (77.3) | 0.76 |
| Total area (cm2) | 184.0 (100.1) | 188.9 (76.8) | 0.17 |
| Opposite1 breast, n = 78, 160 | |||
| Percent density | 24.9 (17.2) | 26.6 (16.1) | 0.27 |
| Dense area (cm2) | 38.6 (25.4) | 44.5 (29.1) | 0.17 |
| Nondense area (cm2) | 152.8 (97.9) | 144.4 (78.2) | 0.98 |
| Total area (cm2) | 191.4 (94.2) | 188.9 (75.6) | 0.67 |
| Sound speed (km/h) [affected breast] | 1.4478 (0.0263) | 1.4436 (0.0277) | 0.13 |
| Age (yr) | 44.5 (10.8) | 47.6 (10.0) | 0.03 |
| Weight (kg), n = 84, 158 | 74.4 (16.4) | 81.9 (16.4) | 0.0009 |
| Height (cm), n = 82, 151 | 162.7 (7.6) | 163.3 (6.4) | 0.52 |
| Age at menarche (yr), n = 79, 131 | 12.3 (1.8) | 12.8 (2.0) | 0.06 |
| Parity (% parous), n = 82, 133 | 72.0 | 84.2 | 0.03 |
| Age at birth of first child (yr), n = 59, 111 | 21.6 (5.8) | 21.3 (5.8) | 0.81 |
| Menopausal status (% post), n = 83, 156 | 31.3 | 38.5 | 0.27 |
| Age at menopause (yr), n = 17, 35 | 42.8 (7.0) | 44.4 (6.3) | 0.45 |
| Breast cancer in first degree relative (% yes), n = 84, 135 | 25.0 | 22.2 | 0.64 |
Affected = mammographic and sound speed measurements are from the affected breast; opposite = the measurements are from the contralateral breast.
P is a p-value from the two-sample t test for age, weight, and height; Wilcoxon two-sample test for percent density, dense area, nondense area, total area, sound speed, age at menarche, age at birth of first child, and age at menopause; chi-square test for parity, menopausal status, and breast cancer in first degree relative. The paired quantities refer to the number of digital and film mammograms, respectively. Whenever mean values are shown, the standard deviation is shown in parentheses to characterize the width of the distribution.
Association of MPD and sound speed with continuous risk factors
Table 2 shows the (Spearman) correlations between percent density in mammograms, sound speed, and selected covariates. Results are shown for the affected breast and the opposite breast. Data are shown separately for digital and film mammograms. Percent density in digital mammograms and sound speed in the same women were both negatively associated with age and weight. Neither measure was associated significantly with any of the other covariates. Similar results were seen with percent density in film mammograms, although height was associated with percent density in film (p = 0.05) but not with sound speed in the same subjects.
Table 2.
Association of percent density and sound speed with continuous risk factors, by digital and film mammography.
| Spearman correlation coefficient (p-value) |
||
|---|---|---|
| Digital mammograms | Film mammograms | |
| (n = 85) | (n = 164) | |
| Percent density, affected1 breast | ||
| Age (yr) | −0.06 (0.60) | −0.24 (0.002) |
| Weight (kg), n = 84, 158 | −0.53 (<.0001) | −0.38 (<.0001) |
| Height (cm), n = 82, 151 | 0.05 (0.64) | −0.16 (0.05) |
| Age at menarche (yr), n = 79, 131 | 0.18 (0.12) | 0.12 (0.16) |
| Age at birth of first child (yr), n = 59, 111 | 0.03 (0.82) | 0.11 (0.25) |
| Age at menopause (yr), n = 17, 35 | 0.17 (0.50) | 0.10 (0.56) |
| Percent density, opposite1 breast | ||
| Age (yr), n = 78, 160 | −0.05 (0.68) | −0.20 (0.01) |
| Weight (kg), n = 77, 156 | −0.56 (<.0001) | −0.38 (<.0001) |
| Height (cm), n = 75, 149 | 0.12 (0.30) | −0.10 (0.23) |
| Age at menarche (yr), n = 73, 129 | 0.23 (0.05) | 0.04 (0.65) |
| Age at birth of first child (yr), n = 55, 109 | 0.11 (0.43) | 0.05 (0.59) |
| Age at menopause (yr), n = 15, 35 | −0.04 (0.89) | 0.08 (0.66) |
| Sound speed (km/h) (affected breast) | ||
| Age (yr) | −0.33 (0.002) | −0.17 (0.03) |
| Weight (kg), n = 84, 158 | −0.45 (<.0001) | −0.37 (<.0001) |
| Height (cm), n = 82, 151 | 0.09 (0.44) | −0.12 (0.14) |
| Age at menarche (yr), n = 79, 131 | 0.15 (0.18) | 0.10 (0.26) |
| Age at birth of first child (yr), n = 59, 111 | −0.03 (0.85) | 0.004 (0.97) |
| Age at menopause (yr), n = 17, 35 | −0.06 (0.82) | 0.20 (0.26) |
| Inverse sound speed (h/km) (affected breast) | ||
| Age (yr) | 0.33 (0.002) | 0.17 (0.03) |
| Weight (kg), n = 84, 158 | 0.45 (<.0001) | 0.37 (<.0001) |
| Height (cm), n = 82, 151 | −0.09 (0.44) | 0.12 (0.14) |
| Age at menarche (yr), n = 79, 131 | −0.15 (0.18) | −0.10 (0.26) |
| Age at birth of first child (yr), n = 59, 111 | 0.03 (0.85) | −0.004 (0.97) |
| Age at menopause (yr), n = 17, 35 | 0.06 (0.82) | −0.20 (0.26) |
Same (affected) = mammographic and sound speed measurements are from the same affected breast; opposite (contralateral) = the measurements are from the opposite breast. Sound speed measurements of this table breast were not available but mammographic measurements were.
The association of MPD with age was characterized with a Spearman correlation coefficient (rs) of −0.06 (p < 0.6) for digital mammography and rs = −0.53 (p < 0.002) for film mammography. For weight, the MPD associations were characterized by rs = −0.53 (p < 0.0001) for digital mammography and −0.38 (p < 0.0001) for film mammography. The association of VASS with age was rs = −0.33 (p < 0.002) for the digital group and −0.17 (p < 0.03) for the film group. For weight, the relationship was characterized with rs = −0.45 (p < 0.001) for the digital group and −0.37 (p < 0.0001) for the film group.
Association of MPD and sound speed with dichotomous risk factors
The 2-sample t-test was used to quantify the association of MPD and VASS with the dichotomous variables of parity, menopausal status, and breast cancer in a first degree relative. As shown in Table 3, BD by all methods was less in postmenopausal than in premenopausal women. The MPD was ∼7% lower in the postmenopausal group (p < 0.08, for digital group and p < 0.007 for film group). The VASS was lower by ∼10 m/s in the postmenopausal group (p < 0.001 for digital group and p < 0.08 for film group). In this analysis, cube root transformations were used for sound speed and square root transformations for MPD.
Table 3.
Association of percent density and sound speed with dichotomous risk factors, by digital and film mammography.
| Difference1 (p-value) |
||
|---|---|---|
| Digital mammograms | Film mammograms | |
| (n = 85) | (n = 164) | |
| Percent density, same2 breast | ||
| Parity, n = 82, 133 | −7.48 (0.06) | 1.52 (0.72) |
| Menopausal status, n = 83, 156 | −6.33 (0.08) | −7.73 (0.007) |
| Breast cancer in first degree relative, n = 84, 135 | −0.61 (0.88) | 3.75 (0.32) |
| Percent density, opposite2 breasts | ||
| Parity, n = 75, 130 | −6.76 (0.13) | −1.59 (0.71) |
| Menopausal status, n = 77, 152 | −7.08 (0.08) | −7.57 (0.009) |
| Breast cancer in first degree relative, n = 77, 132 | −1.56 (0.72) | 1.55 (0.68) |
| Sound speed (km/h)3 (affected breast) | ||
| Parity, n = 82, 133 opposite | −0.010 (0.12) | 0.003 (0.69) |
| Menopausal status, n = 83, 156 | −0.015 (0.01) | −0.008 (0.08) |
| Breast cancer in first degree relative, n = 84, 135 | −0.0001 (0.98) | 0.0003 (0.96) |
| Sound speed (km/h)4 (affected breast) | ||
| Parity, n = 82, 133 | −0.010 (0.12) | 0.003 (0.70) |
| Menopausal status, n = 83, 156 | −0.015 (0.01) | −0.008 (0.07) |
| Breast cancer in first degree relative, n = 84, 135 | −0.0002 (0.98) | 0.0004 (0.95) |
Two-sample t test was used to compare two groups. The difference between the back transformed means (“parous” minus “nonparous”, “post” minus “pre”, and “yes” minus “no”) and the p-value from the t test for transformed variables are shown.
Square root transformation was applied on percent density. Same = mammographic measurements are from the same breast; opposite = the measurements are from the contralateral breasts.
Cubic root transformation was applied on sound speed.
Inverse sound speed was used.
Frequency distribution of MPD and sound speed
The frequency distributions of VASS and MPD are markedly different, as shown in Fig. 4. The sound speed distributions are more sharply peaked than either the film-based or digital-based MPD. The peak in the sound speed distribution is shifted more to its lower range compared to either digital or film MPD. The histogram of digital MPDs appears more peaked to its lower range compared to film MPDs but less compared to VASS.
Figure 4.

Distribution of percent density, by digital and film mammography, and sound speed (VASS). Mammographic and sound speed measurements are from the same breast. The y-axis label refers to frequency as a percentage.
Frequency distribution for dense area, nondense area, and total area of mammogram
As shown in Fig. 5, the frequency distributions of film and digital dense area (on mammogram), nondense area, and total area show some differences, which may be attributable to the different ways that digital and film images are analyzed. Perhaps, the strongest difference concerns the dense area distribution between digital and film mammography. The digital distribution appears to be more sharply peaked toward lower values, consistent with suspected biases between digital and film mammography.
Figure 5.
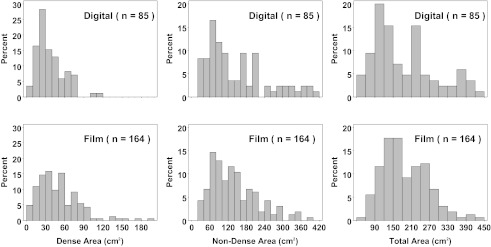
Distribution of dense, nondense, and total area, by digital and film mammography. The y-axis label refers to frequency as a percentage.
Association of sound speed with MPD, dense area, nondense area, and total area
The associations of VASS with MPD, in digital and film mammograms, are shown in Fig. 6 (column 1). VASS is strongly and positively associated with BD by mammography, both digital and film. The relationship of sound speed to BD by digital mammography was approximately linear, while with film mammography it was nonlinear The Spearman's correlation coefficients (rs) for sound speed were 0.71 for digital mammography and 0.77 for film mammography.
Figure 6.
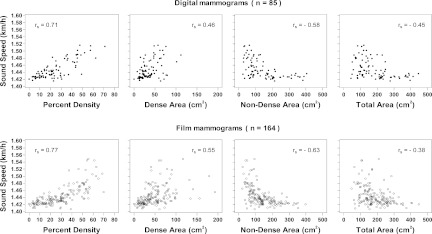
The Spearman correlation coefficients are shown. Mammographic and VASS measurements are from the same breast.
The associations of VASS with dense area in digital and film mammograms are shown in Fig. 6 (column 2). VASS was positively correlated with dense areas by mammography, both digital and film. The Spearman's correlation coefficients were 0.46 for digital mammography and 0.56 for film mammography.
The associations of VASS and nondense area in digital and film mammograms are shown in Fig. 6 (column 3). VASS was negatively associated with nondense area by mammography, both digital and film. The relationship between VASS and nondense area by digital and film mammography is nonlinear. The Spearman's correlation coefficients (rs) was −0.58 for digital mammography and −0.63 for film mammography.
The associations of VASS with total breast area in digital and film mammograms are shown in Fig. 6 (column 4). Sound speed was negatively correlated with total area by mammography, both digital and film. The relationship of VASS to total area by digital and film mammography is nonlinear, Spearman's correlation coefficients (rs) for sound speed were found to be −0.45 for digital mammography and −0.38 for film mammography.
Error estimation
To estimate the uncertainty of the VASS measurement, we identified three possible sources of error.
Biological variability
Previous studies have suggested that breast density is modulated by hormonal changes during the menstrual cycle. In a separate study, we recruited eight subjects and measured their whole-breast sound speed at 1 week intervals over a complete phase of the menstrual cycle. Although we did not detect a modulation of VASS, we were able to estimate the average one standard deviation uncertainty in the VASS measurement of 1.5 m/s.
Mass segmentation
The UST scan data used in this study were initially acquired from a parallel study which selected patients on the basis of having a suspicion following a mammogram. Consequently, most subjects had a mass in their breast which contributes to the VASS measurement independently of the breast density. A 1 cm lesion such as a fibroadenoma or cancer has sound speeds similar to dense fibroglandular tissue. For a typical breast whose volume is 300 cm3 this represents a 0.3% perturbation on the volume of the breast and a 0.004 km./s perturbation on the average sound speed. The latter corresponds to a 0.27% error in the VASS measurement. In the worst cases, with larger masses (5 cm), the error climbs to about 3%. This error is larger than that arising from biological variability but is still small relative to the intrinsic scatter in the associations.
Inter-rater agreement
As discussed above, the only subjective aspect of the whole breast sound speed measurement is the masking process which (i) eliminates the chest wall and nipple from the measurements and (ii) removes the signal from the water that surrounds the breast. It is expected that different operators will apply the masking technique with some variability. To estimate this error, we randomly selected approximately 10% of the datasets for a repeat measurement by an operator who was not involved in the original measurements (MF). Comparison of the two sets of measurements indicated an average discrepancy of 3 m/s in sound speed as measured by 1 standard deviation about the best fit line. When the two estimated sets of VASS measurements were plotted against each other, the correlation coefficient was found to be 0.999.
DISCUSSION
Previous studies have characterized the association of MPD with a variety of risk factors including those summarized in Tables 1, 2, 3 (Ref. 22 and references therein). We find that, overall, VASS is similarly associated with these risk factors, strengthening the case that VASS is a viable method for measuring BD and potentially breast cancer risk.
Table 1 summarizes the characteristics of the digital and film mammography datasets. The differences between the two are most apparent in the mean values of dense area, percent density, and weight. Although the film group contained heavier patients, on average, the percent density and dense area were systematically greater in that group, the opposite of what would be expected based on the known relationship between weight and MPD (see also Table 2). This result is consistent with the observation that digital mammography creates images in a fundamentally different way from film, as discussed in detail in Sec. 1. It, therefore, appears that digital mammography underemphasizes dense tissue relative to film. This conclusion justifies the separation of the two datasets for purposes of comparison with UST measurements.
BD by all methods (digital, film, and UST) correlated negatively with age and body weight (Table 2) and was less in postmenopausal than in premenopausal women (Table 3). These associations are consistent with the expectation that women develop fattier breasts as they age (tissue replacement) and add fat content to breast tissue as they gain weight (obesity). Since the measurement of MPD differs between film and digital mammography, the results differ somewhat between the two samples. VASS, on the other hand, behaves consistently between the two samples because its measurement is independent of mammography and, therefore, not subject to this variability.
The frequency distributions of sound speed and mammographic percent density are significantly different, as shown in Fig. 4. The sound speed distributions are more sharply peaked than either the film-based or digital-based MPD and they peak at lower values of their range. There are several factors that may help explain this difference. Probably the most important factor is that VASS is a volumetric measurement whereas MPD is an area measurement. Since the latter is a projection of the former, there is less intrinsic spread of the independent variable (MPD) compared to VASS and therefore less stratification of density. Another way to explain the difference is to recognize that MPD measures ratios of areas and is therefore subject to confounding effects such as the overlap of tissues which acts as a volume averaging phenomenon that smoothes density differences between subjects. A secondary factor may be the need for setting thresholds in MPD measurements which introduces subjective differences between measurements, adding to measurement error which also acts to smooth density differences. Evidence that points to the latter is the apparent difference between the digital and film histograms which, though not as marked as the difference between MPD and VASS, suggests that digital MPDs peak somewhat more and to lower values compared to film MPDs. It is plausible that given film's sigmoidal response, for a given threshold, film measurements lead to higher estimates of MPD compared to digital, thereby shifting the histogram peak to higher MPD values. The combination of volumetric and threshold effects probably accounts for the bulk of the difference between the MPD and VASS histograms. The implication on stratifying BD is significant because the VASS measurements appear to better isolate the highest densities from the rest of the distribution. It is therefore conjectured that in future risk studies VASS may better stratify breast cancer risk.
The frequency distribution of dense area (on mammogram), nondense area, and total area show some differences, supporting the argument that differences are attributable to the different ways that digital and film images are recorded and analyzed. The fact that the digital distribution appears to be more sharply peaked toward lower values, compared to film, adds direct evidence that thresholding effects combined with film's sigmoidal response account for the differences between the digital and film datasets.
VASS was found to be strongly and positively correlated with BD by mammography, both digital and film. The relationship of VASS to BD by digital mammography was approximately linear, while with film mammography it was more nonlinear, a difference that may be again related to the respective linear and sigmoidal response characteristics of digital and film mammography described above. Although VASS was positively correlated with dense areas by mammography, both digital and film, the correlations were weaker compared to MPD. Such a weakening is to be expected since VASS depends not only on the total amount of dense tissue but also on the volume of the breast. Furthermore, the dense and the nondense areas in the sound speed images were not separated in this study.
Similarly, as expected, VASS was negatively but relatively weakly associated with nondense area by mammography, both digital and film. The relationship between VASS and the nondense area by digital and film mammography was nonlinear. This nonlinearity is also to be expected since the amount of measured nondense tissue depends on the accuracy of the dense tissue measurement which is subject to the uncertainties described above.
VASS was negatively correlated with total area by mammography, both digital and film. The relationship of sound speed to total area by digital and film mammography was nonlinear, with rs = −0.45 and −0.38 for digital and film mammography, respectively. The correlation observed between these parameters can be explained by noting that larger breasts are more likely to be fattier than smaller breasts. This explanation is consistent with known negative association of MPD and VASS with weight. Obesity is a known driver of breast size and breast fat content and probably accounts for the bulk of the observed negative association of VASS with breast size.
A general observation that characterizes the association of VASS with MPD is the behavior of the scatter in the association between these parameters, from low to high values. The scatter is least at low values of VASS and MPD and increases steadily toward higher values. This behavior can be understood in the context of comparing 2D projection images (mammography) with 3D UST images, i.e., comparing VASS and MPD. At low densities the breast is dominated by fatty tissue which tends to be homogeneously distributed, and since breast compression preserves breast volume one would expect a strong correlation between a single component volume and a single component area (compression of the same volume). Similarly with breasts that have only scattered regions of dense tissue the compressed breast will show similar number of localized dense regions as any volumetric image and the correlation is retained. However, as the number of dense regions increases and the overall density of the breast increases, compression of the breast will invariably lead to overlap of dense tissues in the projection image. Such overlap can have two effects (i) regions of dense tissue can occlude each other thereby underestimating the MPD and regions of dense tissue can occlude fatty tissue leading to an overestimate of MPD. Although, on average, these effects cancel out, they could introduce a greater variance in the comparison of MPD with VASS since the latter does not measure a compressed quantity.
Potential impact of improved risk prediction
Risk prediction, and the associated activities of clinical decision-making, and breast cancer prevention, are likely to be improved by elimination of sources of error and variation in measurement by mammography.3 As described, UST is an objective measure of BD that is relatively immune to variations in image acquisition and processing, does not involve breast compression, or require knowledge of breast thickness, and measurements are referred to a fixed physical measure—the speed of sound.
The risk of breast cancer associated with BD measured by UST has not yet been assessed directly. To estimate the magnitude of the gradient in risk expected with MR or UST, we assume that measurements of BD by UST are closer to the “true” measure of BD than is mammography (i.e., most of the scatter in Fig. 4 results from mammography). We use the methods of Rosner et al. to correct estimates of relative risk from logistic regression for the assumed measurement error associated with measuring BD by mammography.34 In previous work the interquintile odds ratio for the association of percent density by mammography with breast cancer risk was 3.08 (beta coefficient = 0.2005; square root transformed interquartile range of percent density = 5.5).2 The average Spearman's correlation (rs) for digital and film between BD by mammography and sound speed by UST was 0.75, and the intraclass correlation coefficient (ICC = r2) was 0.56. To estimate the beta coefficient for the “true” measure of BD by UST, we divide the beta coefficient by the ICC, which gives beta coefficients of 0.3589 (0.2005/0.56) for UST. The expected interquintile odds ratio is given by e(beta)(5.5), and is 7.19, substantially larger than the odds ratio of 3.08 for BD by mammography.
Improved accuracy in the measurement of BD is also likely to strengthen etiological associations, with genetic variants and blood levels of hormones, improve the accuracy of measurements of change in BD, and allow risk assessment using BD at ages before routine screening mammography is started.
CONCLUSIONS
The volume averaged sound speed of the breast, as measured by ultrasound tomography, and the MPD, as measured by mammography, are both positively associated with the amount of dense tissue on a mammogram. They are negatively associated with the amount of nondense tissue. They are higher in premenopausal women than postmenopausal and they are associated with the continuous variables of age and weight. The similar behavior between VASS and MPD is most apparent when comparing them directly. It was found that the association between VASS and MPD is very strong for both film (p < 0.001) and digital mammography (p < 0.001), suggesting that breast sound speed could be a viable marker of breast density. These results support the findings of Glide et al.25, 26 that were based on smaller studies.
Since sound speed is more directly linked to physical density of breast tissue, it has the potential to be more accurate and more relevant than mammographic percent density as a measure of BD. This conjecture is consistent with the results presented in this study which strongly suggest that VASS provides a measure of breast density that is subject to fewer errors compared to mammography. Future work will focus on directly testing the association of VASS with breast cancer risk.
ACKNOWLEDGMENTS
This work was partially supported by a Susan G. Komen Foundation grant KG100100.
DISCLOSURES
N. Duric and P. Littrup are coinventors and have intellectual property interests in the ultrasound technology used for the measurements described in this paper.
References
- McCormack V. A. and dos Santos Silva I., “Breast density and parenchymal patterns as markers of breast cancer risk: A meta-analysis,” Cancer Epidemiol. Biomarkers Prev. 15, 1159–1169 (2006). 10.1158/1055-9965.EPI-06-0034 [DOI] [PubMed] [Google Scholar]
- Boyd N. F. et al. , “Mammographic density and the risk and detection of breast cancer,” N. Engl. J. Med. 356, 227–236 (2007). 10.1056/NEJMoa062790 [DOI] [PubMed] [Google Scholar]
- Freedman A. N., Seminara D., Gail M. H., Hartge P., Colditz G. A., Ballard-Barbash R., and Pfeiffer M., “Cancer risk prediction models: A workshop on development, evaluation, and application,” J. Natl. Cancer Inst. 97, 715–723 (2005). 10.1093/jnci/dji128 [DOI] [PubMed] [Google Scholar]
- Ford E. S., Ajani U. A., Croft J. B., Critchley J. A., Labarthe D. R., Kottke T. E., Giles W. H., and Capewell S., “Explaining the decrease in U.S. deaths from coronary disease, 1980-2000,” N. Engl. J. Med. 356, 2388–2398 (2007). 10.1056/NEJMsa053935 [DOI] [PubMed] [Google Scholar]
- Gail M. H., Brinton L. A., Byar D. P., Corle D. K., Green S. B., Schairer C., and Mulvihill J. J., “Projecting individualized probabilities of developing breast cancer for white females who are being examined annually,” J. Natl. Cancer Inst. 81, 1879–1886 (1989). 10.1093/jnci/81.24.1879 [DOI] [PubMed] [Google Scholar]
- Chen J., Pee D., Ayyagari R., Graubard B., Schairer C., Byrne C., Benichou J., and Gail M. H., “Projecting absolute invasive breast cancer risk in white women with a model that includes mammographic density,” J. Natl. Cancer Inst. 98, 1215–1226 (2006). 10.1093/jnci/djj332 [DOI] [PubMed] [Google Scholar]
- Gail M. H., “Discriminatory accuracy from single-nucleotide polymorphisms in models to predict breast cancer risk,” J. Natl. Cancer Inst. 100, 1037–1041 (2008). 10.1093/jnci/djn180 [DOI] [PMC free article] [PubMed] [Google Scholar]
- Cuzick J., Warwick J., Pinney E., Duffy S. W., Cawthorn S., Howell A., Forbes J. F., and Warren R. M., “Tamoxifen-induced reduction in mammographic density and breast cancer risk reduction: A nested case-control study,” J. Natl. Cancer Inst. 103, 744–752 (2011). 10.1093/jnci/djr079 [DOI] [PubMed] [Google Scholar]
- Johns P. C. and Yaffe M. J., “X-ray characterisation of normal and neoplastic breast tissues,” Phys. Med. Biol. 32, 675–695 (1987). 10.1088/0031-9155/32/6/002 [DOI] [PubMed] [Google Scholar]
- Ursin G., Hovanessian-Larsen L., Parisky Y. R., Pike M. C., and Wu A. H., “Greatly increased occurrence of breast cancers in areas of mammographically dense tissue,” Breast Cancer Res. 7, R605–R608 (2005). 10.1186/bcr1260 [DOI] [PMC free article] [PubMed] [Google Scholar]
- Boyd N. F., Jensen H., Cooke G., and Lee Han H. W., “Relationship between mammographic and histological risk factors for breast cancer,” J. Natl. Cancer Inst. 84, 1170–1179 (1992). 10.1093/jnci/84.15.1170 [DOI] [PubMed] [Google Scholar]
- Turashvili G., McKinney S., Martin L. J., Gelmon K. A., Watson P., Boyd N. F., and Aparicio S., “Columnar cell lesions, mammographic density and breast cancer risk,” Breast Cancer Res. Treat. 115, 561–571 (2009). 10.1007/s10549-008-0099-x [DOI] [PubMed] [Google Scholar]
- Martin L. J. and Boyd N., “Potential mechanisms of breast cancer risk associated with mammographic density: Hypotheses based on epidemiological evidence,” Breast Cancer Res. 10, 1–14 (2008). 10.1186/bcr1831 [DOI] [PMC free article] [PubMed] [Google Scholar]
- Greendale G. A., Reboussin B. A., Sie A., Singh R., Olson L. K., Gatewood O., Bassett L. W., Wasilauskas C., Bush T., and Barrett-Connor E., “Effects of estrogen and estrogen-progestin on mammographic parenchymal density. Postmenopausal Estrogen/Progestin Interventions (PEPI) Investigators,” Ann. Intern. Med. 130, 262–269 (1999). [DOI] [PubMed] [Google Scholar]
- Wolfe J. N., “Risk for breast cancer development determined by mammographic parenchymal pattern,” Cancer 37, 2486–2492 (1976). 10.1002/1097-0142(197605)37:5<2486::AID-CNCR2820370542>3.0.CO;2-8 [DOI] [PubMed] [Google Scholar]
- Wolfe J. N., “Breast patterns as an index of risk for developing breast cancer,” Am. J. Roentgenol. 126, 1130–1139 (1976). [DOI] [PubMed] [Google Scholar]
- Byng J. W., Boyd N. F., Fishell E., Jong R. A., and Yaffe M. J., “The quantitative analysis of mammographic densities,” Phys. Med. Biol. 39, 1629–1638 (1994). 10.1088/0031-9155/39/10/008 [DOI] [PubMed] [Google Scholar]
- Boyd N. F., Martin L. J., Gunasekara A., Melnichouk O., Maudsley G., Peressotti C., Yaffe M. J., and Minkin S., “Mammographic density and breast cancer risk: Evaluation of a novel method of measuring breast tissue volumes,” Cancer Epidemiol. Biomarkers Prev. 18(6), 1754–1762 (2009). 10.1158/1055-9965.EPI-09-0107 [DOI] [PubMed] [Google Scholar]
- Aitken Z. et al. , “Screen-film mammographic density and breast cancer risk: A comparison of the volumetric standard mammogram form and the interactive threshold measurement methods,” Cancer Epidemiol. Biomarkers Prev. 19, 418–428 (2010). 10.1158/1055-9965.EPI-09-1059 [DOI] [PMC free article] [PubMed] [Google Scholar]
- Yaffe M. J., Boone J. M., Packard N., Alonzo-Proulx O., Huang S.-Y., Peressotti C. L., Al-Mayah A., and Brock K., “The myth of the 50-50 breast,” Med. Phys. 36, 5437–5443 (2009). 10.1118/1.3250863 [DOI] [PMC free article] [PubMed] [Google Scholar]
- Kerlikowske K., Grady D., Barclay J., Frankel S. D., Ominsky S. H., Sickles E. A., and Ernster V., “Variability and accuracy in mammographic interpretation using the American college of radiology breast imaging reporting and data system,” J. Natl. Cancer Inst. 90, 1801–1809 (1998). 10.1093/jnci/90.23.1801 [DOI] [PubMed] [Google Scholar]
- Boyd N. F., Martin L. J., Bronskill M., Jaffe M. J., Duric N., and Minkin S., “Breast tissue composition and susceptibility to breast cancer,” J. Natl. Cancer Inst. 102(16), 1224–1237 (2010). 10.1093/jnci/djq239 [DOI] [PMC free article] [PubMed] [Google Scholar]
- Graham S. J., Ness S., Hamilton B. S., and Bronskill M. J., “Magnetic resonance properties of ex vivo breast tissue at 1.5 T,” Magn. Reson. Med. 38, 669–677 (1997). 10.1002/mrm.1910380422 [DOI] [PubMed] [Google Scholar]
- Maskarinec G., Morimoto Y., Daida Y., Laidevant A., Malkov S., Shepherd J. A., and Novotny R., “Comparison of breast density measured by dual energy X-ray absorptiometry with mammographic density among adult women in Hawaii,” Cancer Epidemiol. 35(2), 188–193 (2011). 10.1016/j.canep.2010.06.009 [DOI] [PMC free article] [PubMed] [Google Scholar]
- Glide C., Duric N., and Littrup P., “Novel approach to evaluating breast density utilizing ultrasound tomography,” Med. Phys. 34, 744–753 (2007). 10.1118/1.2428408 [DOI] [PubMed] [Google Scholar]
- Glide-Hurst C. K., Duric N., and Littrup P., “Volumetric breast density evaluation from ultrasound tomography images,” Med. Phys. 35, 3988–3997 (2008). 10.1118/1.2964092 [DOI] [PubMed] [Google Scholar]
- Mast T. D., “Empirical relationships between acoustic parameters in human soft tissues,” J. Acoust. Soc. Am. 1, 37–42 (2000). 10.1121/1.1336896 [DOI] [Google Scholar]
- Weiwad W., Heinig A., Goetz L., Hartmann H., Lampe D., Buchmann J., Millner R., Spielmann R. P., and Heywang-Koebrunner S. H., “Direct measurement of sound velocity in various specimens of breast tissue,” Invest. Radiol. 35, 721–726 (2000). 10.1097/00004424-200012000-00005 [DOI] [PubMed] [Google Scholar]
- Li C., Duric N., and Huang L., “Clinical breast imaging using sound-speed reconstructions of ultrasound tomography data,” Proc. SPIE 6920, 6920–6929 (2008). 10.1117/12.771436 [DOI] [Google Scholar]
- Li C., Huang L., Duric N., Zhang H., and Rowe C., “An improved automatic time-of-flight picker for medical ultrasound tomography,” Ultrasonics 49, 61–72 (2009). 10.1016/j.ultras.2008.05.005 [DOI] [PMC free article] [PubMed] [Google Scholar]
- Li C., Duric N., Littrup P., and Huang L., “In vivo breast sound-speed imaging with ultrasound tomography,” Ultrasound Med. Biol. 35, 1615–1628 (2009). 10.1016/j.ultrasmedbio.2009.05.011 [DOI] [PMC free article] [PubMed] [Google Scholar]
- Duric N., Littrup P., Poulo L., Babkin A., Pevzner R., Holsapple E., Rama O., and Glide C., “Detection of breast cancer with ultrasound tomography: First results with the Computed Ultrasound Risk Evaluation (CURE) prototype,” Med. Phys. 34, 773–785 (2007). 10.1118/1.2432161 [DOI] [PubMed] [Google Scholar]
- Duric N., Li C., Littrup P., Huang L., Glide-Hurst C. K., Rama O., Bey-Knight L., Schmidt S., Xu Y., and Lupinacci J., “Detection and characterization of breast masses with ultrasound tomography: clinical results,” Proc. SPIE 7265, 72651G-1–72651G-8 (2009). 10.1117/12.812994 [DOI] [Google Scholar]
- Boyd N. F., Martin L. J., Chavez S., Gunasekara A., Salleh A., Melnichouk O., Yaffe M., Minkin S., and Bronskill M. J., “Breast-tissue composition and other risk factors for breast cancer in young women: a cross-sectional study,” Lancet Oncol. 10, 569–580 (2009). 10.1016/S1470-2045(09)70078-6 [DOI] [PubMed] [Google Scholar]