Abstract
Band-importance functions were created using the “compound” technique [Apoux and Healy, J. Acoust. Soc. Am. 132, 1078–1087 (2012)] that accounts for the multitude of synergistic and redundant interactions that take place among speech bands. Functions were created for standard recordings of the speech perception in noise (SPIN) sentences and the Central Institute for the Deaf (CID) W-22 words using 21 critical-band divisions and steep filtering to eliminate the influence of filter slopes. On a given trial, a band of interest was presented along with four other bands having spectral locations determined randomly on each trial. In corresponding trials, the band of interest was absent and only the four other bands were present. The importance of the band of interest was determined by the difference between paired band-present and band-absent trials. Because the locations of the other bands changed randomly from trial to trial, various interactions occurred between the band of interest and other speech bands which provided a general estimate of band importance. Obtained band-importance functions differed substantially from those currently available for identical speech recordings. In addition to differences in the overall shape of the functions, especially for the W-22 words, a complex microstructure was observed in which the importance of adjacent frequency bands often varied considerably. This microstructure may result in better predictive power of the current functions.
INTRODUCTION
Much of what is known about the spectral distribution of speech information is reflected in the Speech Intelligibility Index (SII; ANSI, 1997) and its predecessor, the Articulation Index (AI; ANSI, 1969). These indexes provide a method for estimating intelligibility of various communication systems based on acoustic measures and can alleviate the need for extensive testing of human listeners. One of the key components of the Index (henceforth, the SII) are band-importance functions, which describe the relative contribution to total speech information provided by each spectral band. Data are provided for bands ranging in width from critical bands to octaves. The sum of these importance values, once each is scaled to reflect audibility, provides an SII value from 0.0 to 1.0, reflecting the proportion of total speech information available to the listener.
The band-importance functions of the SII provide not only the practical means required to calculate SII values, they are of substantial theoretical importance. These values reflect our understanding of the speech-information content of each spectral band—an understanding that is seemingly critical to our overall understanding of speech processing. Further, these values have been used in numerous empirical studies. Examples include the design of spectral bands having different frequency locations but equal a priori intelligibility (e.g., Grant and Walden, 1996) or the estimation of factors beyond acoustic speech information that impact intelligibility, such as cognitive factors involved in aging (e.g., Dubno et al., 2008).
Existing band-importance functions are based on recognition in background noise as the speech signal is subjected to successive low-pass or high-pass filtering. The importance of a band is then determined by comparing the recognition scores across two successive cutoff frequencies. A consequence of this procedure is that the importance of any spectral band is assessed when information either above it or below it in frequency is entirely intact, while the complimentary information (below it or above it) is entirely missing (e.g., French and Steinberg, 1947; Fletcher and Galt, 1950; Studebaker and Sherbecoe, 1991).
Recent years have brought an increased understanding of the multitude of redundancies and synergistic interactions that exist among speech bands (e.g., Breeuwer and Plomp, 1984, 1985; Warren et al., 1995; Lippmann, 1996; Müsch and Buus, 2001; Healy and Warren, 2003; Healy and Bacon, 2007). A simple example of this potentially profound synergy was provided by Healy and Warren (2003) who showed that speech-modulated bands that provide essentially no intelligibility when presented individually (0 or 1%) can combine to provide substantial intelligibility (81%). That same study showed that intelligibility of band pairs was a function of their spacing, reflecting the extent to which the information provided by the two bands was complimentary or redundant. Consider the following—when a particular “target” band is presented along with another band that is juxtaposed in frequency, the information provided by the target may be redundant and its importance low. Alternatively, when that same target band is presented along with a band that is more spectrally distant, its importance may increase due to the complimentary nature of the information it provides. Finally (as found by Healy and Warren, 2003), if that same target band is presented along with a band that is too disparate in frequency, the complimentary nature of the information (or perhaps its integration) may be limited, and the importance of the target may again be diminished. This is suggestive of a complex interaction between redundancy and synergy that takes place among various speech frequencies.
It should be clear from the above that the stand-alone intelligibility of isolated bands cannot be used to predict the contribution to total intelligibility that a given band provides when other bands are present. But it is also suggested that the contribution of a speech band cannot be accurately assessed based on its contribution to contiguous frequencies above or below it, as in the SII procedure. Instead, it is argued that the contribution of a particular speech band is a complex function of the extent to which it provides information that is redundant or complimentary with that of other speech bands. It should also be clear that it is difficult to predict which speech frequencies will be spared and which will be masked when speech is presented in a spectro-temporally complex background as in many everyday environments. Indeed, the concept of “glimpsing” speech in background noise involves the integration of glimpses of clean speech that change in frequency position from moment to moment, analogous to a checkerboard pattern on a spectrogram (e.g., Brungart et al., 2006; Cooke, 2006; Li and Loizou, 2007; Apoux and Healy, 2009, 2010, 2012).
Fortunately, a method has been developed to account for this potential limitation in the traditional method used to create band-importance functions. Apoux and Healy (2012) demonstrated that the importance of a speech band could be measured in a more general sense—one that takes into account synergistic and redundant interactions. In this method, a given target band is presented along with n other bands having frequency positions determined randomly. In a comparison trial, the target band is absent, but the positions of the other bands remain the same. In subsequent pairs of trials, the target band is assessed using new random frequency positions of the n other bands. The difference between performance on the band-present versus band-absent trials reflects the importance of the target band, irrespective of the location of information elsewhere in the spectrum. In other words, the resulting importance represents the manner in which the target band interacts with other bands to contribute to overall intelligibility. This method has been referred to as the “compound” approach.1Apoux and Healy (2012) used this approach to assess the importance of individual auditory-filter (ERBN) wide bands using vowel and consonant materials. In the current study, the compound approach is extended to create band-importance functions using SII band divisions and sentences and words, for which published functions exist.
A second issue that must be considered when assessing band importance involves the role of the filter slopes. Although there was some awareness of the influence of transition bands on filtered-speech intelligibility when existing ANSI band-importance functions were created, the steepness of slopes required to mitigate this influence was severely underestimated. For example, Studebaker and Sherbecoe (1991) suggested that slopes of 96 dB/octave should be sufficient to eliminate the influence of transition bands. More recent studies do not support this suggestion. In particular, Healy (1998) demonstrated that much of the high intelligibility of sentences filtered to a narrow “spectral slit” (Warren et al., 1995) can be attributed to information contained in the transition bands created by the filter skirts. The 100 Central Institute for the Deaf (CID) everyday-speech sentences (Silverman and Hirsch, 1955; Davis and Silverman, 1978) were filtered to a 1/3-octave band centered at 1500 Hz. When this band had filter slopes of 96 dB/octave [using Butterworth or finite-duration impulse response (FIR) filtering], normal-hearing listeners produced an intelligibility score of 98%. However, when the nominal 1/3-octave bandwidth was maintained but the filter slopes were increased to approximately 300 dB/octave (using a 275-order FIR filter), mean intelligibility fell to 55%. Essentially removing the transition bands through an increase in slope angle to approximately 1700 dB/octave (using a 2000-order FIR filter), resulted in a mean score of only 16%.
Subsequent work by Warren and colleagues confirmed the strong role that filter slopes play in the intelligibility of filtered speech. Warren and Bashford (1999) confirmed the relatively low intelligibility of a 1/3-octave band centered at 1500 Hz created using a 2000-order FIR filter. They also showed that isolated 96 dB/octave triangular skirts produced far higher intelligibility than did the 1/3-octave rectangular passband. Another experiment confirmed that 1/3-octave CID sentence intelligibility dropped as filter slope angles increased. A value of 4800 dB/octave was needed to eliminate the contribution of the skirts (Warren et al., 2004). Thus, restriction of the acoustic signal using sharply defined boundaries is critical.
From the above, it may be assumed that the contribution of transition bands was not eliminated in existing ANSI band-importance functions. This contribution is clearly a limitation of the SII, as the contribution to intelligibility provided by specific frequency bands within the acoustic speech spectrum is of interest for band importance. In their study, Apoux and Healy (2012) used interpolated bands of speech and noise to reduce the influence of transition bands. This technique, however, requires the relative levels of speech and noise to be selected carefully to limit masking of the target speech by spectrally adjacent noise (cf. Apoux and Healy, 2009). In the present study, a refinement of the compound approach is introduced, which involves the use of steep filter slopes to eliminate the contribution of transition bands.
The compound method provides a procedure for measuring directly the importance of clearly defined bands, while accounting for the multiple interactions that exist among speech frequencies. The purpose of the current study was to use the refined compound method to create band-importance functions for the standard recordings of the SPIN sentences (Kalikow et al., 1977) and CID W-22 phonetically balanced words (Hirsh et al., 1952), using standard band divisions, and to compare these functions with those available in the SII for these same speech materials.
EXPERIMENT 1. HIGH- AND LOW-PREDICTABILITY SPIN SENTENCES
Method
Subjects
Sixty normal-hearing listeners between the ages of 18 and 40 years (mean = 20.4) participated; fifty-five were female. They were recruited from courses at The Ohio State University and received a monetary incentive. All had pure tone audiometric thresholds at or below 20 dB HL (hearing level) at octave frequencies from 250 to 8000 Hz (ANSI, 2004, 2010). None had any prior exposure to the sentence materials employed here.
Stimuli
The materials were sentences from the revised version (Bilger et al., 1984) of the Speech Perception in Noise test (SPIN; Kalikow et al., 1977). They were extracted from the original Bolt, Beranek, and Newman recordings and are therefore the same materials specified in the SII. The audio was extracted at 44.1 kHz sampling and 16-bit resolution from an authorized compact disc (CD) version of the test [Authorized Version, Revised SPIN Test (Audio Recording), Department of Speech and Hearing Science, Champaign, IL]. The test consists of 200 high-predictability sentences in which the final words used for scoring are cued by the semantic content of the sentence (e.g., “Stir your coffee with a spoon”). There are also 200 low-predictability sentences, in which the final scoring keyword is not signaled by context (e.g., “He would think about the rag.”). The sentences are five to eight words and six to eight syllables in length, and the scoring keywords are phonetically balanced monosyllabic nouns of moderate familiarity. They were produced by a male speaker having a standard American dialect. The interested reader is directed to Kalikow et al. (1977) and to Elliott (1995) for comprehensive histories of test development and recording.
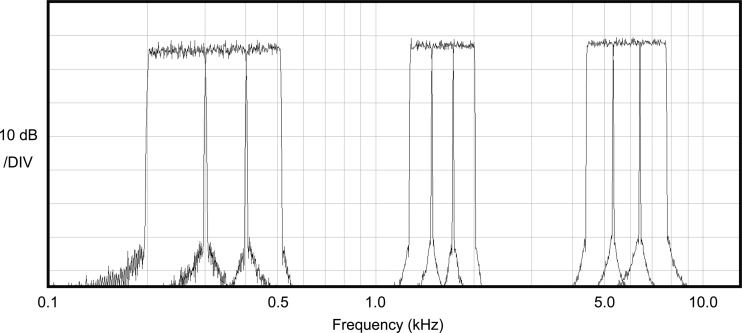
The 21 critical band divisions specified in the SII were employed (see Table TABLE I.). An FIR filter having an order ranging from 2000 (for the highest-frequency bands) to 20 000 (for the lowest-frequency bands) was employed. Filter order was adjusted for each band to produce approximately equal 8000 dB/octave slopes across the spectrum. Filter slopes were measured from cutoff to noise floor. Due to limitations associated with filtering in the low spectral region, slope values decreased somewhat below 500 Hz. However, values remained over several thousand dB/octave at 300 Hz and were approximately 1000 dB/octave at 100 Hz. Transition bandwidths below 500 Hz remained in the 3–5 Hz range.2 Figure 1 displays the output of several band-pass filters used in the present experiments. After filtering, the various group delays associated with filtering at different orders (delay = order/2, in samples) were corrected to ensure that all bands were presented in exact temporal synchrony. This processing and analysis was performed primarily in MATLAB.
TABLE I.
Band divisions employed in the SII and here.
| Band | Center frequency (Hz) | Band limits (Hz) |
|---|---|---|
| 1 | 150 | 100–200 |
| 2 | 250 | 200–300 |
| 3 | 350 | 300–400 |
| 4 | 450 | 400–510 |
| 5 | 570 | 510–630 |
| 6 | 700 | 630–770 |
| 7 | 840 | 770–920 |
| 8 | 1000 | 920–1080 |
| 9 | 1170 | 1080–1270 |
| 10 | 1370 | 1270–1480 |
| 11 | 1600 | 1480–1720 |
| 12 | 1850 | 1720–2000 |
| 13 | 2150 | 2000–2320 |
| 14 | 2500 | 2320–2700 |
| 15 | 2900 | 2700–3150 |
| 16 | 3400 | 3150–3700 |
| 17 | 4000 | 3700–4400 |
| 18 | 4800 | 4400–5300 |
| 19 | 5800 | 5300–6400 |
| 20 | 7000 | 6400–7700 |
| 21 | 8500 | 7700–9500 |
Figure 1.
Responses of the high-order FIR filters used to create the 21 speech bands. Shown are long-term average spectra of a 60-s white noise filtered using parameters for bands 2, 3, 4; 10, 11, 12; and 18, 19, 20.
Procedure
The 21 spectral bands formed 21 target-band conditions. They were distributed across three subject groups. The first randomly assigned group was assigned bands 1–7, the second group was assigned bands 8–14, and the third group was assigned bands 15–21. As stated earlier, the importance of each spectral band was assessed as information elsewhere in the spectrum was distributed randomly. The spectral band of interest (target band) was presented along with four other bands, and the location of these other bands was determined randomly from trial to trial. This number of bands was selected to place performance in the steep portion of the psychometric function relating intelligibility to number of bands as established during pilot testing. To establish the importance of each target band, trials were paired. In one member of the pair, the target band was present, along with the four other randomly selected bands. In the other member of the pair, the target band was absent, but the same four other spectral bands were present. Thus, the “fixed” number of bands technique of Apoux and Healy (2012) was employed.
Subjects heard 56 sentences in each of the seven target-band conditions. Half of those were high-predictability and half were low-predictability. The sentences forming each paired trial were always the same predictability. This arrangement therefore required a total of 392 sentences (14 sentences band present + 14 sentences band absent × 2 predictabilities × 7 target-band conditions). The first 196 of the 200 sentences in each predictability subset were used. The presentation order of high- versus low-predictability sentences alternated, and all 56 sentences in one target-band condition were completed before moving to the next. The order that target-band conditions appeared was randomized for each subject, as was the presentation of band present versus absent conditions and the condition-to-sentence correspondence within each target-band condition.
The level of each broadband sentence was set to play at 70 dBA (±2 dB) at each earphone using a flat plate coupler (Larson Davis AEC 101, Depew, NY) and Type 1 sound level meter (Larson Davis 824). The level of each individual filtered band was not modified, so that the relative spectrum level of each band was maintained. Stimuli were converted to analog form using a personal computer (PC) and Echo Digital Audio (Santa Barbara, CA) Gina3G digital-to-analog converters, and presented diotically over Sennheiser HD 280 headphones (Wedemark, Germany).
Testing was performed in a double-walled sound booth. It began with a familiarization in which the eight unused sentences (four from each predictability subset) were presented first broadband, then again as five bands, having frequencies selected randomly for each trial. Subjects responded after each trial by typing the final word of the sentence,3 and received visual correct/incorrect feedback. Following this familiarization, subjects heard the seven blocks of 56 sentences each and responded as during familiarization, but did not receive feedback. Presentation of stimuli and collection of responses was performed using custom MATLAB scripts running on a PC. The total duration of testing was approximately 2 h and subjects were required to take a break after each block of 56 sentences.
Results
Group mean intelligibility scores (%) were as follows: high-predictability band present = 72.1 (standard deviation, SD = 6.7), high-predictability band absent = 54.8 (SD = 4.4), low-predictability band present = 45.0 (SD = 8.7), low-predictability band absent = 31.5 (SD = 6.1). Band-importance values were established following Apoux and Healy (2012): The intelligibility difference between band-present and band-absent conditions was calculated for each target band for each subject, and these differences were averaged across subjects to create a mean difference for each band. These mean intelligibility differences were summed across bands and the importance of each band corresponded to the intelligibility difference of the band over the sum of the intelligibility differences.
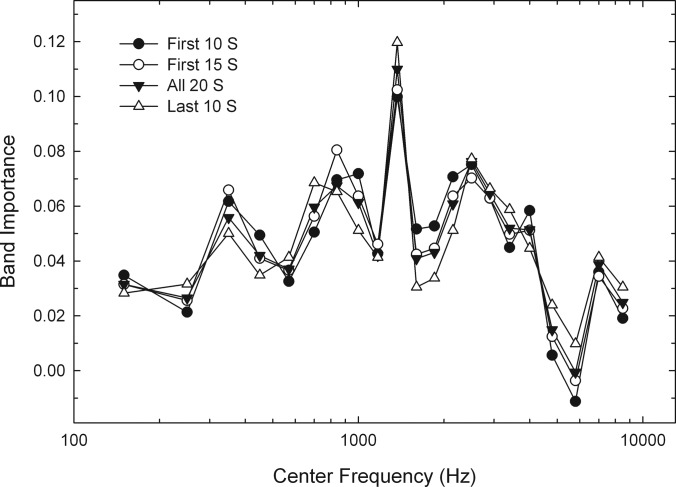
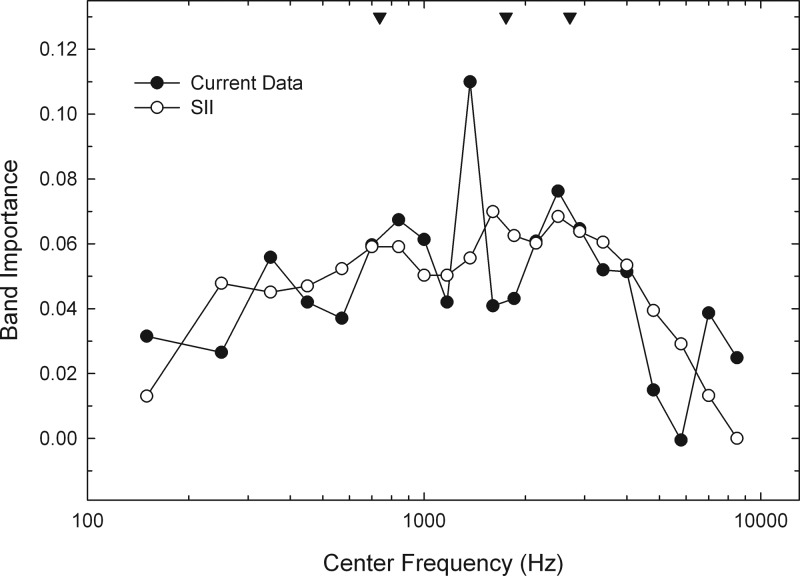
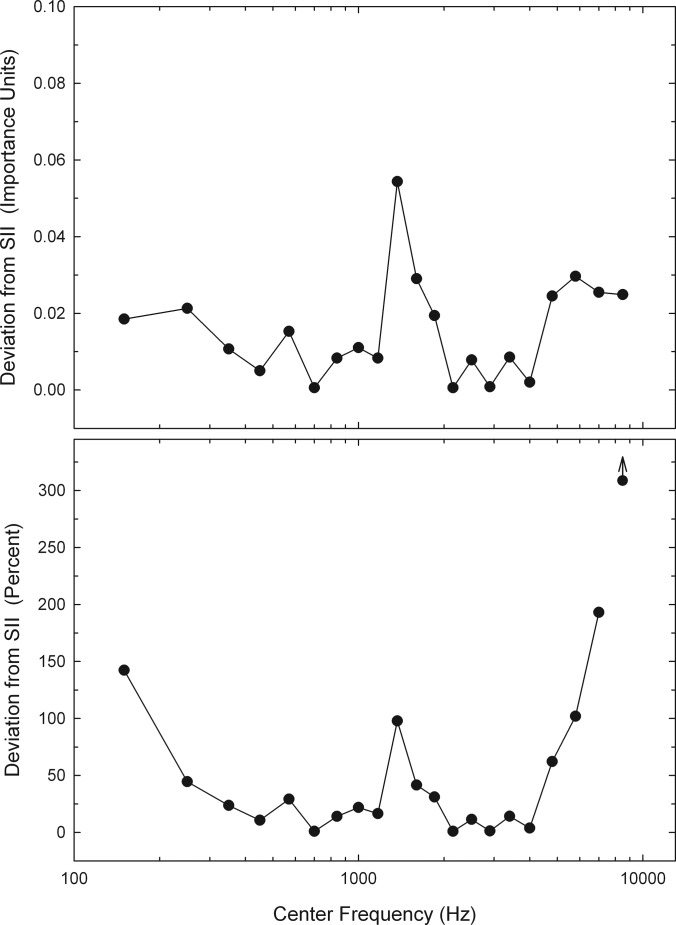
Figure 2 shows importance for each of the 21 bands. High- and low-predictability sentences were pooled in this view, as the single SII band-importance function represents both predictability subsets. Shown are data based on the first 10 subjects run in each of the three frequency regions, the first 15 subjects, all 20 subjects, and the second subgroup of 10 subjects run. Apparent are large variations across successive frequency bands that are relatively stable across different numbers of subjects and similar across the first and second subgroups of ten randomly selected subjects. Figure 3 shows the band-importance function obtained in the current experiment (based on all 20 subjects in each spectral region and both high- and low-predictability sentences) plotted against that for the identical speech materials in the SII. As can be seen, the overall shapes of the two functions are similar. However, the variations across successive bands observed here cause the importance of individual bands to differ substantially across the two functions. Also shown are values for the first three formant frequencies, based on the average of final words from 50 randomly selected sentences. Values were determined in Praat using linear predictive coding and a maximum formant frequency limit of 5000 Hz (Boersma and Weenink, 2011). Figure 4 (top panel) displays absolute deviations from SII values for each band. These deviations range up to an importance of 0.054 (corresponding to 5.4% of the total information in speech). The bottom panel displays these deviations in percent, such that observed importance values that were double those in the SII would be assigned a deviation of 100% [(|current importance value − SII importance value|/SII importance value) × 100]. These deviations range up to 193% and average 43%. They are greatest for the lowest and highest bands, and for band 10 (1370 Hz).
Figure 2.
Band importance values for SPIN sentences for each of 21 speech bands. High- and low-predictability sentences were pooled. Shown are functions for (a) the first randomly selected subgroup of 10 subjects in each frequency region, (b) the first 15 subjects, (c) all 20 subjects, and (d) the second randomly selected subgroup of 10 subjects in each frequency region.
Figure 3.
Band importance values for SPIN sentences obtained in the current experiment (high- and low-predictability sentences pooled) versus those described in the SII for identical speech materials. The first three formant frequencies are indicated by inverted triangles at the top of the panel.
Figure 4.
The top panel shows absolute deviations from SII importance values for each band in band-importance units. The bottom panel shows these deviations in percent (|current importance value − SII importance value|/SII importance value). Because the SII importance for band 21 is zero, a percent difference could not be calculated in the bottom panel.
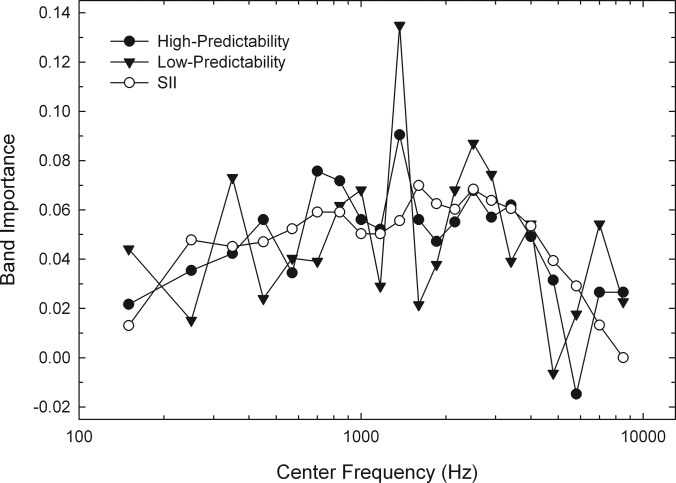
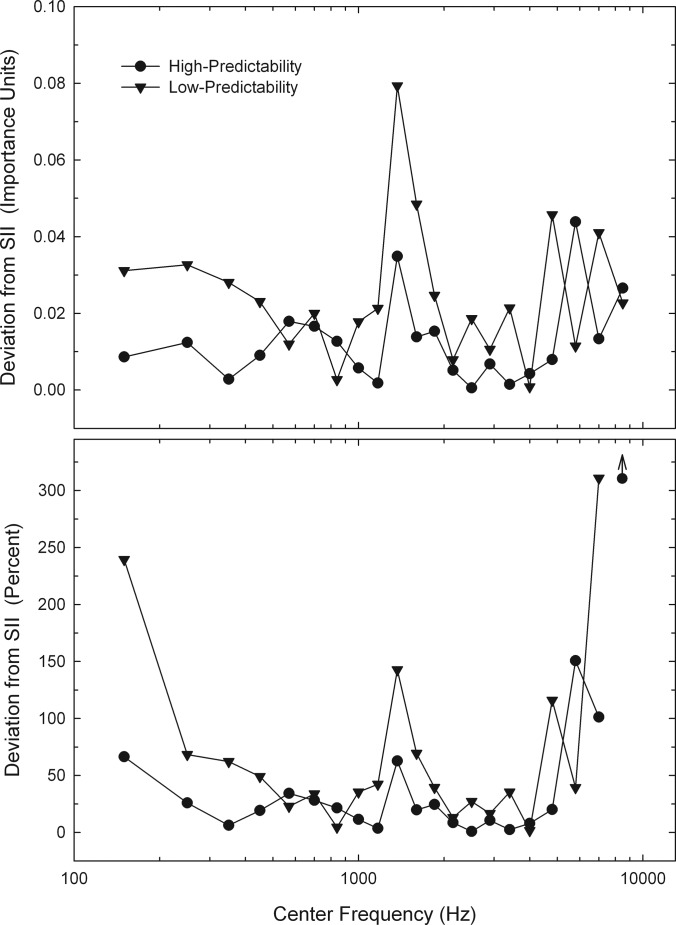
Figure 5 displays band-importance functions for high-predictability and low-predictability sentences separately. Although these two functions are generally similar in shape, differences in the importance of individual bands are again evident. Figure 6 shows absolute deviations from SII importance values for high- and low-predictability sentences separately. The top panel displays deviations in band importance units and the bottom panel shows these deviations in percent. As can be seen, the deviations from the SII are generally larger for the low-predictability subset of sentences. The absolute deviations for the high- and low-predictability sentences average 0.012 and 0.025, respectively, and 31 and 68%, respectively.
Figure 5.
Band-importance functions for high-predictability and low-predictability SPIN sentences. Also shown is the SII function for identical speech materials.
Figure 6.
The top panel shows absolute deviations from SII importance values for high- and low-predictability SPIN sentences in band-importance units. The bottom panel shows these deviations in percent as in Fig. 4. Again, percent difference could not be calculated in the bottom panel for band 21.
EXPERIMENT 2. PHONETICALLY BALANCED WORDS
Method
Subjects
Sixty normal-hearing listeners (55 female) between the ages of 18 and 41 years (mean = 21.1) participated. Of these, 32 participated in Experiment 1. Their recruitment, compensation, and audiometric characteristics were the same as in Experiment 1, except that two subjects had a threshold of 25 dB HL at 8 kHz in the left ear. None had any prior exposure to the word materials employed here.
Stimuli and procedure
The materials were drawn from the phonetically balanced lists of the CID W-22 test (Hirsh et al., 1952). The test consists of 200 words produced by a male speaker having a general American dialect in the carrier phrase, “You will say ___.” The materials were extracted from the original recordings by Technisonic Studios (St. Louis, MO) and are therefore the particular recordings specified in the SII. The 44.1 kHz, 16-bit digital signal was extracted from CD (Auditory Research Laboratory, VA Medical Center, Mountain Home, TN, 2006), which in turn originated from original Technisonic tape that was digitized at 20 kHz and 16-bit resolution. The processing of these words into 21 critical bands followed the procedures of Experiment 1.
As in Experiment 1, subjects were divided randomly into three groups and assigned target bands 1–7, 8–14, or 15–21. Again, trials in which the target band was present were paired with trials in which the target was absent, and four other randomly located bands appeared along with the target band. Subjects heard 26 words (13 words band present/13 words band absent) in each of the 7 target-band conditions. Fifteen words were reserved for practice, necessitating a total of 197 words (“mew,” “two,” and “dull” were omitted). Target-band conditions were blocked such that all 26 trials in one condition were completed before moving on to the next. The order of target-band conditions, the appearance of band present versus absent, and the word-to-condition correspondence was randomized for each listener.
Testing began with familiarization consisting of 15 words heard first broadband, then as five randomly located bands. As in Experiment 1, subjects typed responses after each trial,4 and received trial-by-trial feedback during familiarization, but not during formal testing. All other procedures and apparatus were identical to those in Experiment 1. The total duration of testing was approximately 1 h and subjects were required to take a break after every 52 words.
Results
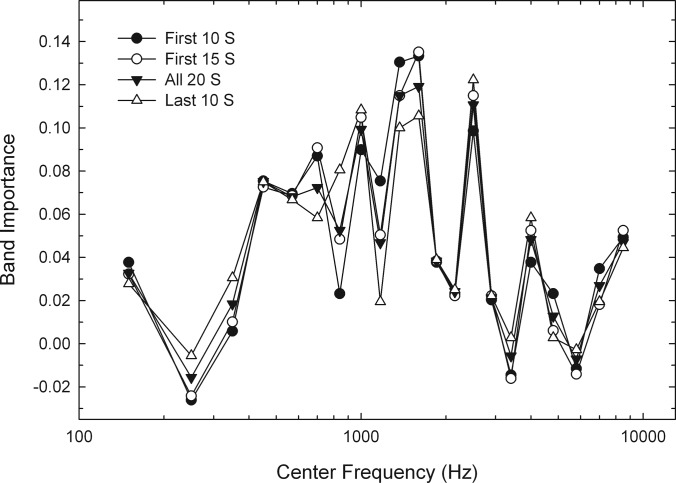
Band importance was calculated as in Experiment 1. Group mean intelligibility scores (%) were 42.2 (SD = 8.3) for band present and 29.3 (SD = 5.0) for band absent. Figure 7 shows band-importance functions for phonetically balanced words based on the first 10, 15, and 20 subjects run in each of the three frequency regions, as well as the last 10 randomly selected subjects run in each frequency region. As was the case for the SPIN sentences, substantial variation across successive frequency bands exists, and these variations appear stable across various numbers of subjects and independent subgroups of listeners.
Figure 7.
Band-importance functions for CID W-22 phonetically balanced words. As in Fig. 2, functions are shown based on the first 10, 15, and 20 subjects run in each of three frequency regions, as well as for the second subgroup of 10 subjects run.
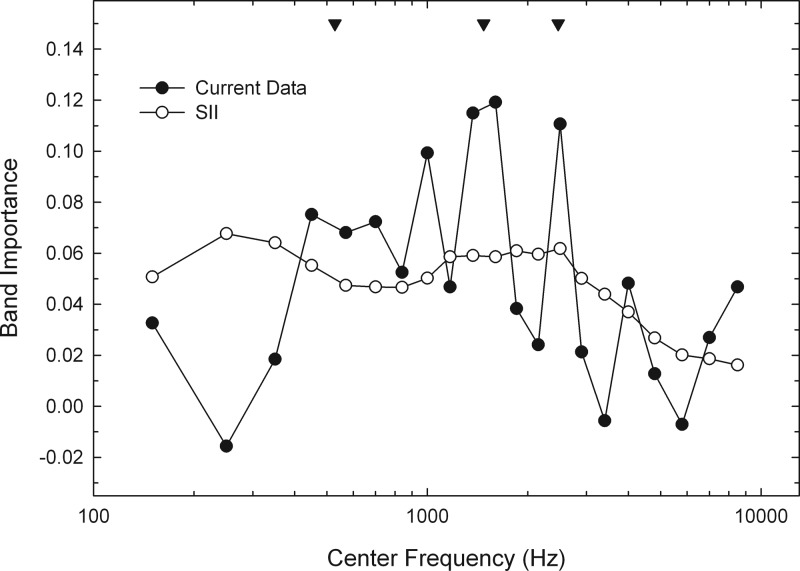
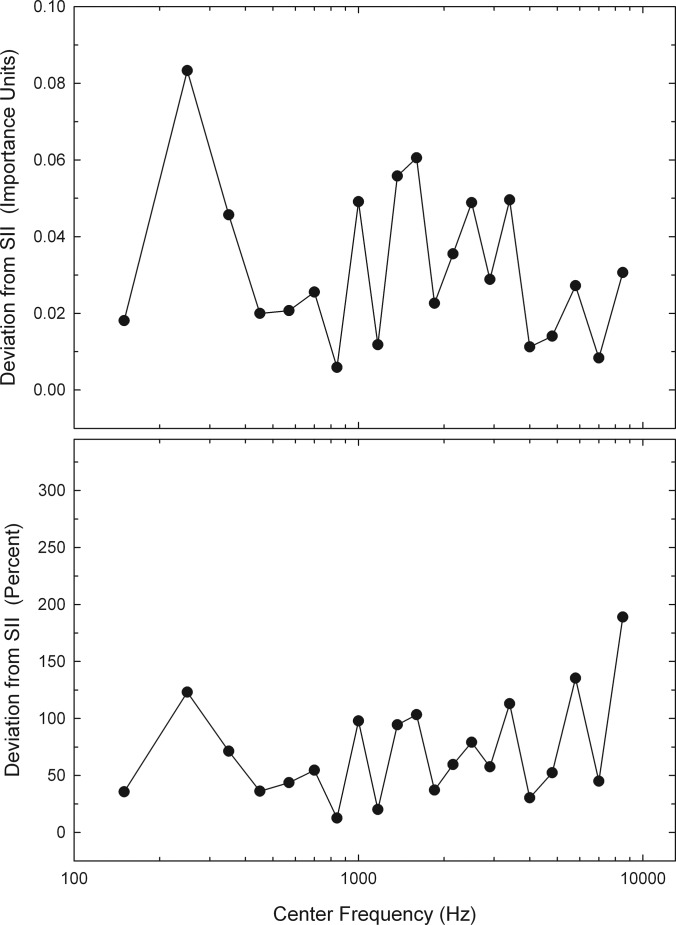
Figure 8 displays the band-importance function obtained in the current study against that described for the identical speech materials in the SII. Whereas the SII function is relatively flat below 2900 Hz and gradually sloping above that value, the function obtained here has the inverted “U” shape that is characteristic of the SPIN sentences and most other speech materials. Substantial variation across individual bands is also apparent. The first three formant frequencies are indicated in Fig. 8, based on the average of 50 randomly chosen final words. The deviations from the SII function are plotted in Fig. 9. The top panel shows values in band-importance units and the bottom panel shows values in percent. Absolute deviations in importance of individual bands ranged as high as 0.083 (corresponding to 8.3% of total speech information). Expressed in percent, deviation values ranged up to 189% and averaged 71% across bands.
Figure 8.
The band-importance function obtained here for CID W-22 words versus those described in the SII for the identical speech materials. The first three formant frequencies are indicated by inverted triangles at the top of the panel.
Figure 9.
As Fig. 4, but for W-22 words. Unlike Fig. 4, percent deviations could be calculated for all bands because SII importance is non-zero for all bands.
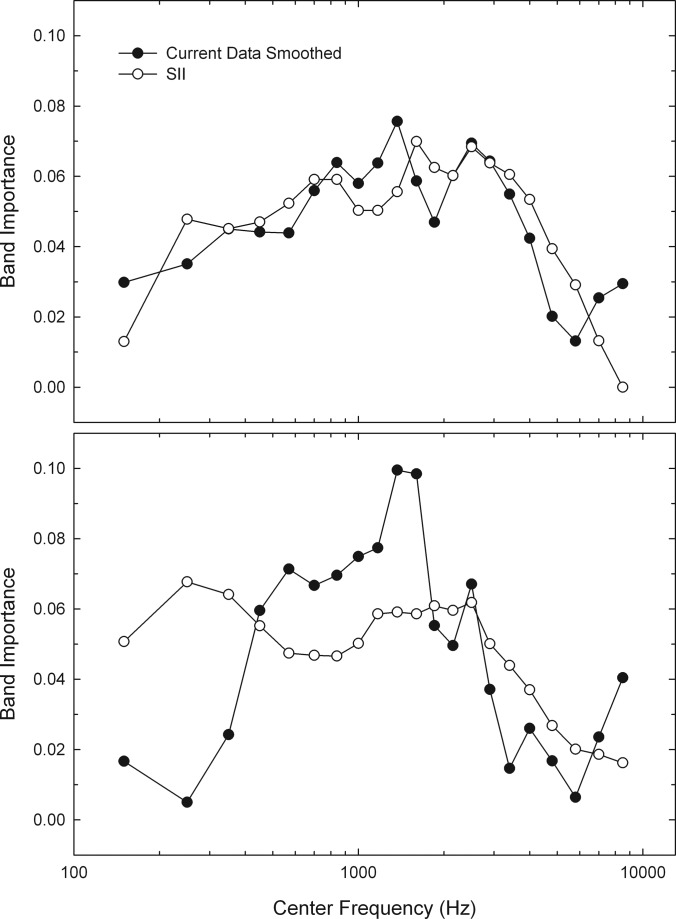
Finally, the impact of smoothing the band-importance functions was assessed. A triangular window was employed, in which the importance of band[n] (I[n]) was defined as
| (1) |
The highest and lowest bands were included in this process to provide a greater impact of smoothing. Band 1 was smoothed using
| (2) |
and band 21 was smoothed using
| (3) |
Thus, the smoothed importance of band [n] always included the importance of the adjacent band(s) at half weight. Figure 10 shows the band-importance functions obtained here following this smoothing as well as corresponding functions from the SII. Although the discrepancies between the functions obtained here and those in the SII are reduced somewhat by smoothing, differences remain, especially for the W-22 words (Fig. 10, bottom panel).
Figure 10.
Shown are band-importance functions obtained in the current study following smoothing across bands using a triangular weighting window. Corresponding functions from the SII are also displayed. The top panel shows the functions for the SPIN sentences, and the bottom panel shows functions for the CID W-22 words.
DISCUSSION
The primary advantages of the compound method as implemented here include (i) resulting band-importance functions that account for the multitude of interactions that take place among various spectral regions and (ii) the restriction of speech information to sharply defined spectral regions. Figures 38 show that the resulting functions differ considerably from those in the SII despite the use of identical speech recordings. While the overall shape of the function obtained here for the SPIN sentences is generally similar to the corresponding SII function, the function obtained here for the W-22 words bears little resemblance to that in the SII. The current functions are also differentiated from those in the SII through the existence of a complex microstructure in which the importance of adjacent bands may differ substantially. This microstructure is apparent in the band-importance functions for both the SPIN sentences and W-22 words. As the numerical band-importance values obtained in the current study may be of some utility, they have been provided in Table TABLE II..5
TABLE II.
Band-importance values obtained in the current study for SPIN sentences (Experiment 1) and CID W-22 phonetically balanced words (Experiment 2).
| Band | High-predictability SPIN | Low-predictability SPIN | High- and low-predictability SPIN pooled | W-22 |
|---|---|---|---|---|
| 1 | 0.0216 | 0.0441 | 0.0315 | 0.0326 |
| 2 | 0.0354 | 0.0151 | 0.0265 | −0.0156 |
| 3 | 0.0423 | 0.0732 | 0.0558 | 0.0184 |
| 4 | 0.0560 | 0.0240 | 0.0420 | 0.0752 |
| 5 | 0.0344 | 0.0404 | 0.0370 | 0.0681 |
| 6 | 0.0757 | 0.0391 | 0.0597 | 0.0724 |
| 7 | 0.0718 | 0.0618 | 0.0674 | 0.0525 |
| 8 | 0.0560 | 0.0681 | 0.0613 | 0.0993 |
| 9 | 0.0521 | 0.0290 | 0.0420 | 0.0468 |
| 10 | 0.0905 | 0.1349 | 0.1099 | 0.1149 |
| 11 | 0.0560 | 0.0214 | 0.0409 | 0.1191 |
| 12 | 0.0472 | 0.0378 | 0.0431 | 0.0383 |
| 13 | 0.0551 | 0.0681 | 0.0608 | 0.0241 |
| 14 | 0.0679 | 0.0870 | 0.0763 | 0.1106 |
| 15 | 0.0570 | 0.0744 | 0.0646 | 0.0213 |
| 16 | 0.0619 | 0.0391 | 0.0519 | −0.0057 |
| 17 | 0.0492 | 0.0542 | 0.0514 | 0.0482 |
| 18 | 0.0315 | −0.0063 | 0.0149 | 0.0128 |
| 19 | −0.0148 | 0.0177 | −0.0006 | −0.0071 |
| 20 | 0.0266 | 0.0542 | 0.0387 | 0.0270 |
| 21 | 0.0266 | 0.0227 | 0.0249 | 0.0468 |
Figures 27 show the functions generated by the first group of ten subjects in each condition relative to that generated by the final ten subjects. Because subjects were assigned to groups randomly, these “first ten” and “last ten” subgroups can be considered separate estimates by independent groups. The functions generated by these independent groups are highly similar, including the characteristic peaks and valleys in each function. This clearly indicates that the microstructure present for both sentences and words is not attributable to random variation and is instead reflective of the truly differing contribution of various bands. While the predictive power of the current band-importance values relative to that of the SII has yet to be determined, the microstructure present in the current functions suggests increased sensitivity to the contribution of individual bands, which may in turn result in greater predictive power.
The existence of substantial microstructure that is reliable across independent estimates argues against the use of smoothing across frequency bands. This is the reason that smoothing was not employed in the majority of the analyses or to derive the values in Table TABLE II.. However, smoothed functions were displayed in Fig. 10 to assess whether the lack of smoothing in the current study caused the dissimilarities observed between the current functions and those in the SII. The successive high-pass/low-pass filtering technique on which the SII functions are based employs smoothing of raw recognition scores, sometimes performed simply by eye. But as Fig. 10 shows, smoothing cannot account for the differences observed. It is also important to note that the deviations reported here between the current band-importance values and those in the SII are likely increased by the different use of smoothing across the two techniques. However, it can be argued that these differences in smoothing form a portion of the overall difference between the two techniques, so the deviations as currently measured capture this important difference.
The deviations from SII values are detailed in Fig. 4 for the SPIN sentences. The function is relatively stable across frequencies at approximately 0.02 when expressed as deviations in units of importance (top panel). An exception appears for band 10 (1370 Hz) where the deviation is 0.054. This difference in importance between the current function and that in the SII is quite substantial, as the current importance value of 0.1099 indicates that band 10 contributes 10.99% of the total information in speech, whereas the SII importance of 0.0556 indicates a contribution of only 5.56%. The bottom panel of Fig. 4 provides percent deviations from SII values. The “U” shape results from the fact that importance values reported in the SII for the lowest- and highest-frequency bands approach zero, whereas those obtained here are higher. Figure 9 provides the same analysis for the W-22 words. The deviations expressed both in importance units and in percent are relatively flat across frequency. However, as Fig. 9 suggests, these deviations are quite large—even larger than for SPIN sentences. The differences in importance as high as 0.083 suggest that current ANSI functions underestimate individual band contributions to total speech information by as much as 8.3%.
As stated earlier, the band-importance values provided in the SII represent both the high-predictability and low-predictability sentences of the SPIN test. Figure 5 shows that the high- and low-predictability importance functions share the same general shape, including substantial and somewhat similar microstructure. This result supports the SII assertion that a single band-importance function may be used for both predictability subsets of the SPIN test (see also Bell et al., 1992). However, the deviations from SII values are considerably larger for the low-predictability sentences than for the high-predictability sentences. In fact, the deviations are roughly double for the low-predictability sentences, relative to the high, when expressed in importance units or percent. This current result suggests that the SII band-importance function may better characterize the high-predictability subset of the SPIN test.
Shown in Figs. 38 are the locations of the first three formants for the corresponding speech materials. Formants 1 and 3 appear to align reasonably well with modest peaks in the importance function for the SPIN sentences. However, the prominent peak at 1370 Hz (band 10) does not align well with Formant 2. The correspondence is somewhat better in Experiment 2 for the W-22 words. Formants 2 and 3 appear to align well with prominent peaks in the function, and Formant 1 aligns with a more modest peak. These results suggest that the microstructure observed in the current band-importance functions can be related to acoustic aspects of the particular speech recordings employed, perhaps formant frequencies. Accordingly, it is suggested that band importance may need to be estimated using materials spoken by numerous talkers, if it is desired to have the resulting functions represent speech more generally. Although this concept is clear in early writings (Fletcher and Steinberg, 1929; Fletcher and Galt, 1950; both in Fletcher, 1995, pp. 278–279), it is not in practice today. Rather, the SII provides importance functions for several different speech tests based primarily on particular single-talker recordings. We can refer to this dependence of band importance on specific recordings as a talker effect.
There is a related point that we can refer to as a speech-material effect. In conceptualizing the Articulation Index, French and Steinberg (1947) considered speech to consist of articulation units—a succession of individual sounds received by the ear in their initial order and spacing in time. This view is reflected in their focus on acoustic speech and noise levels, and their use of meaningless consonant-vowel-consonant (CVC) syllables and “syllable articulation,” defined as the percentage of syllables for which all three component sounds were perceived correctly. But we are now more aware that the use of these strictly bottom-up speech cues might change as the amount of top-down information changes. Certainly, less information is needed to maintain communication as contextual information increases. This is reflected by the increasing slopes of transfer functions representing syllables versus words versus sentences. A question that remains involves the extent to which band importance is determined by talker effects, or if it is also affected by speech-material effects (i.e., syllables versus words versus sentences).
A primary advantage of the compound method as currently implemented involves the use of steep filter slopes to restrict speech information to well-defined regions. The SII importance values for SPIN sentences were estimated using slopes of 96 dB/octave (Bell et al., 1992). It is unknown to what extent this aspect of processing may have influenced the shape of the function. But it is clear that considerable amounts of speech information can reside in the transition bands created by such slopes, and that listeners can use this information that exists outside of the band of interest (the passband) to recognize sentences (Healy, 1998; Warren and Bashford, 1999; Warren et al., 2004). Functions for the CID W-22 words were estimated using generally steeper slopes (0.86 dB/Hz, Studebaker and Sherbecoe, 1991). However, the use of constant dB/Hz values results in widely varying slopes in terms of dB/octave. Further, these slopes could be considered quite shallow in the lower frequencies. The use of steep and consistent filtering (see Fig. 1) allows the importance of clearly defined regions of the spectrum to be assessed without the complicating influences of information contained in transition bands. However, it is important to note that the use of steep filtering alone is not sufficient to assess band importance (e.g., Warren et al., 2005, 2011). The intelligibility of isolated or paired speech bands, even those having steep slopes, cannot approximate the multitude of interactions that take place among various speech frequencies.
The current study involved a large number of subjects (N = 120) each committing a substantial amount of time. In order to examine whether stable results can be obtained with fewer subjects, importance functions were created using data from the first 10, the first 15, then all 20 subjects in each of the three frequency regions in each experiment. As Figs. 27 show, the functions generated by the first 10 or 15 subjects are quite similar to those generated by all 20. It may therefore be concluded that another advantage of the compound method is that it requires fewer subjects than other approaches to accurately estimate band-importance functions. However, this limited subject requirement may depend upon a number of factors (e.g., number of trials, number of talkers, speech materials, etc.). For instance, Apoux and Healy (2012) found that band-importance functions for multitalker CVC and VCV (vowel-consonant-vowel) phonemes continued to stabilize after the first 10–20 subjects.
The traditional high-pass/low-pass filtering technique of estimating band-importance functions requires independent control of speech bandwidth and overall level of performance. To accomplish this goal, background noise is added at various levels to adjust overall level of performance. Although noise has the effect of reducing to some extent the influence of shallow filter slopes, it selectively masks lower-amplitude portions of the signal and reduces modulation depth. Further, although early reports found a generally linear relation between contribution of a band and the effective SNR within that band (French and Steinberg, 1947; see also Steeneken and Houtgast, 1980), more recent work has shown that background noise can affect the shape of the band-importance function. For example, Apoux and Bacon (2004) estimated functions for consonants using the hole technique (Shannon et al., 2001; Kasturi et al., 2002; Apoux and Bacon, 2004) with and without a background noise. It was found that the shape of the functions obtained in quiet and in noise differed substantially. Apoux and Bacon attributed this effect to the differential effect of noise on various acoustic speech cues. It may be desirable to obtain the relative contribution of each speech band to overall intelligibility without these complicating influences of noise, as in the current study, and to examine subsequently the degrading influence of noise on each band.
SUMMARY AND CONCLUSIONS
In the current study, band-importance functions based on 21 critical bands were established for SPIN sentences and CID W-22 words using the compound technique and an additional refinement involving extremely steep filter slopes. These functions were compared to those for identical recordings in the SII (ANSI, 1997). The current method provides importance estimates for strictly defined spectral regions, while accounting for the multitude of synergistic and redundant interactions that take place across the speech spectrum. It is also computationally simpler and more efficient than that traditionally used to evaluate band importance. Substantial differences were observed in the shapes of the functions obtained here relative to those in the SII, especially for the W-22 words. The current importance functions are also apparently more sensitive to the contribution of particular spectral bands, as reflected in the substantial microstructure observed currently.
ACKNOWLEDGMENTS
This work was supported in part by grants from the National Institute on Deafness and other Communication Disorders (Grant No. DC8594 to E.W.H. and Grant No. DC9892 to F.A.). We are grateful for the data collection and analysis assistance of Carla Youngdahl and Mandi Grumm, and the manuscript preparation assistance of Kelsey Richardson and Lorie D'Elia.
Footnotes
Other techniques to create band-importance functions exist, which may also account to some degree for between-band interactions. These techniques include the correlational method, in which the importance of a given band is determined by the correlation between the amount of noise in that band and speech recognition (Doherty and Turner, 1996; Turner et al., 1998; Apoux and Bacon, 2004; Calandruccio and Doherty, 2007), and the hole technique, in which the importance of a given band is determined by removing that band (or pair of bands) from the spectrum and assessing speech recognition (Shannon et al., 2001; Kasturi et al., 2002; Apoux and Bacon, 2004). Reasons why the correlational and hole techniques could not be used are discussed in Apoux and Healy (2012).
Although filter slope (rather than, e.g., transition bandwidth in Hz) was held approximately constant in the current study, it should be noted that slope angle values become less meaningful as slopes become very steep. This is because extremely small differences in transition bandwidth can lead to extremely large numerical differences in filter slope, as the slope value approaches infinity. Further, these values can depend heavily upon measurement accuracy (e.g., fast-Fourier transform size and measurement point selection). For example, a negligible decrease in transition bandwidth from 5 Hz to 4 Hz (assuming a cutoff of 1500 Hz and 70 dB SNR) yields an increase in slope value of 3800 dB/octave. A further decrease from 4 Hz to 3 Hz yields a further increase of 5700 dB/octave.
Only exact case-insensitive matches were accepted in this experiment. Homophones and misspellings were not accepted because any such responses would transpose overall scores up slightly in each condition, but would not affect the band-present/band-absent difference. Further, misspellings require subjective evaluation of inaccurate responses. An analysis involving a subset of data indicated that the influence of accepting alternative responses was slight and similar in both band-present and band-absent conditions—the mean increase across six conditions examined (2 band present/absent × 3 target-band frequencies) was 1%, with a range of 0.4%–1.6%.
Unlike the SPIN sentences in Experiment 1, for which even the low-predictability subset narrowed the possible responses to specific parts of speech, the W-22 words lacked context needed to distinguish homophones. Accordingly, pilot testing indicated large numbers of homophone responses, relative to the numbers observed in Experiment 1. Although band-present/band-absent difference scores should remain unaffected, strict response criteria may have reduced recognition scores close to floor values, where difference scores could have been compressed. Thus, homophone responses (e.g., bread, bred) were accepted in this experiment.
A small proportion of importance estimates are slightly negative. This is especially apparent for the W-22 words in Fig. 8. This could potentially result from two sources. One possibility is that the presence of these few bands is truly detrimental. This could result from these bands masking especially important bands higher in frequency. Alternatively, some type of systematically misleading information could have been provided by these bands. For example, they may have been misinterpreted as specific formants, when in fact they were not. However, it is far simpler to interpret this small number of slightly negative values simply as noise in the data, resulting from slightly lower scores in those band-present conditions, relative to the corresponding band-absent conditions. The one negative importance value in Experiment 1 (Fig. 3) resulted from a 0.2% difference between band-present and band-absent conditions, and the three negative values in Experiment 2 (Fig. 8) resulted from differences that averaged 2.6%. The decision was made to allow these negative values to remain in Table TABLE II., as this allows the decision to either use the values as empirically derived, or convert them to zero and recalculate importance.
References
- ANSI (1969). S3.5, American National Standard Methods for the Calculation of the Articulation Index (Acoustical Society of America, New York: ). [Google Scholar]
- ANSI (1997). S3.5 (R2007), American National Standard Methods for the Calculation of the Speech Intelligibility Index (Acoustical Society of America, New York: ). [Google Scholar]
- ANSI (2004). S3.21 (R2009), American National Standard Methods for Manual Pure-Tone Threshold Audiometry (Acoustical Society of America, New York: ). [Google Scholar]
- ANSI (2010). S3.6, American National Standard Specification for Audiometers (Acoustical Society of America, New York: ). [Google Scholar]
- Apoux, F., and Bacon, S. P. (2004). “Relative importance of temporal information in various frequency regions for consonant identification in quiet and in noise,” J. Acoust. Soc. Am. 116, 1671–1680. 10.1121/1.1781329 [DOI] [PubMed] [Google Scholar]
- Apoux, F., and Healy, E. W. (2009). “On the number of auditory filter outputs needed to understand speech: Further evidence for auditory channel independence,” Hear. Res. 255, 99–108. 10.1016/j.heares.2009.06.005 [DOI] [PMC free article] [PubMed] [Google Scholar]
- Apoux, F., and Healy, E. W. (2010). “Relative contribution of off- and on-frequency spectral components of background noise to the masking of unprocessed and vocoded speech,” J. Acoust. Soc. Am. 128, 2075–2084. 10.1121/1.3478845 [DOI] [PMC free article] [PubMed] [Google Scholar]
- Apoux, F., and Healy, E. W. (2012). “Use of a compound approach to derive auditory-filter-wide frequency-importance functions for vowels and consonants,” J. Acoust. Soc. Am. 132, 1078–1087. 10.1121/1.4730905 [DOI] [PMC free article] [PubMed] [Google Scholar]
- Bell, T. S., Dirks, D. D., and Trine, T. D. (1992). “Frequency-importance functions for words in high- and low-context sentences,” J. Speech Hear. Res. 35, 950–959. [DOI] [PubMed] [Google Scholar]
- Bilger, R. C., Nuetzel, J. M., Rabinowitz, W. M., and Rzeczkowski, C. (1984). “Standardization of a test of speech perception in noise,” J. Speech Hear. Res. 27, 32–48. [DOI] [PubMed] [Google Scholar]
- Boersma, P., and Weenink, D. (2011). “Praat: Doing phonetics by computer (Version 4.3.22) [computer program],” http://www.praat.org (Last viewed April 15, 2011).
- Breeuwer, M., and Plomp, R. (1984). “Speechreading supplemented with frequency-selective sound-pressure information,” J. Acoust. Soc. Am. 76, 686–691. 10.1121/1.391255 [DOI] [PubMed] [Google Scholar]
- Breeuwer, M., and Plomp, R. (1985). “Speechreading supplemented with formant-frequency information from voiced speech,” J. Acoust. Soc. Am. 77, 314–317. 10.1121/1.392230 [DOI] [PubMed] [Google Scholar]
- Brungart, D. S., Chang, P. S., Simpson, B. D., and Wang, D. (2006). “Isolating the energetic component of speech-on-speech masking with ideal time-frequency segregation,” J. Acoust. Soc. Am. 120, 4007–4018. 10.1121/1.2363929 [DOI] [PubMed] [Google Scholar]
- Calandruccio, L., and Doherty, K. A. (2007). “Spectral weighting strategies for sentences measured by a correlational method,” J. Acoust. Soc. Am. 121, 3827–3836. [DOI] [PubMed] [Google Scholar]
- Cooke, M. P. (2006). “A glimpsing model of speech perception in noise,” J. Acoust. Soc. Am. 119, 1562–1573. 10.1121/1.2166600 [DOI] [PubMed] [Google Scholar]
- Davis, H., and Silverman, S. R. (1978). Hearing and Deafness, 4th ed. (Holt, Rinehart, and Winston, New York: ), pp. 492–495. [Google Scholar]
- Doherty, K. A., and Turner, C. W. (1996). “Use of a correlational method to estimate a listener's weighting function for speech,” J. Acoust. Soc. Am. 100, 3769–3773. [DOI] [PubMed] [Google Scholar]
- Dubno, J. R., Lee, F -S., Matthews, L. J., Ahlstrom, J. B., Horwitz, A. R., and Mills, J. H. (2008). “Longitudinal changes in speech recognition in older persons,” J. Acoust. Soc. Am. 123, 462–475. 10.1121/1.2817362 [DOI] [PubMed] [Google Scholar]
- Elliott, L. L. (1995). “Verbal auditory closure and the speech perception in noise (SPIN) test,” J. Speech Hear. Res. 38, 1363–1376. [DOI] [PubMed] [Google Scholar]
- Fletcher, H. (1995). Speech and Hearing in Communication, edited by Allen J. B. (Acoustical Society of America, Melville, NY: ), pp. 278–279. [Google Scholar]
- Fletcher, H., and Galt, R. H. (1950). “The perception of speech and its relation to telephony,” J. Acoust. Soc. Am. 22, 89–151. 10.1121/1.1906605 [DOI] [Google Scholar]
- Fletcher, H., and Steinberg, J. C. (1929). “Articulation testing methods,” Bell Systems Tech. J. 8, 806. [Google Scholar]
- French, N. R., and Steinberg, J. C. (1947). “Factors governing the intelligibility of speech sounds,” J. Acoust. Soc. Am. 19, 90–119. 10.1121/1.1916407 [DOI] [Google Scholar]
- Grant, K. W., and Walden, B. E. (1996). “Spectral distribution of prosodic information,” J. Speech Hear. Res. 39, 228–238. [DOI] [PubMed] [Google Scholar]
- Healy, E. W. (1998). “A minimum spectral contrast rule for speech recognition: Intelligibility based upon contrasting pairs of narrow-band amplitude patterns,” Ph.D. dissertation, The University of Wisconsin–Milwaukee, http://www.proquest.com/, Publication Number: AAT9908202, pp. 56–73. [Google Scholar]
- Healy, E. W., and Bacon, S. P. (2007). “Effect of spectral frequency range and separation on the perception of asynchronous speech,” J. Acoust. Soc. Am. 121, 1691–1700. 10.1121/1.2427113 [DOI] [PubMed] [Google Scholar]
- Healy, E. W., and Warren, R. M. (2003). “The role of contrasting temporal amplitude patterns in the perception of speech,” J. Acoust. Soc. Am. 113, 1676–1688. 10.1121/1.1553464 [DOI] [PubMed] [Google Scholar]
- Hirsh, I. J., Davis, H., Silverman, S. R., Reynolds, E. G., Eldert, E., and Benson, R. W. (1952). “Development of materials for speech audiometry,” J. Speech Hear. Disord. 17, 321–337. [DOI] [PubMed] [Google Scholar]
- Kalikow, D. N., Stevens, K. N., and Elliott, L. L. (1977). “Development of a test of speech intelligibility in noise using sentence materials with controlled word predictability,” J. Acoust. Soc. Am. 61, 1337–1351. 10.1121/1.381436 [DOI] [PubMed] [Google Scholar]
- Kasturi, K., Loizou, P. C., Dorman, M., and Spahr, T. (2002). “The intelligibility of speech with ‘holes’ in the spectrum,” J. Acoust. Soc. Am. 112, 1102–1111. 10.1121/1.1498855 [DOI] [PubMed] [Google Scholar]
- Li, N., and Loizou, P. C. (2007). “Factors influencing glimpsing of speech in noise,” J. Acoust. Soc. Am. 122, 1165–1172. 10.1121/1.2749454 [DOI] [PMC free article] [PubMed] [Google Scholar]
- Lippmann, R. P. (1996). “Accurate consonant perception without mid-frequency speech energy,” IEEE Trans. Speech Audio. Process. 4, 66–69. 10.1109/TSA.1996.481454 [DOI] [Google Scholar]
- Müsch, H., and Buus, S. (2001). “Using statistical decision theory to predict speech intelligibility. I. Model structure,” J. Acoust. Soc. Am. 109, 2896–2909. 10.1121/1.1371971 [DOI] [PubMed] [Google Scholar]
- Shannon, R. V., Galvin, J. J., III., and Baskent, D. (2001). “Holes in hearing,” J. Assoc. Res. Otolaryngol. 3, 185–199. [DOI] [PMC free article] [PubMed] [Google Scholar]
- Silverman, S. R., and Hirsh, I. J. (1955). “Problems related to the use of speech in clinical audiometry,” Ann. Otol. Rhinol. Laryngol. 64, 1234–1245. [DOI] [PubMed] [Google Scholar]
- Steeneken, H. J. M., and Houtgast, T. (1980). “A physical method for measuring speech-transmission quality,” J. Acoust. Soc. Am. 67, 318–326. 10.1121/1.384464 [DOI] [PubMed] [Google Scholar]
- Studebaker, G. A., and Sherbecoe, R. L. (1991). “Frequency-importance and transfer functions for recorded CID W-22 word lists,” J. Speech Hear. Res. 34, 427–438. [DOI] [PubMed] [Google Scholar]
- Turner, C. W., Kwon, B. J., Tanaka, C., Knapp, J., Hubbart, J. L., and Doherty, K. A. (1998). “Frequency-weighting functions for broadband speech as estimated by a correlational method,” J. Acoust. Soc. Am. 104, 1580–1585. [DOI] [PubMed] [Google Scholar]
- Warren, R. M., and Bashford, J. A., Jr. (1999). “Intelligibility of 1/3-octave speech: Greater contribution of frequencies outside than inside the nominal passband,” J. Acoust. Soc. Am. 106, L47–L52. 10.1121/1.427606 [DOI] [PubMed] [Google Scholar]
- Warren, R. M., Bashford, J. A., Jr., and Lenz, P. W. (2004). “Intelligibility of bandpass filtered speech: Steepness of slopes required to eliminate transition band contributions,” J. Acoust. Soc. Am. 115, 1292–1295. 10.1121/1.1646404 [DOI] [PubMed] [Google Scholar]
- Warren, R. M., Bashford, J. A., Jr., and Lenz, P. W. (2005). “Intelligibilities of 1-octave rectangular bands spanning the speech spectrum when heard separately and paired,” J. Acoust. Soc. Am. 118, 3261–3266. 10.1121/1.2047228 [DOI] [PMC free article] [PubMed] [Google Scholar]
- Warren, R. M., Bashford, J. A., Jr., and Lenz, P. W. (2011). “An alternative to the computational speech intelligibility index estimates: Direct measurement of rectangular passband intelligibilities,” J. Exp. Psychol. Hum. Percept. Perform. 37, 296–302. 10.1037/a0020411 [DOI] [PMC free article] [PubMed] [Google Scholar]
- Warren, R. M., Riener, K. R., Bashford, J. A., Jr., and Brubaker, B. S. (1995). “Spectral redundancy: Intelligibility of sentences heard through narrow spectral slits,” Percept. Psychophys. 57, 175–182. 10.3758/BF03206503 [DOI] [PubMed] [Google Scholar]


