Abstract
Heme oxygenase (HO) catalyzes heme degradation, one of whose products is carbon monoxide (CO). It is well known that CO has a higher affinity for heme iron than does molecular oxygen (O2), therefore CO is potentially toxic. Because O2 is required for the HO reaction, HO must discriminate effectively between CO and O2 and thus escape product inhibition. Previously we demonstrated large conformational changes in the heme-HO-1 complex upon CO binding that arise from steric hindrance between CO bound to the heme iron and Gly-139. However, we have not yet identified those changes that are specific to CO binding and do not occur upon O2 binding. Here we determine the crystal structure of the O2-bound form at 1.8 Å resolution and reveal the structural changes that are specific to CO binding. Moreover, difference Fourier maps comparing the structures before and after CO photolysis at temperatures below 160 K clearly show structural changes such as movement of the distal F-helix upon CO photolysis. No such changes are observed upon O2 photolysis, consistent with the structures of the ligand-free, O2-bound and CO-bound forms. Protein motions even at cryogenic temperature imply that CO-bound heme-HO-1 is severely constrained (as in ligand binding to the T-state of hemoglobin), indicating that CO binding to the heme-HO-1 complex is specifically inhibited by steric hindrance. The difference Fourier maps also suggest new routes for CO migration.
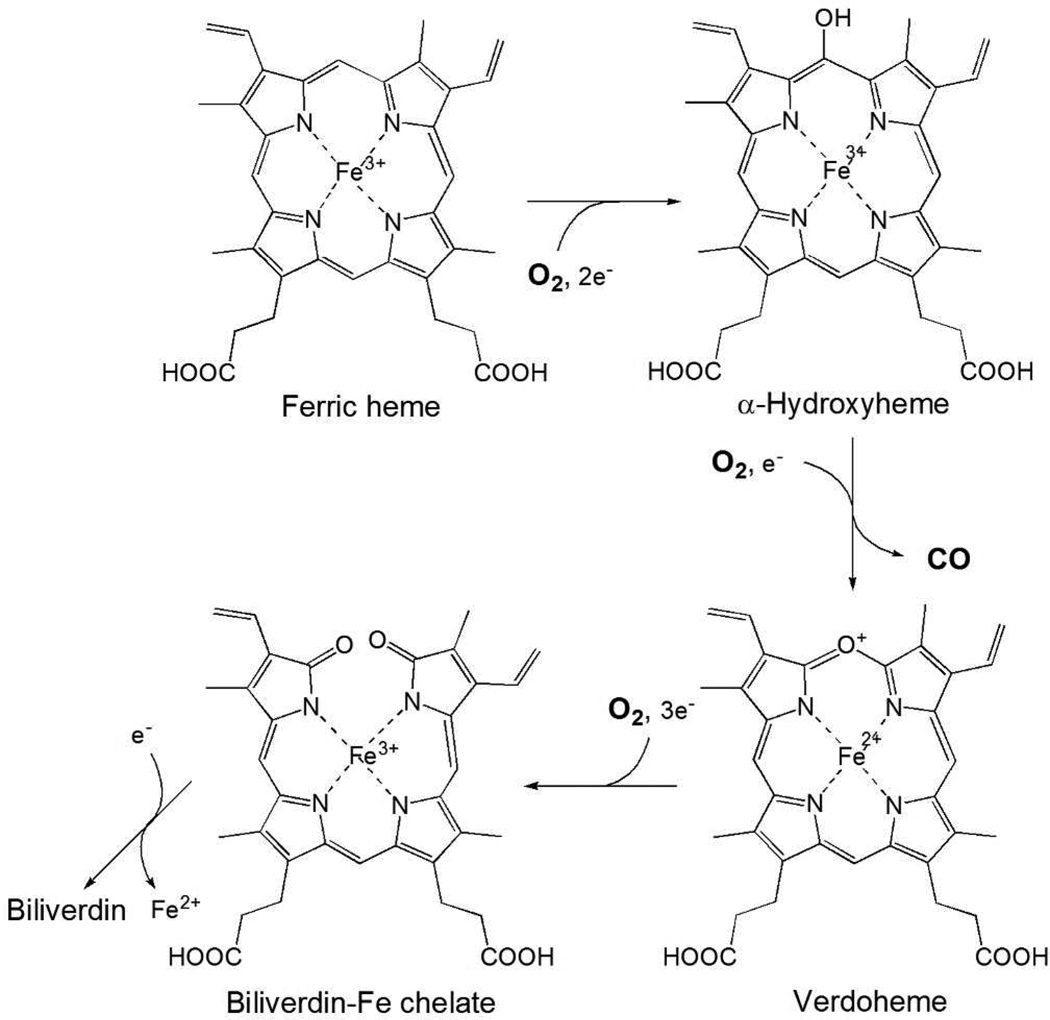
Heme oxygenase (HO) catalyzes the degradation of heme to biliverdin, ferrous iron, and carbon monoxide (CO) using reducing equivalents and molecular oxygen (O2) (1–3). The major physiological roles of HO in mammals are the recycling of iron, defense against oxidative stress, and the generation of CO as a signal transmitter. Although CO is generally toxic, a small amount of CO is proposed to be involved in physiological processes such as anti-inflammation, anti-apoptosis, anti-proliferation, and vasodilation (4). The HO reaction proceeds via a multi-step mechanism and continuous availability of O2 is important for the overall reaction (Figure 1). Three molecules of O2 are required for a complete reaction cycle, which occurs without release of the reaction intermediates derived from heme. Because CO preferentially binds to the ferrous heme iron and competes with binding of O2, CO produced during the HO reaction is potentially a powerful inhibitor. The reaction intermediates shown in Figure 1 do not dissociate from HO during the reaction, which means that CO produced with verdoheme may still be present at the subsequent reaction step. If so, CO could compete with the binding of O2 to ferrous verdoheme, the next step in conversion of verdoheme to biliverdin-iron chelate (5). Indeed, CO-bound verdoheme can be observed spectroscopically under normal, single turnover reaction conditions in vitro (6, 7). To avoid potential product inhibition by CO, HO must possess a much more stringent mechanism to discriminate between CO and O2 than in other heme proteins. Thus, the ratio of the affinities of CO to O2 for rat HO-1 in complex with heme (heme-rHO-1) is between 1.2 and 5.6 (8), in contrast with much larger ratios of 41 and 95 for myoglobin (Mb) (9) and leghemoglobin (10), respectively.
Figure 1.
Reaction scheme of HO. The overall HO reaction proceeds via a multi-step mechanism. The first step is the oxidation of heme to α-hydroxyheme, requiring O2 and reducing equivalents supplied by NADPH cytochrome P450 reductase. O2 bound to the heme iron is activated to the hydrogen peroxy species, and α-hydroxyheme is then produced. The second step is the formation of verdoheme with the concomitant release of the hydroxylated α-meso carbon as CO. The third step is the conversion of verdoheme to biliverdin-iron chelate, also requiring electrons and consuming O2. In the final step, the iron of biliverdin-iron chelate is reduced, and ferrous iron and biliverdin are released from HO. The conversion of verdoheme to ferric biliverdin-iron chelate followed by the release of biliverdin is the rate-limiting step in the HO reaction.
The discrimination mechanism between CO and O2 in globins has been well studied. Two mechanisms have been proposed: increase in the affinity for O2 by the formation of hydrogen bonds or increase of the polarity in the heme pocket, and a steric inhibitory effect on CO binding (9). In both Mb and hemoglobin (Hb), the distal histidine is located close to the ligand binding site. This histidine forms a hydrogen bond with O2 bound to the heme iron, and thereby stabilizes O2 binding. In addition, an early X-ray crystallographic study (11) showed that the Fe-CO bond angle in Mb is strongly bent, presumably by steric hindrance between CO and the distal histidine, which destabilizes CO binding. However, more recent ultra-high-resolution X-ray crystallographic (12), spectroscopic (13), and systematic biochemical (9) studies are inconsistent with the hypothesis of steric hindrance in globins. On the other hand, steric hindrance has been recently proposed to discriminate between O2 and CO binding in bacterial cytochrome c’, based on crystal structures and an electrochemical study (14), and in the heme binding domain of FixL, based on ultrafast infrared spectroscopy following CO photolysis (15). Thus, the mechanism of discrimination may differ among heme proteins.
We previously determined crystal structures of heme-rHO-1 complexed with several ligands and demonstrated that upon CO or cyanide binding, the heme and the proximal A-helix slide along the α-γ axis of heme, and the distal F-helix slides in the opposite direction (16). These conformational changes do not occur upon nitric oxide (NO) or azide binding. We proposed that this conformational change is specific for ligands which prefer a linear binding geometry such as CO and cyanide because the distal atom of these ligands would collide with the carbonyl group of Gly-139 if the ligands adopt a linear binding geometry. No such collision would occur for ligands which prefer a bent binding geometry such as NO and azide. Because O2 also prefers a bent binding geometry, we expect that the conformational changes would not occur upon O2 binding. The conformational change upon CO binding is not restricted to mammalian HO-1. A similar change has been reported in one bacterial HO homolog (17) but was absent in another (18). Steric hindrance thus seems to be one of the mechanisms for discrimination between CO and O2 in HO. However, neither the O2-bound heme-rHO-1 structure nor the extent of structural constraints in the CO-bound and O2-bound forms have been examined.
In order to probe further details of the discrimination mechanism in HO, we have determined the O2-bound heme-rHO-1 structure, which reveals that the conformational changes are specific to CO binding. We also demonstrate that the conformational changes in heme-rHO-1 upon CO photolysis at cryogenic temperature ~100 K are the reverse of those upon CO binding. We previously determined the CO-photolyzed structure at ~35 K, but could not detect any conformational changes upon photolysis (with the limited exception of some water movement and CO trapping at two specific sites) because all protein motions are severely restricted at ~35 K (19). We therefore repeated our CO photolysis experiments at ~100 K, a temperature where we anticipated that more extensive conformational changes could occur. Our new structural data clearly show the reverse conformational changes at the kinked part of the distal F-helix. This implies that CO binding in heme-rHO-1 is severely constrained compared to that in Mb (20–23) and in the fully-liganded, relaxed state (R-state) of Hb (24), it may be similarly constrained to the fully-unliganded, tense state (T-state) of Hb (24). We also observe a putative CO-trapping site that suggests a new pathway for CO migration in heme-rHO-1. However, we do not observe the reverse conformational changes in the proximal A-helix, though the heme iron does move. A recent time-resolved resonance Raman study that follows CO photolysis in heme-rHO-1 (25) has shown behavior in the ν(Fe-His) stretching mode specific to HO. We discuss the relationship between spectroscopic and crystallographic results.
Experimental Procedures
Structure determination of O2-bound heme-rHO-1 complex
Ferrous heme-rHO-1 crystals were obtained as described previously (16). Ferrous heme-rHO-1 crystals were converted to O2-bound form as follows. Crystals were washed by anaerobic crystallization solution twice and then soaked in aerobic crystallization buffer for 15 minutes. After conversion to the O2-bound form, crystals were immediately frozen by liquid nitrogen. Monochromatic oscillation diffraction data from the O2-bound form were collected using synchrotron radiation at BioCARS beamline 14-BM-C of the Advanced Photon Source (APS; Argonne, IL, USA). Absorption spectra of frozen crystals after X-ray data collection were obtained using a 4DX microspectrophotometer (4DX-ray Systems AB, Uppsala, Sweden) also at BioCARS, under nitrogen gas flow at 100 K. Diffraction data were processed, merged, and scaled with HKL2000 (26) at 1.8 Å resolution. Phases of the O2-bound form were determined using the protein and heme moiety of NO-bound form (PDB code 1J02). The initial model was refined with REFMAC5 (27) and adjusted with Coot (28). The resultant Fo-Fc electron density map clearly showed O2 bound to the heme iron. After several cycles of refinement to identify water molecules and TLS refinement, O2 was added to the model. Subsequently the complete model was refined with appropriate, moderate restraints on the bond lengths between Fe and O2 and between Fe and the proximal histidine, and on the Fe-O-O bending angle. Stereochemical checks on the models were performed with MolProbity (29). Diffraction and refinement statistics for the O2-bound form are summarized in supplementary table 1. Coordinates for the O2-bound form have been deposited in the PDB under accession code 4G7L.
CO and O2 photolysis
CO-bound crystals were prepared and frozen as described earlier (16). After collection of the dark dataset, CO bound to the heme iron was photolyzed by illumination with an Ar+ CW laser (λ = 512 nm for 1 hr, or 532 nm for 16 hr). Laser power densities were 314 mW/mm2 for 1 hr illumination and 768 mW/mm2 for 16 hr illumination, respectively. Dark and light datasets were collected from the same volume of one crystal to minimize systematic errors arising from inter-crystal differences. For the light datasets, crystals were illuminated continuously before and during data collection. Diffraction data were collected using synchrotron radiation at beamline 14-ID-B of APS, processed, merged, and scaled as described above. Phases of the CO-bound form (dark dataset) were determined using the CO-bound form (PDB code 1IX4) from which CO was excluded. The initial model was refined with REFMAC5 (27) and slightly modified with Coot (28). CO binding to the heme iron was confirmed in the resultant Fo-Fc electron density map. After the addition of CO to the model and subsequent TLS refinement with the proper moderate restraints on the bond lengths between Fe and CO and between Fe and the proximal histidine, and on the bending angle of Fe-C-O, weighted difference Fourier maps between dark and light were calculated (30). The weight for the difference Fourier map W is calculated according to the following equation: W = 1/[1 + σ|ΔF|2/<σ|ΔF|>2 + |ΔF|2/<|ΔF|>2], where the variance σ|ΔF|2 is the sum of the squares of the estimated standard deviations σ|F(dark)|2 and σ|F(light)|2, and <σ|ΔF|> and <|ΔF|> are mean values of the estimated standard deviations of each reflections and the difference of amplitudes, respectively (30). A closely similar approach was also applied to photolysis of an O2-bound crystal. The wavelength and power density of the laser were 532 nm and 611 mW/mm2, respectively. The crystal was continuously illuminated for 13 hours to obtain the light data set. After the illumination, weak ice rings were observed. Diffraction spots that overlapped with ice rings were removed prior to synthesis of the weighted difference Fourier map. Diffraction and refinement statistics for CO and O2 photolysis are summarized in supplementary tables 2 and 3, respectively.
Conformation change depending on temperature change
During photolysis induced by laser irradiation, the temperature in crystal appeared to be increased by 40 to 60 K over the temperature of the cryogenic gas stream (100 K). This means that the difference Fourier maps between dark and light states reveal differences caused by both photolysis and the temperature increase. To see the effects caused by the temperature increase, diffraction data without photolysis but after a temperature increase were collected to provide a control for the photolysis experiments. Diffraction data on crystals of the CO-bound form were collected at 100 K at beamline 14-BM-C of APS, as described above. After collection of the first dataset at 100 K, the crystal was warmed to 160 K for 20 min, cooled to 100 K, and a second dataset collected on the same crystal at 100 K. In order to minimize the effects of X-ray radiation damage, the total exposure time was limited to 100 s for each dataset. We estimate with RADDOSE (31) that the X-ray dose in each dataset is 0.6 MGy, although it is between 3.4 and 6.8 MGy for the CO photolysis experiments. Diffraction data were processed and scaled with HKL2000 (26). Diffraction and refinement statistics for temperature change are summarized in supplementary table 4. Weighted difference Fourier maps between dark and after warm-up were calculated using the phase of CO-bound form.
Results
O2-bound structure
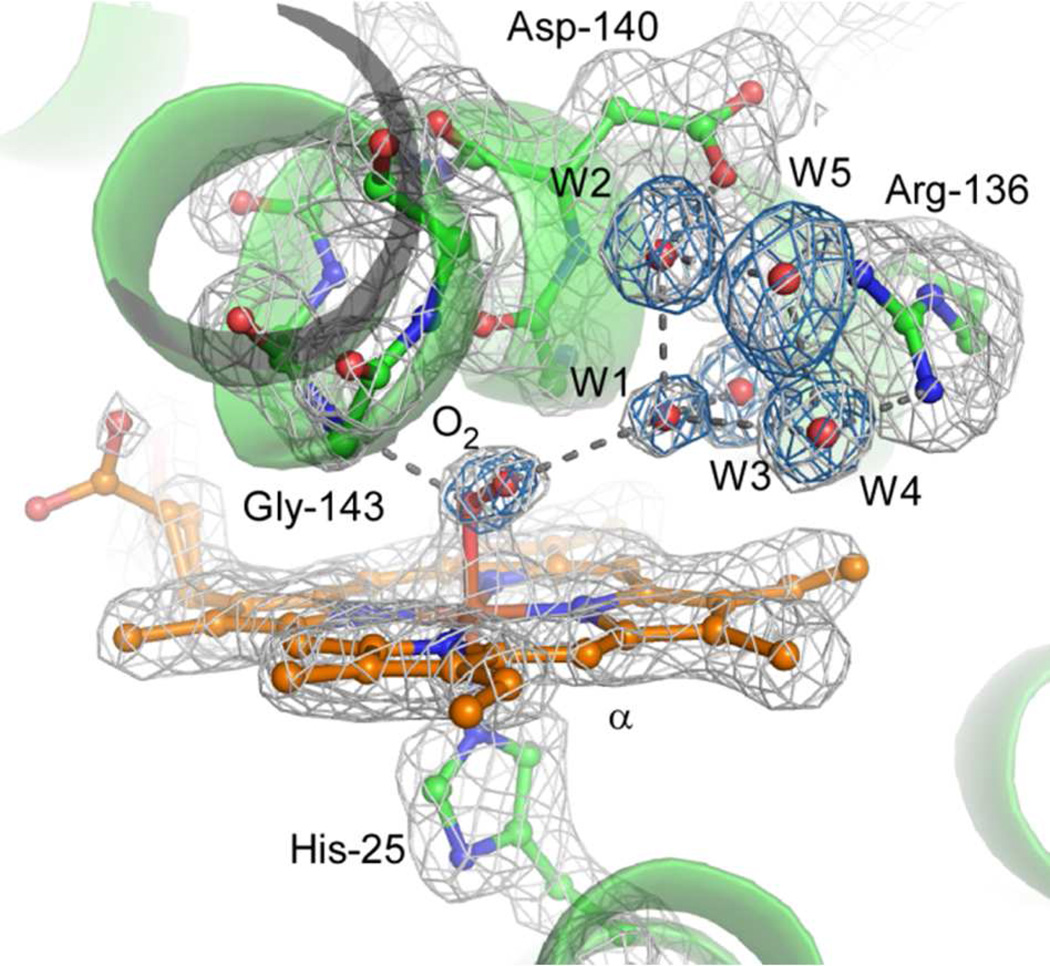
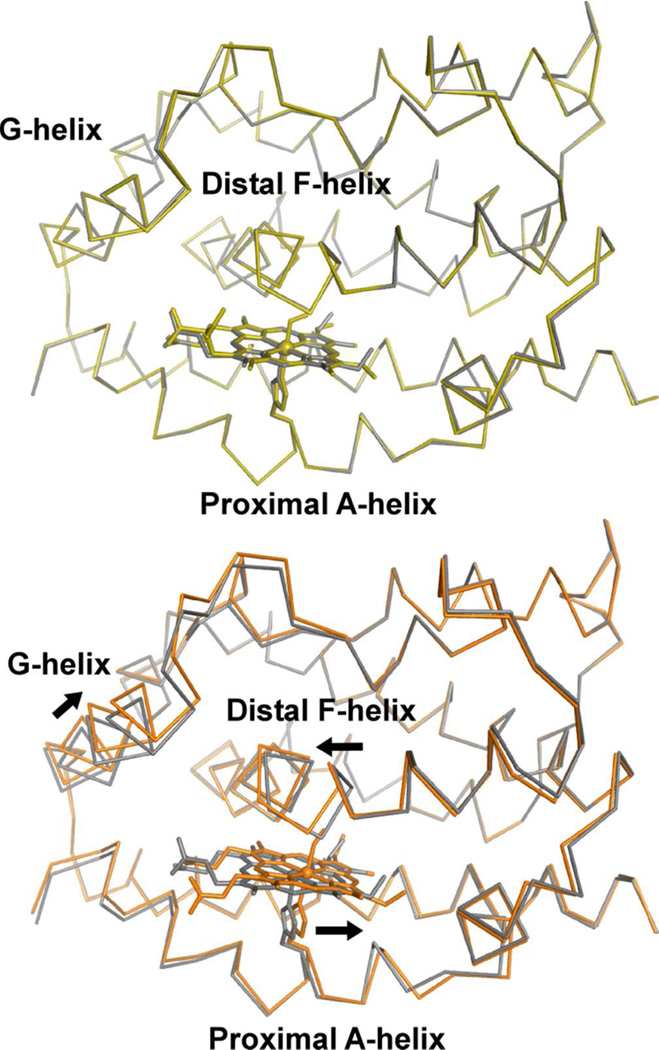
The O2-bound heme-rHO-1 structure was determined at 1.8 Å resolution. We examined the absorption spectrum of the crystal after X-ray data collection (Supplementary Figure S1) to explore the possibility that the overall enzymatic reaction proceeds further by X-ray photoreduction or by the effects of sodium hydrosulfite remaining from conversion of ferric heme-rHO-1 to ferrous heme-rHO-1. The spectrum is clearly characteristic of the O2-bound form and shows no evidence for conversion to the peroxy-bound form. However, a shoulder around 630 nm indicates contamination by a small amount of ferric hemerHO-1 produced by auto-oxidation. This is consistent with the crystal structure in which the refined occupancy of O2 is 0.8 and the temperature factor of the distal oxygen (B = 24.1) is larger than that of the proximal (B = 15.2). The active site structure of the O2-bound form is shown in Figure 2. The binding geometry is very similar to those of the NO-bound heme-rHO-1 (16) and the O2-bound form of bacterial heme-HO (32). O2 is directed toward the α-meso carbon of heme; the distance between the distal oxygen atom and α-meso carbon is 3.4 Å, poised for the next step in the enzymatic reaction which occurs at this α-meso carbon. The bending angle of Fe-O-O is 118°, consistent with the prediction of the bending angle (~110°) inferred from resonance Raman spectroscopy (33). O2 binding is stabilized by hydrogen bonds with the amide group of Gly-143 and a water molecule (W1) in the distal hydrogen bond network, composed of W1-W5, Arg-136, and Asp-140 (Figure 2). These two hydrogen bonds preferentially stabilize O2 binding rather than CO binding because the proximal carbon atom of CO cannot form a hydrogen bond with the amide group of Gly-143. Differences in hydrogen bonding between O2 and CO are a key mechanism for discrimination between these ligands (16). A structural comparison of the O2-bound, CO-bound (PDB code 1IX4) and unbound (ferrous heme-rHO-1, PDB code 1UBB) structures is shown in Figure 3. Upon CO binding (but not upon O2 binding), the heme and proximal A-helix slide parallel to the α-γ axis of the heme, and the distal F-helix slides in the opposite direction. This result agrees with our earlier conclusion in which we examined the NO-bound form, an analog of the O2-bound form (16).
Figure 2.
O2-bound structure. The omit map for O2 and water molecules consisting of the distal hydrogen bond network (cyan, contoured at 4.5 σ) and 2Fo-Fc map (gray, contoured at 1.5 σ) are superimposed on the refined model of the O2-bound form. Hydrogen bonds with O2 and the distal hydrogen bond network are shown with dashed lines. Figures 2–8 were prepared with PyMOL (41).
Figure 3.
Comparisons between CO-bound, O2-bound, and unbound forms. The upper panel shows superimposition of the O2-bound form (yellow) on the unbound, ferrous form (gray). The lower panel shows superimposition of the CO-bound form (orange) on the ferrous form. Heme and ligands are shown as stick models. Arrows indicate the direction of motion at the heme and helices upon CO binding.
Protein and water motions following CO and O2 photolysis
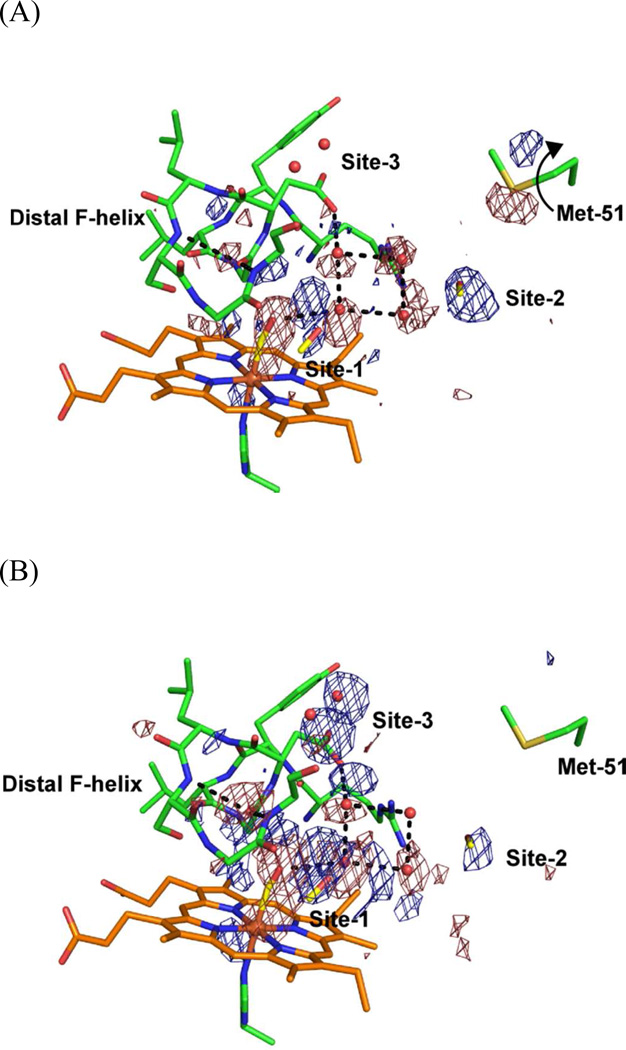
Weighted difference Fourier maps between dark and light states with illumination for 1 hr or illumination for 16 hr are shown in Figure 4(A) and (B), respectively. In both maps, the difference density features are concentrated around the heme pocket. There is a strong negative density on the location of CO bound to the heme iron, confirming CO photodissociation from the heme iron. The photolyzed fractions of CO were estimated from electron densities to be 25 % for 1 hr illumination and 30 % for 16 hr. Under these illumination conditions, laser-induced heating increases the temperature of the crystal by 40 to 60 K over that of the cryogenic gas stream. Hexagonal ice rings appeared in the diffraction pattern when the gas stream was set to 120 K or higher. The exact temperature of the crystal under illumination is uncertain, but must be near the phase transition temperature from amorphous ice to hexagonal ice of 160K, and is somewhat higher under the conditions of 16 hr illumination since the laser power density is 2.4-fold higher than under the conditions of 1 hr illumination. The extent of conformational changes upon CO photolysis was greater under 16 hr illumination, as expected at higher temperature.
Figure 4.
Weighted difference Fourier maps between dark and light. Difference maps ((A) Light (illumination for 1 hr) minus Dark, (B) Light (illumination for 16 hr) minus Dark, are superimposed on the atomic model for the partially CO-photolyzed form (PDB code 1ULX) (19). Blue and red features show positive and negative difference densities contoured at ±4.0 σ, respectively. Arrow in (A) shows the flipping of the side-chain of Met-51 following CO photolysis.
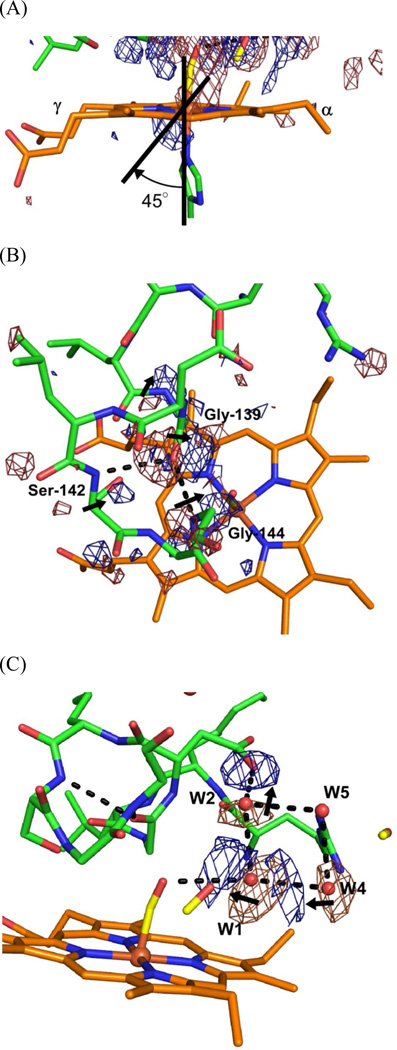
A pair of negative and positive density features close to the heme iron indicates motion of the heme iron out of the porphyrin plane, associated with conversion from low spin, hexa-coordinate form to high spin, penta-coordinate form (Figure 5(A)). The axis between these negative and positive densities is skewed toward the γ-meso side by ~45° from the coordination linkage of His-Fe-CO, which suggests that net motion of the heme iron arises both from motion of the iron with respect to the porphyrin plane and bulk motion of the heme toward the γ-meso side. However, motion of the heme toward the γ-meso side is limited compared with the static comparison shown in Figure 3; no significant negative and positive difference densities lie on the porphyrin plane (other than on the iron atom). Moreover, pairs of negative and positive density appeared on the kinked part of the distal F-helix (Gly-139 – Gln-145) (Figure 5(B)). Significant density pairs are observed near the backbone carbonyl of Gly-139 and the amide of Gly-144. Because the carbonyl group of Gly-139 directly contacts CO bound to the heme iron, Gly-139 moves toward the CO binding site upon CO photolysis. This movement is evidently transmitted to the amide group of Gly-144, with which Gly-139 forms a hydrogen bond. The whole kinked part of the distal F-helix then moves toward the CO binding site. These motions of the distal F-helix and heme are the reverse of the motions observed upon CO binding (Figure 3).
Figure 5.
Motions of the distal F-helix, heme, and the distal hydrogen bond network coupled with CO photolysis. Close-up views of the heme iron (A), the distal F-helix (B), and the distal hydrogen bond network (C) of Figure 3(B) are shown. The contour level for the difference Fourier map is ±3.5 σ for (B) and ±4.0 σ for (A) and (C). Densities outside of the region of interests (around the distal F-helix (B) or around the distal hydrogen bond network (C)) have been removed for clarity in panels (B) and (C). Arrows show motions that follow CO photolysis. Dashed lines show hydrogen bonds. (A) Strong positive and negative density features flank the heme iron. The axis between the pair of features is skewed ~45° from the coordination axis. (B) Strong positive and negative density features flank the carbonyl group of Gly-139 and the amide group of Gly-144, and weak features are near the amide group of Gly-139 and the Cα of Ser-142. (C) Strong positive and negative density features appear near water molecules W1, W2, and W4.
Motions in the distal hydrogen bond network are also observed (Figure 5(C)). Because W1 directly contacts bound CO, W1 moves toward the CO binding site following CO photolysis and transmits its motion to W2 and W4, which form hydrogen bonds with W1. The direction of W4 movement is the same as that of W1, but that of W2 is opposite. Thus motion of W1 does not influence the side chain carboxyl of Asp-140 which forms a hydrogen bond with W2. Motion of the proximal A-helix and G-helix following CO photolysis were expected from structural comparison of CO-bound and unbound forms (Figure 3), but are not observed under the present experimental conditions. Restraints imposed by crystal packing seem to be only slight for the proximal A-helix, and absent for the G-helix.
In marked contrast to these structural changes upon CO photolysis, no significant changes were observed following O2 photolysis (Figure 6).
Figure 6.
Weighted difference Fourier map between dark and after illumination of O2-bound crystal. Weighted difference Fourier map which is contoured by ±3.8 σ is superimposed on the model of O2-bound form. After illumination almost 40% of O2 was photolyzed. After laser illumination, weak ice rings were observed in the diffraction images which means that the actual temperature in crystal during illumination is about 160 K.
CO and O2 migration
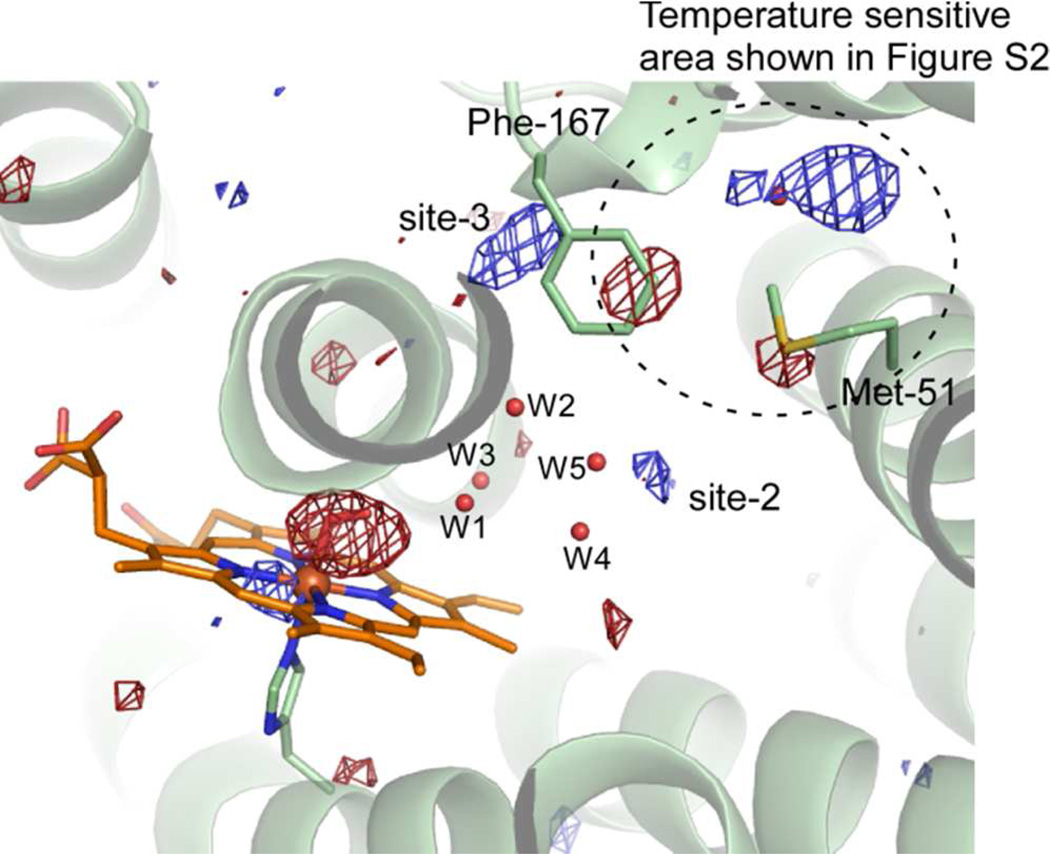
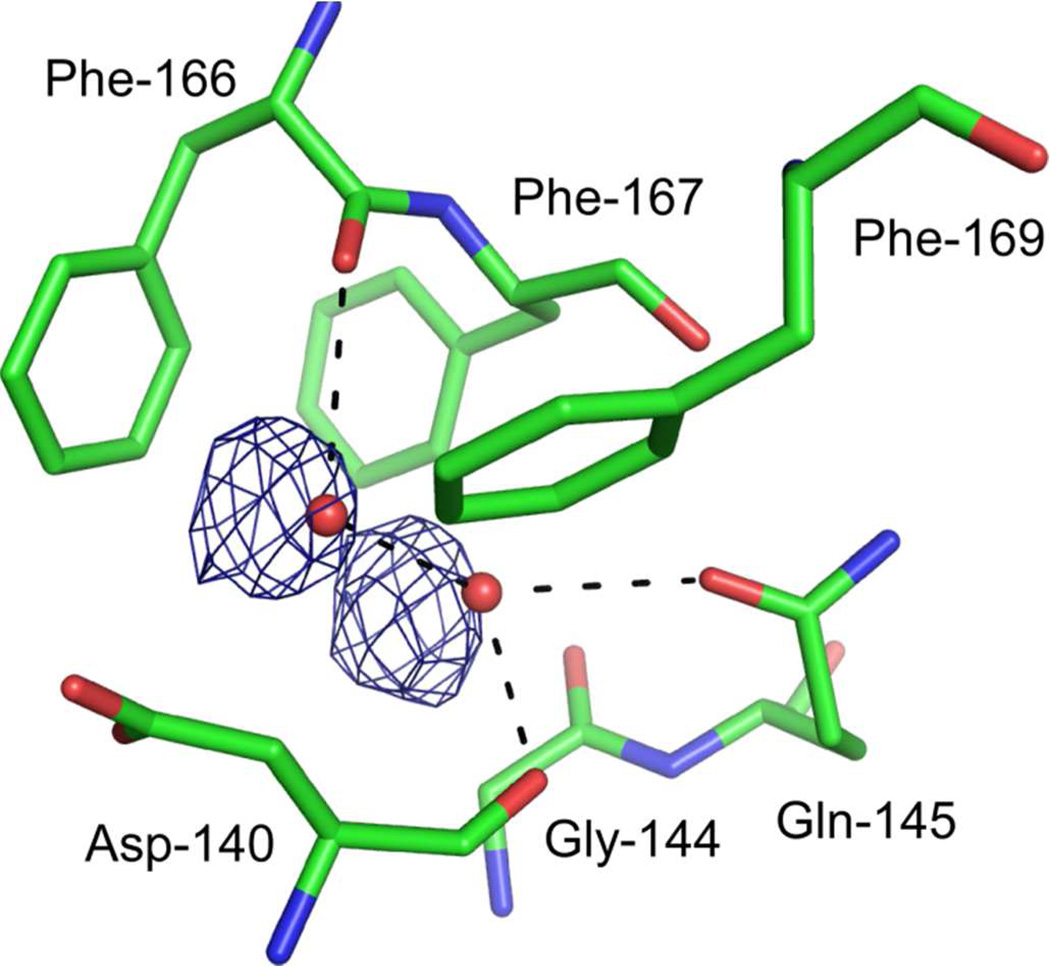
Isolated, positive difference densities were found in the weighted difference Fourier maps between the dark and light states (Figure 4), which we interpret as trapping sites of photolysed CO. We previously found two sites associated with photolysed CO at ~35 K; one close to CO bound to the heme iron (denoted site-1) and the other 10 Å distant from the heme iron (site-2) (19). Trapping at site-1 is also found in Mb (20–23, 34) and Hb (24) at cryogenic temperatures, but trapping at site-2 is found only in HO and may facilitate the HO reaction (35). Rotation of the side chain of Met-51, close to site-2, is observed in the difference Fourier map between dark and light with illumination for 1 hr, but not for 16 hr (Figure 4). The conformational change of Met-51 may be accompanied with CO trapping at site-2 because the positive feature at site-2 in Figure 4(B) is weaker than that in Figure 4(A). In addition to these two sites, the difference Fourier map between dark and light with illumination for 16 hr shows two positive densities close to water molecules which form hydrogen bonds with Asp-140, Gln-145, and Phe-166 (Figures 4(B) and 7). These positive densities may indicate a new CO-trapping site (site-3), about 10 Å from the heme iron. Xenon binding experiments normally show that xenon binds to CO-trapping sites; such experiments on heme-rHO-1 showed that xenon can bind to site-2, but not to other sites including site-3 (19). Because the positive densities may appear due to laser-induced warming, we collected diffraction datasets (at 100 K) of CO-bound hemer-HO-1 before and after warming, without illumination. Warming to temperatures above 160 K induces the large conformational changes in the side chains of Met-51 and Phe-167, and rearrangements of water molecules close to Asp-92, but no positive density at site-3 (Supplementary Figure S2). Warming to temperatures below 140 K generates no significant features in the difference Fourier maps. We conclude that the positive densities at site-3 arise from CO photolysis and not from temperature changes. At least a fraction of photolysed CO migrates from the heme pocket towards the solvent via site-3.
Figure 7.
CO migration at site-3. Weighted difference Fourier map between the dark and light states with illumination for 16 hr, contoured at ±4.0 σ, superimposed on the model of the CO-bound form. Residues located within 4.0 Å from two water molecules are shown as sticks. Hydrogen bonds with two water molecules are shown as dashed lines.
Similar positive densities at site-2 and site-3 were observed following O2 photolysis (Figure 6), which suggests that photolysed O2 migrates by a pathway similar to that of CO.
Discussion
Discrimination mechanism between CO and O2 in HO
There is the possibility that CO produced by HO itself would inhibit the overall HO reaction, because CO should bind to the heme iron or the verdoheme iron that are reaction intermediates of the overall HO reaction (Figure 1). In fact, the overall HO reaction in vitro completely arrests at the verdoheme stage when conducted under an atmosphere of 20% CO and 80% O2 (6). Thus HO must discriminate between CO and O2 binding to a much greater extent than other heme proteins (8), which under normal physiological conditions are exposed to much lower levels of CO. We propose that two mechanisms discriminate between CO and O2 binding in HO: stabilization of O2 binding by formation of hydrogen bonds, and destabilization of CO binding by steric hindrance with the carbonyl group of Gly-139. The present structure of O2-bound heme-rHO-1 shows two hydrogen bonds that evidently stabilize O2 binding to the heme iron. Large conformational changes occur upon CO binding but not upon O2 binding, as expected from the NO-bound structure (16). The present study confirmed this expectation.
The CO-bound form of heme-rHO-1 seems to be severely constrained: the distal F-helix and heme show substantial conformational changes following CO photolysis, even at cryogenic temperatures which normally greatly restrain protein motion. For example, crystallographic study of photolysis of CO-Mb showed no protein motion either at 20–40 K (20–22) or at around 160 K (23) (a similar experiment to the present study), which implies that CO binding in Mb is only slightly constrained. This observation is consistent with the proposal that the steric hindrance does not significantly contribute to discrimination between CO and O2 in Mb (9). Photolysis of CO-Hb crystals at 25–35 K demonstrates that large protein motion in the main chain is observed only in the T-state and not in the R-state (24), which suggests that CO binding to the T-state (but not to the R-state) is severely constrained. The affinity of ligands for T-state Hb is substantially lower than that for the R-state, an effect lying at the heart of cooperativity. Taken together, the protein conformational changes at the distal F-helix of HO following CO photolysis, even at cryogenic temperatures, suggest that CO-bound heme-rHO-1 is severely constrained by steric hindrance between CO and Gly-139, a situation rather similar to that in T-state Hb. In contrast, large protein conformational changes do not occur upon O2 binding, and no changes are observed upon O2 photolysis. Thus, O2-bound heme-rHO-1 is not constrained. We conclude that steric hindrance between CO and Gly-139 is one of the key mechanisms for discrimination between binding of CO and O2 to rHO-1.
CO is released just before the step in which verdoheme is converted to biliverdin-iron chelate, a step in which O2 is required (Figure 1). Thus, smooth exit of (at least a large fraction of) CO from the heme pocket is also important if inhibition of the conversion step is to be avoided. CO-bound verdoheme can be observed spectroscopically under normal, single turnover reaction conditions in vitro (6, 7). A fraction of the CO produced in conversion from α-hydroxyheme to verdoheme apparently remains in the protein matrix at the subsequent reaction step, where it (at least partially) inhibits conversion of verdoheme to biliverdin-iron chelate. We previously proposed that site-2 may be a temporary trapping site of CO, to minimize inhibition of the step from verdoheme to biliverdin-iron chelate (19). The affinity of site-2 for CO is expected to be low but the affinity of verdoheme for CO is also low (KCO = 0.0018 μM−1) (8). The local structures at site-2 and the distal verdoheme iron site in verdoheme-rHO-1 complex do not significantly differ from those in heme-rHO-1 (36), which suggests that site-2 may also serve as a temporary CO binding site at the verdoheme stage. Our present results show that a fraction of photolysed CO has migrated further to site-3. This site may also function as a trapping site, or lie on a transport pathway from the heme pocket to the protein exterior. The side-chains of Phe-166, Phe-167, and Phe-169 are located within 4 Å of site-3 (Figure 7). The side-chain conformation of Phe-167 is sensitive to temperature (Supplementary Figure S2). If this region is also flexible at room temperature, fluctuations at Phe-167 may facilitate ejection of CO from site-3.
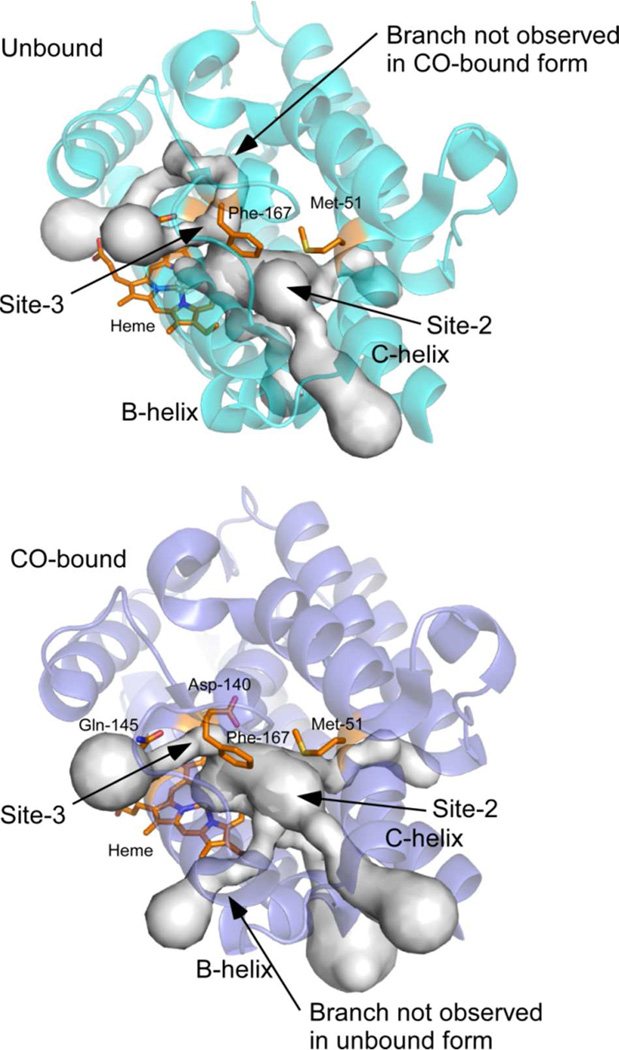
Possible tunnels from the heme pocket to the protein exterior, identified by the program CAVER (37), are shown in Figure 8. The most likely tunnel traverses site-2 and lies between the B- and C-helices. Because the radius of this tunnel at its bottleneck is smaller than the van der Waals radius of an oxygen atom, fluctuations in this region are necessary for the passage of CO. Two results suggest that fluctuations of significant extent can occur. Temperature factors of atoms in the B-helix are relatively high; and two alternative conformations are found for the peptide bond between Gln-41 and Val-42 between the B- and C- helices. The major conformation differs between the O2- and CO-bound forms (Supplementary Figure S3). Our present results suggest that at least a fraction of CO migrates through site-3. Taken together, these results suggest there are at least two pathways for CO migration to outside; one via site-2, and the other via site-3. Finally, continuous availability of O2 is important for the overall HO reaction; three molecules of O2 are required for a complete reaction cycle. Our results on O2 photolysis and identification of possible tunnels suggest that O2 is also smoothly incorporated into the distal site of the heme iron via site-2 and/or site-3, aided by some protein fluctuations.
Figure 8.
Tunnels from heme pocket to the outside of protein. Possible tunnels from heme pocket to the outside of protein are estimated with the program CAVER (37). Upper and lower panels show unbound (PDB ID: 1UBB) and CO-bound forms (PDB ID: 1IX4), respectively (16). Heme, Met-51, Asp-140, Gln-145, and Phe-167 are shown as orange stick model. Top 5 tunnels in unbound and CO-bound forms are shown. Some tunnel formations are depending on the conformation change upon CO binding. In unbound form, one tunnel through the site-3 and γ- meso side of heme is formed, on the other hands, another tunnel from the site-2 and the α-meso side of heme is formed in CO-bound form.
Implications of the relationship between time-resolved resonance Raman spectroscopic and crystallographic results
A recent time-resolved resonance Raman study of heme-rHO-1 (25) has shown that the ν(Fe-His) stretching mode is upshifted by 1.5 wave numbers following CO photolysis in the 100 ns time range. In contrast, this mode is downshifted by 2 wave numbers in the 100 ps time range in Mb (38). The ν(Fe-His) mode in Mb is strongly coupled to motion of the heme iron out of the porphyrin plane and the subsequent motion of the proximal helix, motions revealed by time-resolved Laue crystallography (39) and cryo-crystallography with pulsed laser illumination (40). A downshift of the ν(Fe-His) mode in Mb reflects elongation of the Fe-His bond by motion of the proximal histidine subsequent to motion of the heme iron. An upshift of the ν(Fe-His) mode in heme-rHO-1 suggests strengthening of the Fe-His bond upon CO photolysis. Our present crystallographic data show motion of the heme iron out of the porphyrin plane accompanied by small sliding of the heme, but no motion of the proximal A-helix. In the static comparison of CO-heme-rHO-1 and ferrous heme-rHO-1 (Figure 3), the heme and proximal A-helix seem to move upon CO binding. The superposition in Figure 3, however, minimizes the rms difference between the Cα atoms. If instead the superposition minimizes the rms difference between heme atoms, the positions of the proximal A-helix and heme are very closely similar, but the distal F-helix moves further than shown in Figure 3 (Supplementary Figure S4). Therefore, structural comparison of CO-heme-rHO-1 and ferrous heme-rHO-1 does not demonstrate that the proximal A-helix and heme move upon CO-binding. The present CO photolysis results at cryogenic temperature support the alternative model: no motion of the heme and the proximal A-helix, and large motion of the distal F-helix. This is consistent with the recent time-resolved resonance Raman result (25). The CO photolysis results demonstrate that motion of the heme iron is skewed by ~45o along the Fe-His bond (Figure 4A), which suggests that temporary distortion of the coordination geometry of the heme iron and subsequent relaxation towards normal stereochemistry occur upon CO photolysis. Relaxation towards normal stereochemistry is consistent with upshift of the ν(Fe-His) mode: it strengthens the Fe-His bond relative to that in the distorted geometry. However, the time-resolved resonance Raman result is also consistent with the former model in which the heme, the proximal A-helix and the distal F-helix all move upon CO binding. A structural sequence in which the heme slide precedes the proximal A-helix slide also suggests temporary distortion of the coordination geometry and subsequent relaxation. Although we did not observe significant motion of the heme and the proximal A-helix following CO photolysis, these motions may be restrained at cryogenic temperature. Time-resolved Laue crystallography following CO photolysis is required to follow the temporal order of the structural changes and thus distinguish these two models.
Conclusions
The O2-bound heme-rHO-1 structure reveals that the conformational changes in the heme pocket are small upon O2 binding but large upon CO binding. Motion of the distal F-helix following CO photolysis at temperatures below 160 K implies that CO-bound heme-rHO-1 is severely constrained. Steric hindrance between Gly-139 and CO is one of the key factors contributing to stringent discrimination between O2 and CO. CO produced at the verdoheme stage of the overall HO reaction may be temporarily trapped at site-2, from which it can smoothly migrate toward the protein exterior through site-2 and site-3, important for the progress of later reaction steps.
Supplementary Material
Acknowledgement
Funding Sources
This work was supported in part by MEXT/JSPS KAKENHI Grants [20770092 (to MS) and 21590321 (to MN)], and NIH Grant [GM036452 (to KM)].
We thank the beamline staff of BioCARS, Advanced Photon Source, especially Drs. Vukica Šrajer, Zhong Ren and Robert Henning, for their help in X-ray data collection, laser illumination, measurement of the absorption spectra of crystals using microspectroscopy, cryo-temperature control, and computational analysis (GUP 23207). We also thank Prof. Keiichi Fukuyama, Prof. Yasuhisa Mizutani, and Dr. Masaki Nojiri of Osaka University for discussion about X-ray crystallography and time-resolved resonance Raman studies.
ABBREVIATIONS
- Hb
hemoglobin
- heme-rHO-1
rHO-1 in complex with heme
- HO
heme oxygenase
- Mb
myoglobin
- rHO-1
a soluble form of rat HO-1 in which C-terminal 22 amino acids are truncated
- R-state
fully liganded relaxed state
- T-state
fully unliganded tense state
Footnotes
Accession numbers. The atomic coordinates and structure factors have been deposited in the Protein Data Bank, www.pdb.org (PDB ID codes 4G7L, 4G7P, 4G7T, 4G7U, 4G8P, 4G8U, 4G8W, 4G98, 4G99).
Supporting Information Available
Supporting information presents data collection and refinement statistics for all X-ray diffraction data and models (Tables S1-S4), visible light absorption spectrum of O2 bound heme-rHO-1 crystal (Figure S1), and figures that display the conformation changes depending on cryo temperature (Figure S2), the fluctuations in B-helix and the loop between B- and C-helices (Figure S3), and superposition of the CO-heme-rHO-1 and ferrous heme-rHO-1 structures that minimizes rms differences of heme (Figure S4). This material is available free of charge via the Internet at http://pubs.acs.org/.
References
- 1.Tenhunen R, Marver HS, Schmid R. The enzymatic conversion of heme to bilirubin by microsomal heme oxygenase. Proc. Natl. Acad. Sci. U S A. 1968;61:748–755. doi: 10.1073/pnas.61.2.748. [DOI] [PMC free article] [PubMed] [Google Scholar]
- 2.Ortiz de Montellano PR. The mechanism of heme oxygenase. Curr. Opin. Chem. Biol. 2000;4:221–227. doi: 10.1016/s1367-5931(99)00079-4. [DOI] [PubMed] [Google Scholar]
- 3.Kikuchi G, Yoshida T, Noguchi M. Heme oxygenase and heme degradation. Biochem. Biophys. Res. Commun. 2005;338:558–567. doi: 10.1016/j.bbrc.2005.08.020. [DOI] [PubMed] [Google Scholar]
- 4.Ryter SW, Alam J, Choi AM. Heme oxygenase-1/carbon monoxide: from basic science to therapeutic applications. Physiol. Rev. 2006;86:583–650. doi: 10.1152/physrev.00011.2005. [DOI] [PubMed] [Google Scholar]
- 5.Matsui T, Nakajima A, Fujii H, Matera KM, Migita CT, Yoshida T, Ikeda- Saito M. O2- and H2O2-dependent verdoheme degradation by heme oxygenase: reaction mechanisms and potential physiological roles of the dual pathway degradation. J Biol Chem. 2005;280:36833–36840. doi: 10.1074/jbc.M503529200. [DOI] [PubMed] [Google Scholar]
- 6.Yoshida T, Noguchi M, Kikuchi G. A new intermediate of heme degradation catalyzed by the heme oxygenase system. J. Biochem. (Tokyo) 1980;88:557–563. doi: 10.1093/oxfordjournals.jbchem.a133003. [DOI] [PubMed] [Google Scholar]
- 7.Sakamoto H, Omata Y, Adachi Y, Palmer G, Noguchi M. Separation and identification of the regioisomers of verdoheme by reversed-phase ion-pair high-performance liquid chromatography, and characterization of their complexes with heme oxygenase. J. Inorg. Biochem. 2000;82:113–121. doi: 10.1016/s0162-0134(00)00149-5. [DOI] [PubMed] [Google Scholar]
- 8.Migita CT, Mansfield Matera K, Ikeda-Saito M, Olson JS, Fujii H, Yoshimura T, Zhou H, Yoshida T. The oxygen and carbon monoxide reactions of heme oxygenase. J. Biol. Chem. 1998;273:945–949. doi: 10.1074/jbc.273.2.945. [DOI] [PubMed] [Google Scholar]
- 9.Springer BA, Sligar SG, Olson JS, Phillips GN., Jr Mechanisms of ligand recognition in myoglobin. Chem. Rev. 1994;94:699–714. [Google Scholar]
- 10.Hargrove MS, Barry JK, Brucker EA, Berry MB, Phillips GN, Jr, Olson JS, Arredondo-Peter R, Dean JM, Klucas RV, Sarath G. Characterization of recombinant soybean leghemoglobin a and apolar distal histidine mutants. J Mol Biol. 1997;266:1032–1042. doi: 10.1006/jmbi.1996.0833. [DOI] [PubMed] [Google Scholar]
- 11.Kuriyan J, Wilz S, Karplus M, Petsko GA. X-ray structure and refinement of carbon-monoxy (Fe II)-myoglobin at 1.5 A resolution. J Mol Biol. 1986;192:133–154. doi: 10.1016/0022-2836(86)90470-5. [DOI] [PubMed] [Google Scholar]
- 12.Vojtěchovský J, Chu K, Berendzen J, Sweet RM, Schlichting I. Crystal structures of myoglobin-ligand complexes at near-atomic resolution. Biophys. J. 1999;77:2153–2174. doi: 10.1016/S0006-3495(99)77056-6. [DOI] [PMC free article] [PubMed] [Google Scholar]
- 13.Lim M, Jackson TA, Anfinrud PA. Binding of CO to myoglobin from a heme pocket docking site to form nearly linear Fe-C-O. Science. 1995;269:962–966. doi: 10.1126/science.7638619. [DOI] [PubMed] [Google Scholar]
- 14.Antonyuk SV, Rustage N, Petersen CA, Arnst JL, Heyes DJ, Sharma R, Berry NG, Scrutton NS, Eady RR, Andrew CR, Hasnain SS. Carbon monoxide poisoning is prevented by the energy costs of conformational changes in gas-binding haemproteins. Proc Natl Acad Sci U S A. 2011;108:15780–15785. doi: 10.1073/pnas.1109051108. [DOI] [PMC free article] [PubMed] [Google Scholar]
- 15.Nuernberger P, Lee KF, Bonvalet A, Bouzhir-Sima L, Lambry JC, Liebl U, Joffre M, Vos MH. Strong ligand-protein interactions revealed by ultrafast infrared spectroscopy of CO in the heme pocket of the oxygen sensor FixL. J Am Chem Soc. 2011;133:17110–17113. doi: 10.1021/ja204549n. [DOI] [PubMed] [Google Scholar]
- 16.Sugishima M, Sakamoto H, Noguchi M, Fukuyama K. Crystal structures of ferrous and CO-, CN−-, and NO-bound forms of rat heme oxygenase-1 (HO-1) in complex with heme: structural implications for discrimination between CO and O2 in HO-1. Biochemistry. 2003;42:9898–9905. doi: 10.1021/bi027268i. [DOI] [PubMed] [Google Scholar]
- 17.Unno M, Matsui T, Ikeda-Saito M. Structure and catalytic mechanism of heme oxygenase. Nat Prod Rep. 2007;24:553–570. doi: 10.1039/b604180a. [DOI] [PubMed] [Google Scholar]
- 18.Friedman J, Meharenna YT, Wilks A, Poulos TL. Diatomic ligand discrimination by the heme oxygenases from Neisseria meningitidis and Pseudomonas aeruginosa. J Biol Chem. 2007;282:1066–1071. doi: 10.1074/jbc.M609112200. [DOI] [PubMed] [Google Scholar]
- 19.Sugishima M, Sakamoto H, Noguchi M, Fukuyama K. CO-trapping site in heme oxygenase revealed by photolysis of its CO-bound heme complex: mechanism of escaping from product inhibition. J. Mol. Biol. 2004;341:7–13. doi: 10.1016/j.jmb.2004.05.048. [DOI] [PubMed] [Google Scholar]
- 20.Schlichting I, Berendzen J, Phillips GN, Jr, Sweet RM. Crystal structure of photolysed carbonmonoxy-myoglobin. Nature. 1994;371:808–812. doi: 10.1038/371808a0. [DOI] [PubMed] [Google Scholar]
- 21.Teng TY, Šrajer V, Moffat K. Photolysis-induced structural changes in single crystals of carbonmonoxy myoglobin at 40 K. Nat. Struct. Biol. 1994;1:701–705. doi: 10.1038/nsb1094-701. [DOI] [PubMed] [Google Scholar]
- 22.Hartmann H, Zinser S, Komninos P, Schneider RT, Nienhaus GU, Parak F. X-ray structure determination of a metastable state of carbonmonoxy myoglobin after photodissociation. Proc. Natl. Acad. Sci. U S A. 1996;93:7013–7016. doi: 10.1073/pnas.93.14.7013. [DOI] [PMC free article] [PubMed] [Google Scholar]
- 23.Chu K, Vojtchovsky J, McMahon BH, Sweet RM, Berendzen J, Schlichting I. Structure of a ligand-binding intermediate in wild-type carbonmonoxy myoglobin. Nature. 2000;403:921–923. doi: 10.1038/35002641. [DOI] [PubMed] [Google Scholar]
- 24.Adachi S, Park SY, Tame JR, Shiro Y, Shibayama N. Direct observation of photolysis-induced tertiary structural changes in hemoglobin. Proc. Natl. Acad. Sci. U S A. 2003;100:7039–7044. doi: 10.1073/pnas.1230629100. [DOI] [PMC free article] [PubMed] [Google Scholar]
- 25.Yamaoka M, Sugishima M, Noguchi M, Fukuyama K, Mizutani Y. Protein dynamics of heme–heme oxygenase-1 complex following carbon monoxide dissociation. J. Raman Spectrosc. 2011;42:910–916. [Google Scholar]
- 26.Otwinowski Z, Minor W. Processing of X-ray Diffraction Data Collected in Oscillation Mode. Methods Enzymol. 1997;276:307–326. doi: 10.1016/S0076-6879(97)76066-X. [DOI] [PubMed] [Google Scholar]
- 27.Murshudov GN, Vagin AA, Dodson EJ. Refinement of macromolecular structures by the maximum-likelihood method. Acta Crystallogr D Biol Crystallogr. 1997;53:240–255. doi: 10.1107/S0907444996012255. [DOI] [PubMed] [Google Scholar]
- 28.Emsley P, Cowtan K. Coot: model-building tools for molecular graphics. Acta Crystallogr D Biol Crystallogr. 2004;60:2126–2132. doi: 10.1107/S0907444904019158. [DOI] [PubMed] [Google Scholar]
- 29.Chen VB, Arendall WB, 3rd, Headd JJ, Keedy DA, Immormino RM, Kapral GJ, Murray LW, Richardson JS, Richardson DC. MolProbity: all-atom structure validation for macromolecular crystallography. Acta Crystallogr D Biol Crystallogr. 2010;66:12–21. doi: 10.1107/S0907444909042073. [DOI] [PMC free article] [PubMed] [Google Scholar]
- 30.Ursby T, Bourgeois D. Improved estimation of structure-factor difference amplitudes from poorly accurate data. Acta Crystallogr. A. 1997;53:564–575. [Google Scholar]
- 31.Paithankar KS, Owen RL, Garman EF. Absorbed dose calculations for macromolecular crystals: improvements to RADDOSE. Journal of Synchrotron Radiation. 2009;16:152–162. doi: 10.1107/S0909049508040430. [DOI] [PubMed] [Google Scholar]
- 32.Unno M, Matsui T, Chu GC, Couture M, Yoshida T, Rousseau DL, Olson JS, Ikeda-Saito M. Crystal structure of the dioxygen-bound heme oxygenase from Corynebacterium diphtheriae: Implications for heme oxygenase function. J. Biol. Chem. 2004;279:21055–21061. doi: 10.1074/jbc.M400491200. [DOI] [PubMed] [Google Scholar]
- 33.Takahashi S, Ishikawa K, Takeuchi N, Ikeda-Saito M, Yoshida T, Rousseau DL. Oxygen-Bound Heme-Heme Oxygenase Complex: Evidence for a Highly Bent Structure of the Cooridnated Oxygen. J. Am. Chem. Soc. 1995;117:6002–6006. [Google Scholar]
- 34.Ostermann A, Waschipky R, Parak FG, Nienhaus GU. Ligand binding and conformational motions in myoglobin. Nature. 2000;404:205–208. doi: 10.1038/35004622. [DOI] [PubMed] [Google Scholar]
- 35.Migita CT, Togashi S, Minakawa M, Zhang X, Yoshida T. Evidence for the hydrophobic cavity of heme oxygenase-1 to be a CO-trapping site. Biochem Biophys Res Commun. 2005;338:584–589. doi: 10.1016/j.bbrc.2005.08.045. [DOI] [PubMed] [Google Scholar]
- 36.Sato H, Sugishima M, Sakamoto H, Higashimoto Y, Shimokawa C, Fukuyama K, Palmer G, Noguchi M. Crystal structure of rat haem oxygenase-1 in complex with ferrous verdohaem: presence of a hydrogen-bond network on the distal side. Biochem J. 2009;419:339–345. doi: 10.1042/BJ20082279. [DOI] [PubMed] [Google Scholar]
- 37.Petřek M, Otyepka M, Banáš P, Košinová P, Koča J, Damborský J. CAVER: A New Tool to Explore Routes from Protein Clefts, Pockets and Cavities. BMC Bioinformatics. 2006;7:316. doi: 10.1186/1471-2105-7-316. [DOI] [PMC free article] [PubMed] [Google Scholar]
- 38.Mizutani Y, Kitagawa T. Ultrafast dynamics of myoglobin probed by timeresolved resonance Raman spectroscopy. Chem Rec. 2001;1:258–275. doi: 10.1002/tcr.1012. [DOI] [PubMed] [Google Scholar]
- 39.Šrajer V, Teng T, Ursby T, Pradervand C, Ren Z, Adachi S, Schildkamp W, Bourgeois D, Wulff M, Moffat K. Photolysis of the carbon monoxide complex of myoglobin: nanosecond time-resolved crystallography. Science. 1996;274:1726–1729. doi: 10.1126/science.274.5293.1726. [DOI] [PubMed] [Google Scholar]
- 40.Tomita A, Sato T, Ichiyanagi K, Nozawa S, Ichikawa H, Chollet M, Kawai F, Park SY, Tsuduki T, Yamato T, Koshihara SY, Adachi S. Visualizing breathing motion of internal cavities in concert with ligand migration in myoglobin. Proc Natl Acad Sci U S A. 2009;106:2612–2616. doi: 10.1073/pnas.0807774106. [DOI] [PMC free article] [PubMed] [Google Scholar]
- 41.Schrodinger LLC. The PyMOL Molecular Graphics System. Version 1.3r1. 2010 [Google Scholar]
Associated Data
This section collects any data citations, data availability statements, or supplementary materials included in this article.


