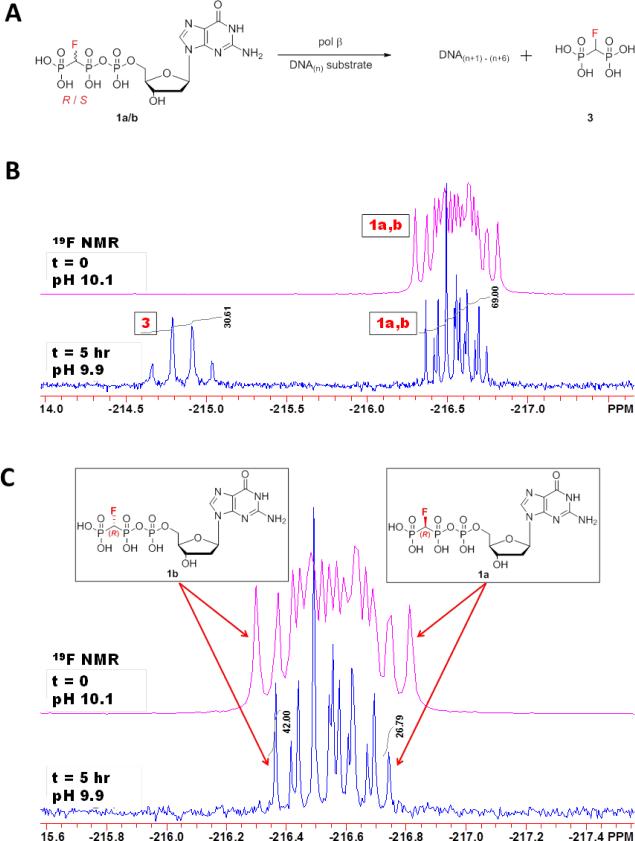
Figure 1.
Reaction scheme and 19F NMR spectra of reaction mixtures. (A) Sketch depicting the direct competition reaction carried out for the NMR analysis. β,γ-CHF-dGTP andp-CHF-p bisphosphonate are labeled below for identification with NMR spectra. DNA(n+1)-(n+6) denotes that up to 6 correct nt can be inserted opposite the 6 consecutive dCs in the template (see Materials and Methods). (B) β,γ-CHF-dGTP in an equal mixture of R and S is incubated with primer/template DNA with wt pol β, and 19F NMR spectra are taken at time zero (upper pink trace) and after a five hour incubation (lower blue trace). Peaks are labeled as in A. (C) Zoom in of peaks corresponding to unreacted β,γ-CHF-dGTP analogue (1a and 1b) at time zero (upper pink trace) and after five hours (lower blue trace). The outer peaks can be used to specifically identify and quantitate the individual diastereomers, with the downfield (left) peak corresponding to the S diastereomer (1b), and the upfield (right) peak corresponding to the R (1a). dGMP (2) from hydrolysis was < 2% by 31P NMR (Figure S1 of the Supporting Information).

