Abstract
Recent studies have shown that the transcription factor early growth response-1 (Egr-1) regulates ethanol-induced fatty liver. However, the mechanism(s) through which ethanol oxidation controls Egr-1 is unknown. Here, using recombinant hepatoma (HepG2; VL-17A) cells that metabolize ethanol, we show that alcohol dehydrogenase catalysis of ethanol oxidation and subsequent acetaldehyde production controls Egr-1 expression. Further, the induction of Egr-1 enhances expression of other steatosis-related genes, resulting in triglyceride accumulation. Ethanol exposure increased Egr-1 promoter activity, messenger RNA and Egr-1 protein levels in VL-17A cells. Elevated Egr-1 protein was sustained by an ethanol-induced decrease in proteasome activity, thereby stabilizing the Egr-1 protein. Egr-1 induction depended on ethanol oxidation, as it was prevented when ethanol oxidation was blocked. Ethanol exposure induced Egr-1 and triglyceride accumulation only in alcohol dehydrogenase-expressing cells that produced acetaldehyde. Such induction did not occur in parental, non-metabolizing HepG2 cells or in cells that express only cytochrome P450 2E1. However, direct exposure of HepG2 cells to acetaldehyde induced both Egr-1 protein and triglycerides. Egr-1 over-expression elevated triglyceride levels, which were augmented by ethanol exposure. However, these triglyceride levels did not exceed those in ethanol-exposed cells that had normal Egr-1 expression. Conversely, Egr-1 knockdown by siRNA only partially blocked ethanol-induced triglyceride accumulation and was associated not only with lower Egr-1 expression but also attenuation of SREBP1c and TNF-α mRNAs. Double knockdown of both Egr-1 and SREBP-1c abolished ethanol-elicited steatosis. Collectively, our findings provide important new insights into the temporal regulation by ethanol oxidation of Egr-1 and cellular steatosis.
Keywords: acetaldehyde, oxidant stress, cytochrome P450 2E1, proteasome, cellular steatosis
1.1: INTRODUCTION
Steatosis (fatty liver) is the earliest and most frequent response to heavy drinking. Once considered a benign side effect of heavy alcohol consumption, fatty liver is now regarded as a risk factor for the more severe liver pathologies associated with alcoholic liver disease. The regulatory factors that govern alcohol-induced steatosis are incompletely understood. Accumulating evidence shows that early growth response-1 (Egr-1), a zinc finger transcription factor, contributes to the development of alcoholic fatty liver (Donohue et al. 2012; McMullen et al. 2005). During chronic ethanol administration, Egr-1 regulates production of lipopolysaccharide (LPS)-induced tumor necrosis factor- α (TNF-α), an inflammatory cytokine that enhances progression of liver injury (McMullen et al. 2005; Shi et al. 2002). Recently, we reported that Egr-1 contributes to the development of steatosis after acute ethanol administration to mice (Donohue et al. 2012). Egr-1 is an important regulator of inflammatory gene expression and controls the production of monocyte chemotactic protein-1 (MCP-1) and intercellular adhesion molecule-1(ICAM-1), as well as those factors that promote fibrosis, including transforming growth factor-β (TFG-β) and fibroblast growth factor (FGF) (Pritchard and Nagy, 2005). Egr-1 is rapidly and transiently induced by oxidant stress (Gashler and Sukhatme, 1995; Yan et al. 2000b). However, Egr-1 regulation by ethanol consumption depends on the liver cell type (i.e. hepatocytes vs Kupffer cells) and the duration of ethanol exposure (i.e acute vs chronic) (McMullen et al. 2005; Shi et al. 2002). For example, acute ethanol administration to Egr-1 knockout mice causes steatosis which is quantitatively less than that in ethanol-treated wild-type mice. However, the same Egr-1 knockout mice, have higher serum ALT levels than their wild-type littermates (Donohue et al. 2012), supporting the notion that Egr-1 is hepatoprotective (Pritchard et al. 2010). In contrast, after chronic ethanol feeding, Egr-1 null mice develop no steatosis compared with wild-type ethanol-fed mice, indicating that Egr-1 expression is necessary for fatty liver development after chronic alcohol administration (McMullen et al. 2005). It was recently reported that Egr-1 causes steatosis and fibrosis after 18 months of ethanol feeding to Long-Evans rats. These authors reported that Egr-1 contributes to steatosis by activating the sterol regulatory element binding protein 1c (SREBP-1c) through binding to its promoter region, thereby activating lipid biosynthesis (Derdak et al. 2012). Here, we report the use of a HepG2 cell culture model to examine the mechanism by which ethanol oxidation causes Egr-1 induction. We sought to identify the ethanol metabolite that induces Egr- 1 in ethanol-metabolizing HepG2 cells and we tested whether the transcription factor is required for the development of ethanol-induced steatosis.
2.1:EXPERIMENTAL PROCEDURES
2.1.1:Reagents
Anti-Egr-1 was obtained from Cell Signaling Technology Inc. (Danvers, MA). Anti-SREBP, anti-CYP2E1 and, anti-β-actin were purchased from Santa Cruz Biotechnology (Santa Cruz, CA). Anti-ADH was a gift from Dr. Michael Felder, University of South Carolina. Protease inhibitor cocktail (Cat # P2714), the proteasome substrate, N-Suc-LLVY-AMC, 4MP, CMZ, trolox and other specialized reagents were from Sigma (St. Louis, MO).
2.1.2: Cell lines
We purchased HepG2 cells from the American Type Culture Collection (Manassas, VA). Dr. Arthur Cederbaum (Mt. Sinai Medical Center, NY) provided E-47 cells, which are stably transfected HepG2 cells that constitutively express human CYP2E1. VA-13 cells are transfected HepG2 cells that stably express the murine class 1 ADH. VL-17A cells are HepG2 cells that express both human CYP2E1 and murine ADH. The latter two lines were developed at this VA facility and previously characterized (Clemens et al. 2002; Donohue et al. 2006).
2.1.3: Cell treatments
All cells were cultured in high glucose DMEM supplemented with 10% v/v FBS, 100 units penicillin/ml and 100 µg streptomycin /ml. E-47 and VA-13 cells were grown with the selective antibiotics, G418 sulfate (400 µg/ml) and zeocin (400 µg/ml) respectively. VL-17A cells were grown in the presence of both antibiotics. For experiments, we seeded cells into T-12.5 or T-25 flasks. After one or two days, we replaced the medium with serum-free DMEM with or without ethanol and/or other agents, as described in the figures legends and text. At harvest, 0.3 ml of the culture medium was treated with one ml of 6.7 % perchloric acid and 27.8 mM thiourea containing 1.1 mM 2-propanol, the latter as an internal standard. A one ml aliquot of each supernatant was transferred to a glass vial, which was capped and heated to 60 °C. The vapor phase of each sample was quantified for ethanol and acetaldehyde concentrations, in a Varian CP-3800 gas chromatograph equipped with a CPPoraBOND Q25 × 0.32 high resolution column (Agilent Technologies).
2.1.4: 20S Proteasome Assays
We measured the chymotrypsin-like activity of the 20S proteasome after incubating cell lysates with the fluorogenic peptide substrate, N-Suc-LLVY-AMC, using our published procedure (Osna et al. 2007). Proteasome activity units are nanomoles AMC generated per hr.
2.1.5: Egr-1 over-expression with adenovirus
VL-17A cells were transduced at a m.o.i. of 5 with Adv-Egr-1 or a control adenovirus that expresses only GFP. Twenty four hr after infection, cells were washed and treated with zero or 50 mM ethanol for 24 hr. Egr-1 over-expression was confirmed by immunoblotting a portion of the cell lysate.
2.1.6: Egr-1 knockdown with siRNA
Control, non-targeting siRNA and Egr-1 siRNA were obtained from Dharmacon Research (Lafayette, CO.). Cells were transfected using the procedure described previously (Park et al. 2008). Twenty-four hr post-transfection, cells were treated with zero or 50 mM ethanol and were analyzed for both Egr-1 protein and triglyceride contents.
2.1.7: Nuclear protein extraction
Nuclear proteins were isolated from cultured cells using Active Motif nuclear extraction kit (Carlsbad, CA).
2.1.8: Immunochemical protein quantification
Proteins were subjected to SDS-PAGE and transferred onto nitrocellulose membranes, which were subsequently incubated with primary antibodies. Membranes were then incubated with either HRP-conjugated or fluorescent-labeled secondary antibodies. Blots were developed using enhanced chemiluminescence (ECL) (Amersham, Pittsburgh, PA) or by the Odyssey® infrared imaging system (Licor, Inc, Lutz, FL). Each immunoreactive protein band was quantified densitometrically using Quantity One software from Bio-Rad (Hercules, CA) or the Licor software and corrected for protein load by calculating the densitometric ratio of the band(s) of interest to that of β-actin.
2.1.9: RNA isolation and real-time PCR
Total cellular RNA was isolated from cells using an RNA purification kit from Invitrogen (Carlsbad, CA). One hundred ng aliquots of RNA were reverse-transcribed using qScript cDNA supermix (Quanta Bioscience, Gaithersburg, MD, USA) to generate cDNA. Specific mRNA levels were quantified from the cDNA samples using fluorescent-labeled DNA primers (Applied Biosysems, Inc Foster City, CA). These were amplified in a Model 7500 qRT-PCR thermal cycler (Biometra Inc). The relative quantity of each cDNA transcript was calculated by its threshold cycle (Ct) of amplification and corrected by subtracting the Ct of the reference cDNA (18S ribosomal RNA). Data are expressed as the relative quantity (RQ) of transcript in ethanol-treated cells compared to that in untreated controls, which were given a value of 1.
2.1.10: Egr-1 promoter assay
VL-17A cells were grown to 50–70% confluence in 12-well plates and transfected, using FuGENE HD transfection reagent, with Egr-1 promoter and pRL-TK plasmid, the latter an internal control for transfection efficiency. Forty eight hr after transfection, cells were treated or not with ethanol or acetaldehyde as indicated. Cell extracts were then prepared and analyzed for luciferase activity using the Dual Luciferase Assay System (Promega).
2.1.11:Triglyceride Assay
Cell pellets were subjected to total lipid extraction as described (Folch et al. 1957). The filtered organic lipid extracts were dried by vacuum centrifugation and then saponified at 65°C in 0.73 N KOH in 86.3% ethanol. Triglycerides were quantified spectrophotometrically using Thermo DMA reagent (Middletown,VA) and calculated using a triolein standard and normalized per µg DNA in the cell pellet.
2.1.12: Protein and DNA Assays
Total proteins were quantified in a 96-well plate format using the BCA reagent (Smith et al. 1985). DNA was quantified flurometrically (Labarca and Paigen, 1980)
2.1.13: Statistical analysis
Data are expressed as mean values ± SEM. Statistical significance between two groups was determined by Student’s t-test and among multiple groups by one way ANOVA with a Neuman-Keuls post-hoc analysis. A probability value (P) ≤ 0.05 was statistically significant.
3.1: RESULTS
3.1.1:Ethanol exposure induced Egr-1 only in ethanol metabolizing HepG2 cells
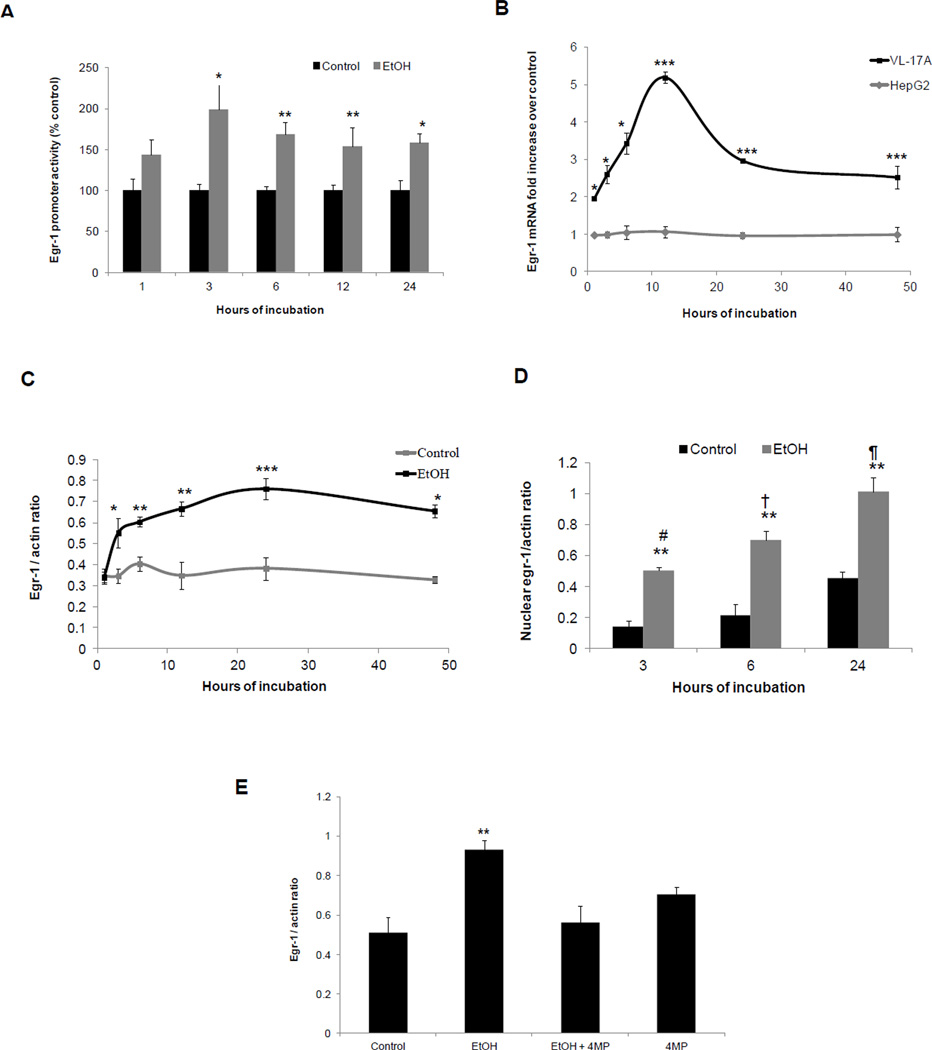
In VL-17A cells there was a numerical rise in Egr-1 promoter activity after one hour of ethanol exposure and which became significantly higher than unexposed controls after three, six, 12 and 24 hr exposure (Fig 1A). In parental HepG2 cells, which do not oxidize ethanol, Egr-1 mRNA level was unaffected by ethanol-exposure, but in VL-17A cells, which oxidize ethanol, Egr-1 mRNA rose after one hr of ethanol exposure and after 12 hr, was five-fold higher than untreated controls (Fig 1B). Western blot analyses revealed that ethanol treatment enhanced Egr-1 protein expression in VL-17A cells (Fig 1C) and that the protein was specifically enriched in the nuclear fraction (Fig 1D). Elevations in Egr-1 promoter activity, Egr-1 mRNA (Supplementary fig 1) and Egr-1 protein were each blocked when ethanol oxidation was inhibited by 4-MP (Fig 1E).
Fig 1. Effects of ethanol on Egr-1 content in VL-17A cells.
(A) Egr-1 promoter activity performed in VL-17A cells exposed to zero (controls) or 50mM ethanol for various time periods as indicated in the figure. (B) Egr-1 mRNA levels in HepG2 and VL-17A cells exposed to zero (controls) or 50 mM ethanol for the indicated time periods. At each time point the control value (i.e. cells treated without ethanol) is 1 for both cell-types and is not shown (C) Densitometric ratios of Egr-1 to β-actin in VL-17A cells exposed to zero (controls) or 50 mM ethanol for various time points as indicated in the figure. (D) Densitometric ratios of nuclear Egr-1 to β-actin in VL-17A cells exposed to zero (controls) or 50mM ethanol for the indicated times. (E) Densitometric ratios of Egr-1 to β-actin in VL-17A cells treated with ethanol in the presence and absence of 4- MP. Data are mean values ± SEM of 4 to 8 samples. ****P < 0.0001, ***P < 0.001,**P < 0.01, *P< 0.05 (control vs ethanol). # vs †, P =0.03 (3 hr ethanol vs 6 hr ethanol), # vs ¶, P =0.006 (3 hr ethanol vs 24 hr ethanol), † vs ¶, P =0.04 (6 hr ethanol vs 24 hr ethanol).
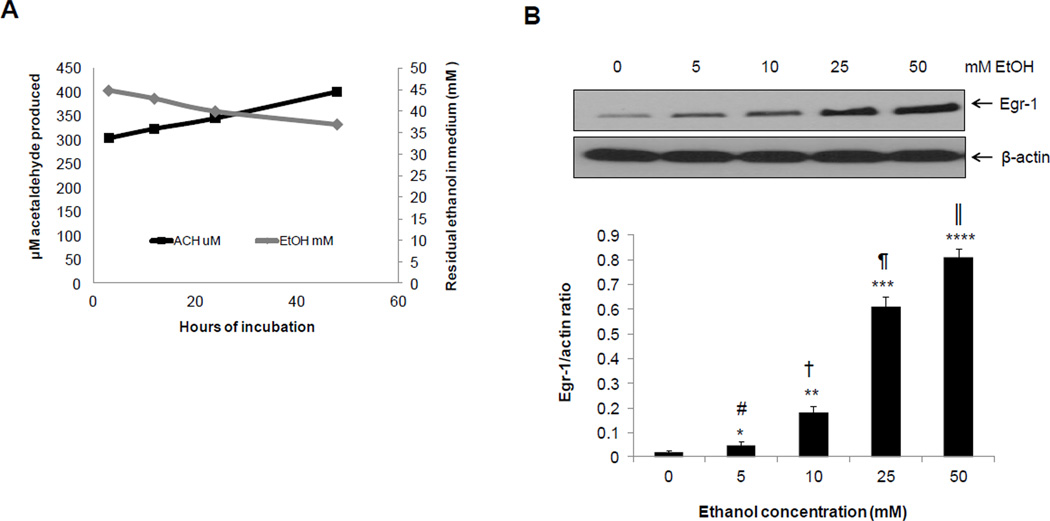
Egr-1 induction by 50 mM ethanol in VL-17A cells was closely associated with acetaldehyde production, which was initially detected at 3 hr and gradually increased in the incubation medium for up to 48 hr (Fig 2A). The Egr-1 response to increasing doses of ethanol was remarkably sensitive. Although exposure to 5 and 10 mM ethanol produced no detectable acetaldehyde, the lower ethanol concentrations still increased Egr-1 protein by two- and nine-fold, respectively, over unexposed controls. In these same experiments, exposure to 25 and 50 mM ethanol generated 58 ± 3.7 and 81 ± 4.8 µM acetaldehyde in the medium respectively, and correspondingly higher levels of Egr-1 than those at 5 and 10 mM ethanol (Fig 2B). Acetaldehyde levels varied widely between experiments, but not within the same experiment. We ascribe this fluctuation not only to acetaldehyde volatility (b.p. = 21°C) but also to variable rates of enzymatic conversion of acetaldehyde to acetate by aldehyde dehydrogenase. Egr-1 inducibility by ethanol was not influenced by the altered NADH+/NAD ratio derived from ethanol and acetaldehyde oxidations (Donohue et al. 2006). When we incubated cells with 50 mM ethanol and 10 µM methylene blue, the latter of which corrects the elevated NADH+/NAD ratio (Ryle et al. 1985), Egr-1 induction proceeded normally (Supplementary fig 2).
Fig 2. Ethanol oxidation and effects of exposure to increasing ethanol doses on Egr-1 protein in VL-17A cells.
>(A) Residual ethanol and acetaldehyde in culture medium after 50mM ethanol treatment for the indicated times. (B) Representative western blot showing Egr-1 protein and densitometric ratios of Egr-1 to β-actin in VL-17A cells exposed to the indicated ethanol concentrations for 24 hr. Data are mean values ± SEM of 4 to 8 samples per group. ****P < 0.0001, ***P < 0.001,**P < 0.01, *P < 0.05 (control vs ethanol). # vs †, P =0.02; # vs ¶, P =0.006; # vs ║, P =0.0009; † vs ¶, P =0.007; † vs║, P =0.001; ¶ vs║, P =0.02.
3.1.2: Ethanol metabolism inhibited proteasome activity
In VL-17A cells exposed to 50 mM ethanol for 24 and 48 hr proteasome activity decreased by 1.3- and 1.5-fold, respectively (Supplementary fig 3). The decline in proteasome activity was associated with elevated ADH and CYP2E1 proteins (Supplementary fig 4). Ethanol-exposed HepG2 cells showed no loss of proteasome activity (Supplementary fig 3).
3.1.3: Egr-1 induction in four HepG2 cell lines
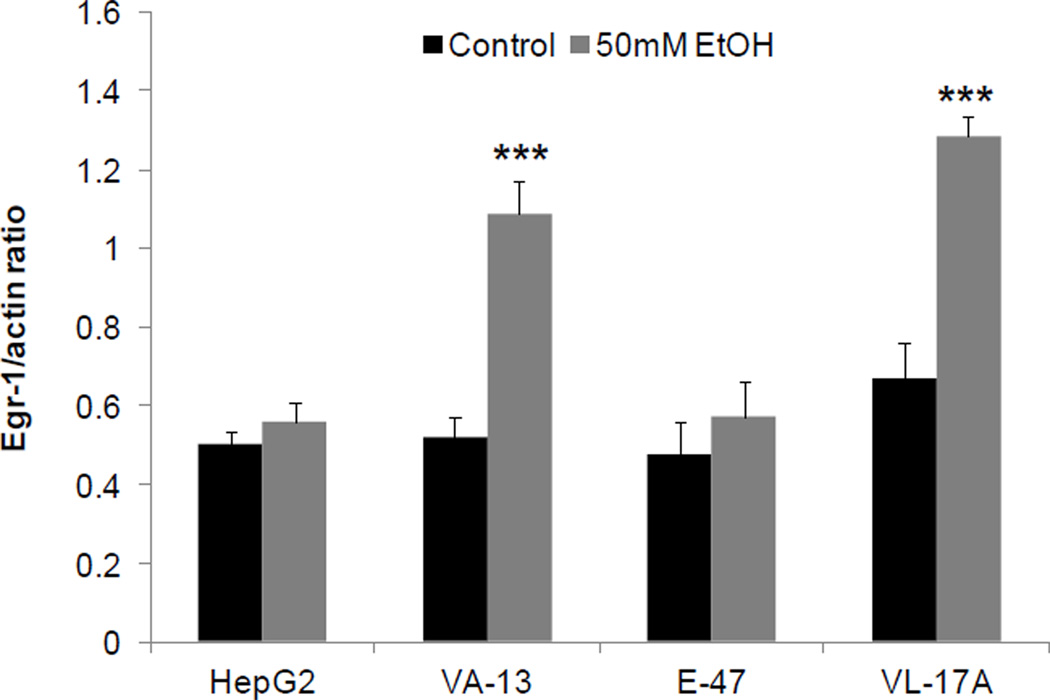
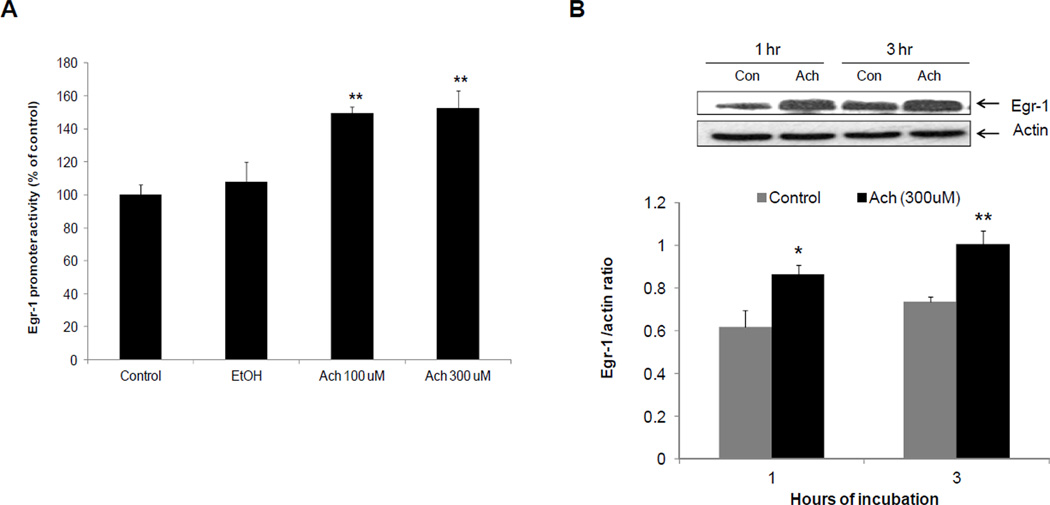
We sought to identify the ethanol metabolite (s) that induced Egr-1. We therefore treated ethanol non-metabolizing HepG2 cells (ADHnull / CYP2E1null) and their recombinant VL-17A cells (ADH+/CYP2E1+), VA-13 cells (ADH+/CYP2E1null) and E-47 cells (ADHnull / CYP2E1+) to zero and 50 mM ethanol for 24 hr. We detected equal levels of acetaldehyde in media of VL-17A and VA-13 cells (Table 1), indicating that CYP2E1 catalysis in VL-17A cells produced no significant amount of acetaldehyde in addition to that produced by ADH alone. These results were confirmed in CYP2E1-expressing E47 cells, which also produced no acetaldehyde and exhibited no Egr-1 induction, even though ethanol exposure to these cells induced the CYP2E1 protein (Table 2). Ethanol exposure also increased ADH protein content in VL-17A and VA-13 cells (Table 2). Despite induction of both alcohol-metabolizing enzymes, ethanol increased Egr-1 only in ADH- expressing cells (Fig 3) and its degree of induction was equal in the two cell types (Fig 3) again indicating that only ADH catalysis was essential for Egr-1 induction. Furthermore, after we specifically inhibited CYP2E1 by exposing VL-17A cells to ethanol and chlormethiazole, the latter a specific CYP2E1 inhibitor, Egr-1 induction proceeded normally (Supplementary fig 5). To substantiate that acetaldehyde is the Egr-1-inducing ethanol metabolite, we exposed parental HepG2 cells to 100 and 300 uM acetaldehyde for one hr. Both acetaldehyde concentrations equally enhanced Egr-1 promoter activity over those of untreated as well as ethanol-treated HepG2 cells (Fig 4A). Enhanced promoter activity was associated with higher levels of Egr-1 protein in lysates of HepG2 cells exposed to 300 µM acetaldehyde for one and three hr (Fig 4B). Inclusion of 10 mM acetate, the intracellular oxidation product of acetaldehyde, did not affect Egr-1 protein content. The average Egr-1/actin ratio for untreated control cells was 0.456 and for acetate treated cells was 0.402 (N=4; P = 0.425).
Table 1.
Acetaldehyde production by four HepG2 cell lines Acetaldehyde produced (μM)
| HepG2 | VA-13 | E-47 | VL-17A |
|---|---|---|---|
| ND | 84.90 ± 27.8 | ND | 92.02 ± 8.1 |
Acetaldehyde levels were measured in the media of the indicated HepG2 cell lines after 24 hrs of incubation with 50mM ethanol. Data are mean values of 4 samples ± SEM.
Note: ND = not detectable
Table 2.
Effects of ethanol exposure on CYP2E1 and ADH protein in parental and recombinant HepG2 cells
| CYP2E1/actin ratio Ethanol |
ADH/actin ratio Ethanol |
|||
|---|---|---|---|---|
| Cell line | 0 | 50mM | 0 | 50mM |
| HepG2 | ND | ND | ND | ND |
| VA-13 | ND | ND | 5.8 ± 0.48 | 8.5 ± 0.71* |
| E-47 | 2.0 ± 0.14 | 3.8 ± 0.40* | ND | ND |
| VL-17A | 2.5 ± 0.31 | 4.6 ± 0.75* | 6.47 ± 0.47 | 9.16 ± 0.7* |
Data are densitometric ratios of CYP2E1/actin (52 kDa) and ADH/actin (42 kDa) to β-actin in cells treated with 50mM ethanol for 24 hr. Data are mean values of 8 to 15 samples ± SEM.
P < 0.05 (Zero (control) vs ethanol).
Note: ND = not detectable
Fig 3. Effects of ethanol on Egr-1 protein content in four hepatoma cell lines.
Densitometric ratios of Egr-1 to β-actin in HepG2, VA-13, E-47 and VL-17A cells treated with (+) and without ((−) controls) 50 mM ethanol for 24 hr. Data are mean values of 4 samples ± SEM. ****P < 0.0001, ***P < 0.001,**P < 0.01, *P < 0.05 (control vs ethanol).
Fig 4. Effects of acetaldehyde on Egr-1 promoter activity and protein content in ethanol non-metabolizing HepG2 cells.
(A) Egr-1 promoter activity performed in HepG2 cells treated or untreated with two acetaldehyde concentrations (100 and 300uM) or 50 mM ethanol for 1 hr. (B) Representative western blot showing Egr-1 protein and densitometric ratios of Egr-1 to β- actin in HepG2 cells exposed to 300 uM acetaldehyde for 1 and 3 hr. ****P < 0.0001, ***P < 0.001,**P < 0.01, *P < 0.05 (control vs ethanol).
3.1.4: Egr-1 expression was strongly associated with triglyceride accumulation
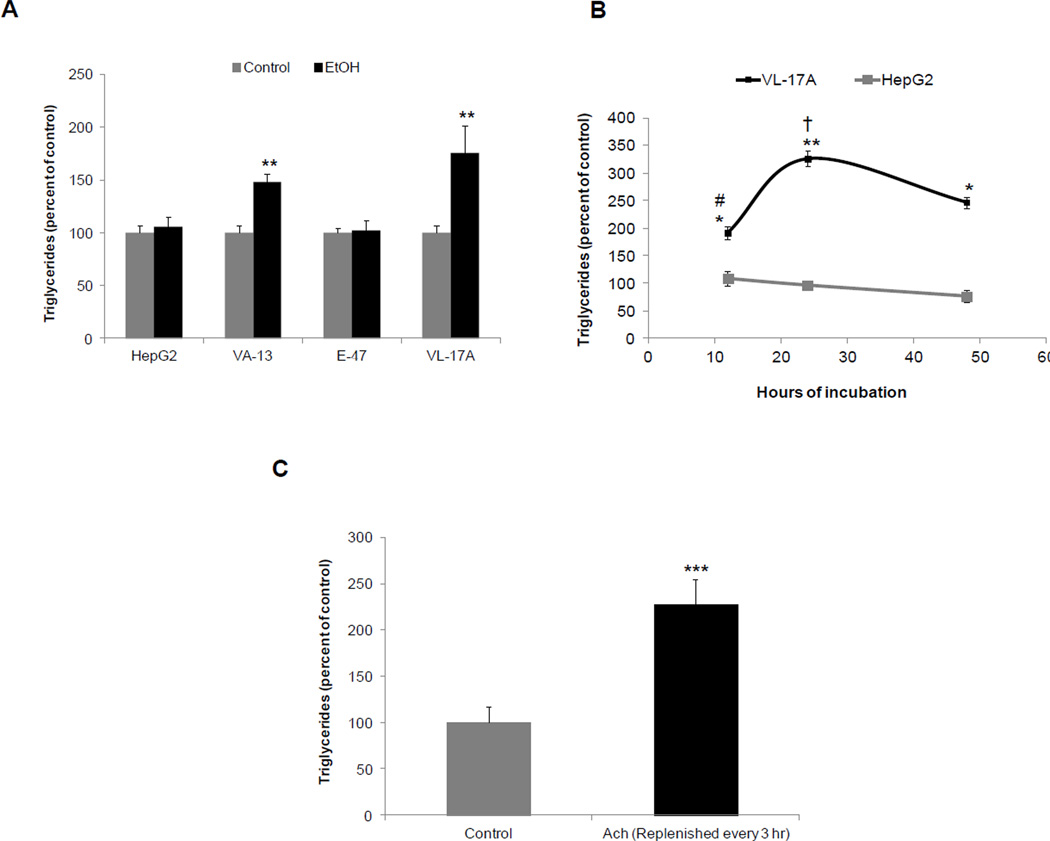
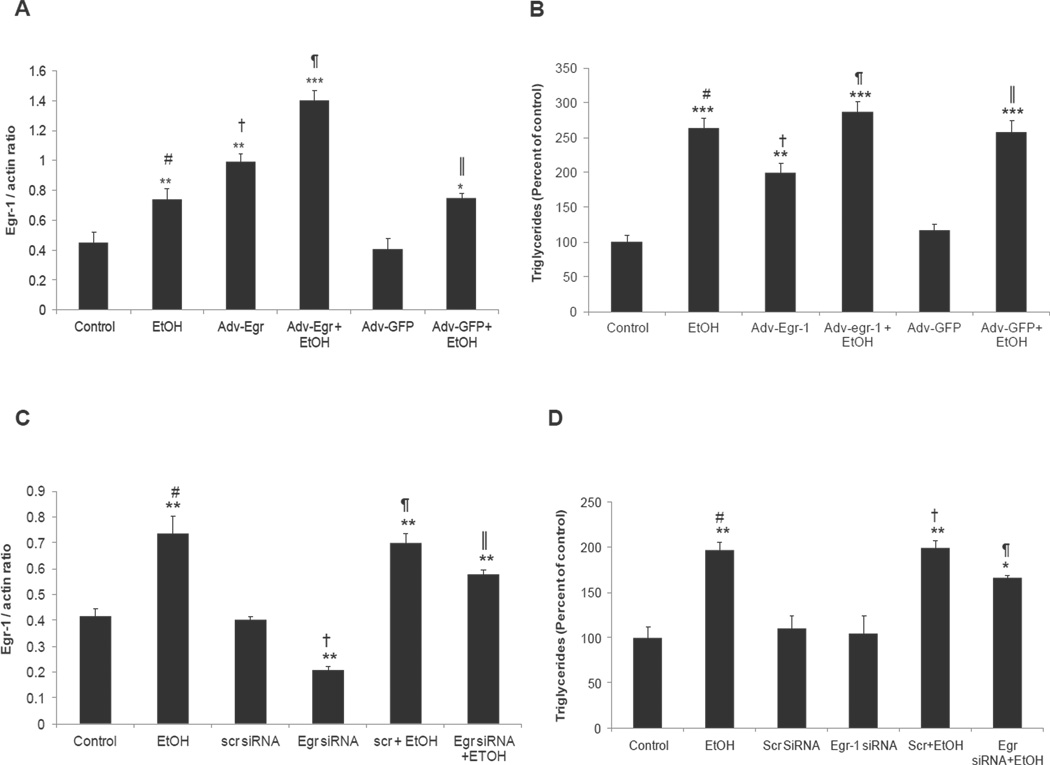
Fig 5A shows that ethanol-exposed VL-17A and VA-13 cells exhibited enhanced triglyceride (TG) levels. These findings were confirmed in separate time course experiments with VL-17A cells, indicating that a time-dependent rise in TGs began after 12 hr and reached a steady state after 24 hr. No such changes occurred in HepG2 cells (Fig 5B), but when the latter were exposed to 300 µM Ach for 12 hr, triglyceride levels exceeded those in untreated HepG2 controls by 2.3-fold (Fig 5C). To further ascertain the involvement of Egr-1 in cellular steatosis we measured triglyceride content in VL-17A cells after Egr-1 was over-expressed. Egr-1 overexpression caused a two-fold rise in both Egr-1 protein and in triglyceride levels over those in untransduced cells (Fig 6 A & B). When Adv-Egr-1 cells were exposed to ethanol, Egr-1 protein content and triglycerides further increased 1.5- and 1.4-fold respectively. Transduction of VL-17A cells with Adv-GFP (a control vector) affected neither Egr-1 protein nor triglyceride accumulation, but when these cells were exposed to ethanol, Egr-1 induction and triglyceride accumulation proceeded normally. Despite the augmentation of Egr-1 protein by ethanol and/or Adv-Egr-1 transduction, triglyceride levels did not rise above those produced by ethanol alone (Fig 6B).
Fig 5. Effects of ethanol and acetaldehyde on triglyceride accumulation in four cell lines.
(A) Triglyceride levels in HepG2, VA-13, E-47 and VL-17A cells treated with and without (controls) 50 mM ethanol for 24 hr (B) Triglyceride levels in HepG2 or VL-17A cells exposed to zero (controls) or 50 mM ethanol for various time points as indicated in the figure. # vs †, P =0.03 (C) Triglyceride levels in HepG2 cells treated with and without (control) 300µM acetaldehyde for 12 hr. Data are mean values of 4 to 6 samples ± SEM. ****P < 0.0001, ***P < 0.001,**P < 0.01, *P < 0.05 (control vs ethanol) Note: Acetaldehyde was replenished every 3 hr.
Fig 6. Egr-1 is essential for triglyceride accumulation in VL-17A cells.
(A) Egr-1 protein levels after adenovirus mediated Egr-1 over-expression. # vs †, P =0.03; # vs ¶, P =0.01; † vs ¶, P =0.02; † vs║, P =0.03; ¶ vs║, P =0.01. (B) Triglyceride levels in un-transduced, Adv-Egr-1-transduced and Adv-GFP transduced cells exposed to zero (controls) or 50 mM EtOH for 24 hr. # vs †, P =0.02; † vs ¶, P =0.01; † vs║, P =0.04 (C) Egr-1 protein levels after siRNA mediated Egr-1 knockdown in VL-17A cells. # vs †, P =0.003; # vs║, P =0.03; † vs ¶, P =0.006; † vs║, P=0.01; ¶ vs║, P =0.03. (D) Triglyceride levels in untransfected, scrambled siRNA transfected, Egr-1siRNA transfected cells exposed to zero (controls) or 50 mM EtOH for 24 hr. # vs ¶, P =0.04; † vs ¶, P =0.04. Data are mean values of 6 to 8 samples ± SEM. ****P < 0.0001, ***P < 0.001,**P < 0.01, *P < 0.05 (control vs ethanol).
Egr-1 expression decreased to levels two-fold lower than untransfected cells after we transfected VL-17A cells with Egr-1 siRNA. Despite Egr-1 knockdown, triglyceride levels did not fall below control levels. When Egr-1 siRNA-transfected cells were exposed to ethanol, triglyceride levels still rose above control levels, but, remained 1.2-fold lower (P= 0.04) than in untransfected cells exposed to ethanol. These results indicate that, other factors besides Egr-1 contribute to ethanol-induced triglyceride accumulation (Fig 6 C & D).
3.1.5: Egr-1 co-regulates SREBP-1c and TNF-α to induce triglyceride accumulation
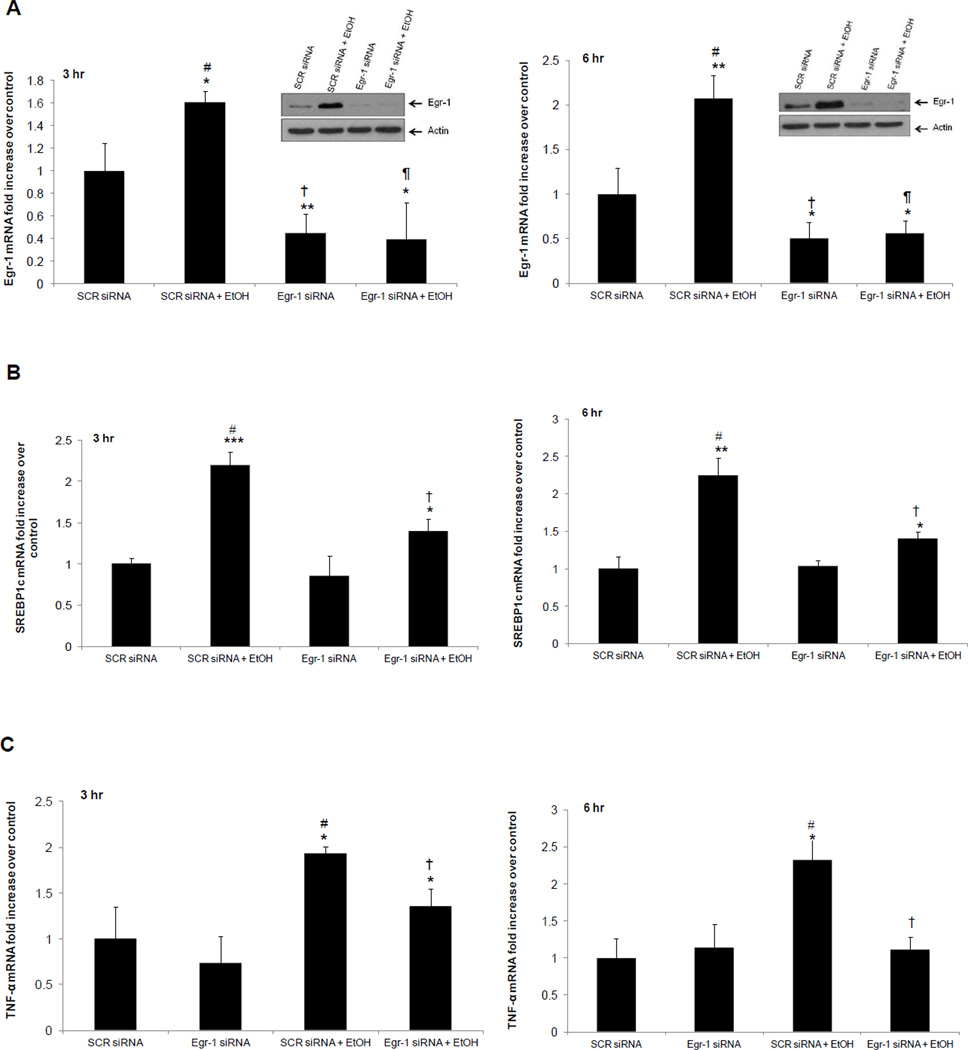
In ethanol-treated VL-17A cells, we quantified the mRNAs encoding SREBP-1c and TNF-α, as each also regulates steatosis. Quantitative PCR analyses revealed that SREBP-1c and TNF-α mRNAs were elevated three and six hr after ethanol exposure, but returned to control levels after 24 hr (Supplementary fig 6). Knockdown of Egr-1 mRNA resulted in the anticipated decrease in Egr-1 expression after three and six hr (Fig 7A). This manipulation also blunted the ethanol-elicited rise in both SREBP-1c and TNF-α mRNAs by 40% and 29% respectively (Fig 7B and 7C) confirming earlier reports that Egr-1 enhances expression of the latter two genes in vivo (Derdak et al. 2012; McMullen et al. 2005; Shi et al. 2002). When we simultaneously knocked down both Egr-1 and SREBP1c with their respective siRNA’s, triglyceride levels dropped to two-fold lower than scrambled siRNA-transfected controls. However, ethanol exposure to the double knockdown cells restored triglycerides to control levels (Fig 8).
Fig 7. Effects of Egr-1 knockdown on SREBP1c and TNF-α in VL-17A cells.
(A) Representative western blot and mRNA levels of Egr-1 in scrambled siRNA- and Egr-1 siRNA-transfected cells treated with and without (controls) 50 mM ethanol for 3 and 6 h. Three hours: # vs. †, P = 0.0001; # vs. ¶, P = 0.0009. Six hours: # vs. †, P = 0.0007; # vs. ¶, P = 0.0007. (B) SREBP1c mRNA levels in scrambled siRNA- and Egr-1siRNA-transfected cells exposed to zero (controls) or 50 mM EtOH for 3 and 6 h. Three hours: # vs. †, P = 0.02. Six hours: # vs. †, P = 0.008 (C). TNF-α mRNA levels in scrambled siRNA- and Egr-1siRNA-transfected cells exposed to zero (controls) or 50 mM EtOH for 3 and 6 h. Three hours: # vs. †, P = 0.04. Six hours: # vs. †, P = 0.01. Data are mean values of 5 samples ± SEM. ****P < 0.0001, ***P < 0.001, **P < 0.01, and *P < 0.05 (control vs. ethanol).
Fig 8. Effects of Egr-1 and SREBP1c knockdown on triglyceride levels in VL-17A cells.
(A) Egr-1 mRNA levels in scrambled siRNA transfected, Egr-1 and SREBP1c siRNA transfected cells exposed to zero (controls) or 50 mM EtOH for 24 hr in VL-17A cells. # vs †, P =0.0001; # vs ¶, P =0.0001. (B) SREBP1c mRNA levels in scrambled siRNA transfected, Egr-1and SREBP1c siRNA transfected cells exposed to zero (controls) or 50 mM EtOH for 24 hr in VL-17A cells. # vs †, P =0.002; # vs ¶, P =0.001. (C) Triglyceride levels in scrambled siRNA transfected, Egr-1and SREBP1c siRNA transfected cells exposed to zero (controls) or 50 mM EtOH for 24 hr in VL-17A cells. Data are mean values of 5 samples ± SEM. # vs †, P =0.00003. ****P < 0.0001, ***P < 0.001,**P < 0.01, *P < 0.05 (control vs ethanol).
4.1: DISCUSSION
Previous studies have identified the transcription factors, SREBP1c (You et al. 2002) and Egr-1 (Derdak et al. 2012) as major regulators of ethanol-induced fatty liver. The data presented herein clearly demonstrate that ethanol oxidation enhances Egr-1 gene transcription and translation. Egr-1 induction paralleled ethanol oxidation, it was specific for cells that express ADH, and occurred irrespective of CYP2E1 expression. Moreover, acetaldehyde production and Egr-1 protein induction were closely associated; both were increased simultaneously after three hr of ethanol exposure and the rise in acetaldehyde levels detected thereafter correlated with that of Egr-1 protein. These data and the finding that direct acetaldehyde exposure enhanced Egr-1 promoter activity and protein content in non-metabolizing HepG2 cells, strongly suggest that acetaldehyde is the major metabolite that initiates Egr-1 induction.
Ethanol-elicited induction of Egr-1 promoter activity was coincident with a rise in Egr-1 mRNA, followed by a rise in Egr-1 protein, clearly indicating that ethanol-enhanced Egr-1 synthesis was initiated by a rapid increase in the transcription of the Egr-1 gene. However, even after Egr-1 mRNA began to decline after 12 hr of ethanol exposure, its protein level remained essentially constant up to 48 hr. This was likely caused by ethanol-induced stabilization of Egr-1, a proteasome substrate (Bae et al. 2002), which remained elevated due to decreased proteasome activity. Previous work showed that oxidants generated by ethanol metabolism directly inhibit proteasome catalysis (Bardag-Gorce et al. 2006). Further evidence of Egr-1 stabilization was indicated by increases in ADH and CYP2E1 proteins, each of which is also a proteasome substrate (Mezey et al. 2001; Roberts et al. 1995; Thomes et al. 2012). Furthermore, the increases in ADH and CYP2E1 likely generated greater quantities of reactive metabolites that inhibited proteasome activity (Bardag-Gorce et al. 2006; Osna et al. 2007). Finally, ethanol elicited Egr-1 stabilization was further confirmed by data showing that ethanol exposure elevated Egr-1 protein even after its mRNA was knocked down (Fig 6C).
Egr-1 induction is associated with steatosis development after acute ethanol feeding to mice (Donohue et al. 2012). Here, we showed that cellular steatosis and Egr-1 induction occurred only in ethanol-exposed cells that expressed ADH and produced acetaldehyde, indicating that acetaldehyde production, Egr-1 induction and triglyceride accumulation are intertwined. We confirmed this after finding that direct acetaldehyde exposure induced both Egr-1 protein and triglyceride accumulation in HepG2 cells that do not metabolize ethanol. Further, the finding that Egr-1 over-expression elevated triglyceride levels, which were augmented by ethanol exposure, indicates that Egr-1 over-expression probably regulated genes involved in fatty acid synthesis to initiate ethanol-induced triglyceride elevation. The Egr-1 knockdown experiments confirmed that the rise in nuclear Egr-1 induced by ethanol oxidation regulated both SREBP1c and the pro lipogenic factor TNF-α (Lawler et al. 1998) to initiate cellular steatosis. Derdak et al. reported that long-term ethanol feeding to Long-Evans rats increases the nuclear abundance of Egr-1, which activates SREBP1c expression by binding to its promoter. Therefore, it is likely that triglyceride accumulation in VL-17A cells occurred partly by this mechanism. However, triglyceride accumulation in ethanol treated Egr-1 over-expressing cells did not exceed that caused by ethanol exposure to untransduced cells. Egr-1 regulates triglyceride accumulation through SREBP1c. But, there are other factors including the pregnane × receptor (PXR) (Zhou et al. 2006), Cidea, the cell death-inducing DNA fragmentation factor-α-like effector (CIDE) domain-containing protein (Zhou et al. 2012), ChREBP, the transcription factor, carbohydrateresponsive element–binding protein (Denechaud et al. 2008) and Liver X receptors (LXRs) (Denechaud et al. 2008), which also contribute to cellular steatosis. It is likely that in VL-17A cells Egr-1 did not influence other lipogenic factors to raise triglyceride levels beyond a certain level.
In VL-17A cells, Egr-1 and SREBP1c were simultaneously induced by ethanol exposure and both preceded triglyceride accumulation. Such co-induction is apparently due to activation of a common regulatory mechanism because, like Egr-1, SREBP1c is induced only in ADH-expressing cells (You et al. 2002). Interestingly, Egr-1 mRNA levels remained elevated up to 48 hr while SREBP1c and TNF-α mRNAs increased above controls for only six hr. Although, SREBP1c was transiently up-regulated, such induction was apparently sufficient to induce triglyceride accumulation. Further, the data indicate that, apart from regulating SREBP1c and TNF-α, Egr-1 may control other alcohol responsive genes depending on the duration of ethanol exposure. Genes involved in alcoholic liver injury including PDGF, TGF-β, FGF, TNF-α and SREBP1c each has Egr-1 binding sites on its promoter region. (Derdak et al. 2012; McMullen et al. 2005; Pritchard and Nagy, 2005; Yan et al. 2000a). We propose that the temporal regulation of these genes by Egr-1 is the molecular basis for the progression from steatosis to fibrosis, a more severe form of alcoholic liver disease (Derdak et al. 2012). Egr-1 expression knockdown did not completely block triglyceride elevation after ethanol exposure. However, knockdown of both Egr-1 and SREBP1c reduced triglyceride levels below those of controls. These results confirm that, in addition to Egr-1, SREBP1c is involved in steatosis regulation in ethanol oxidizing cells. We also recognize that other lipogenesis pathways involving PXR, CIDE, ChREBP or LXR may be involved in triglyceride regulation in the absence of SREBP1c as seen in Fig 8C, which shows triglyceride induction by ethanol after SREBP1c knockdown. It is important to note that these findings in cultured cells are consistent with our in vivo observations, which showed that the loss of Egr-1 expression in knockout mice reduces, but does not abolish ethanol-induced triglyceride accumulation (Donohue et al. 2012).
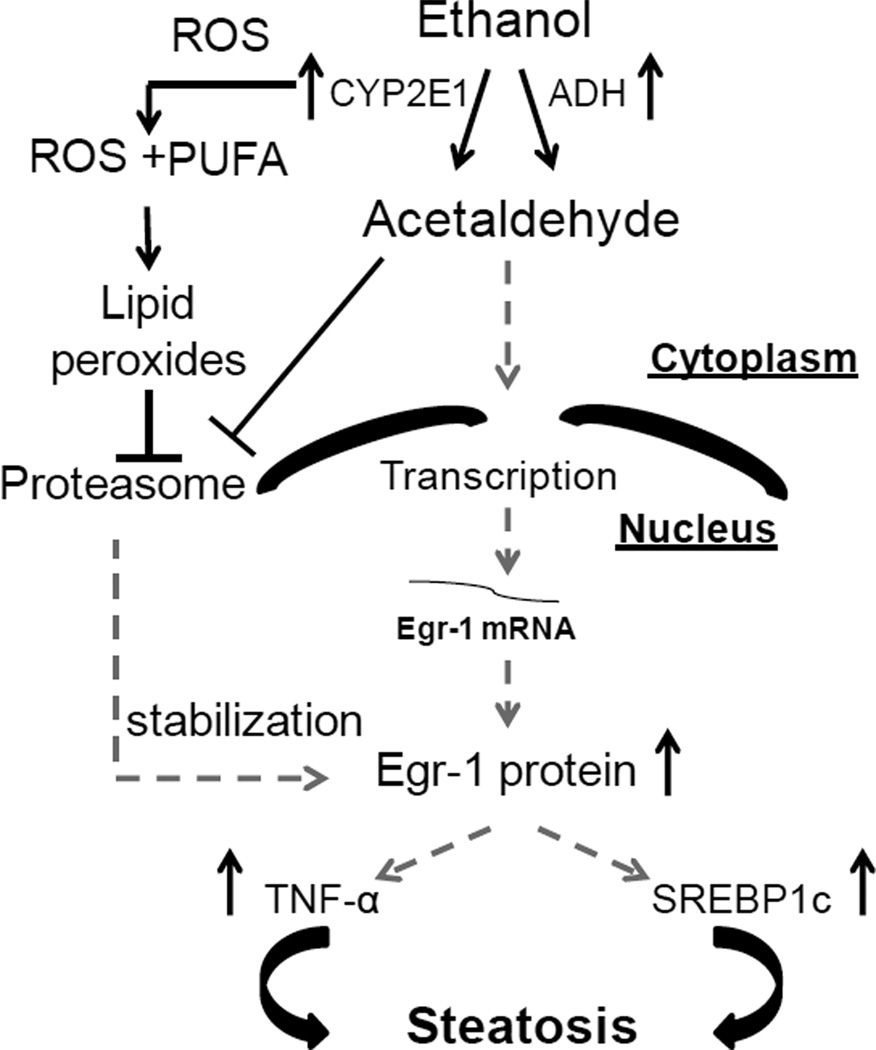
In summary, Egr-1 induction occurred via ADH-catalyzed ethanol oxidation, which generated acetaldehyde in ethanol-metabolizing VL-17A and VA-13 cells. The most notable findings in this study were that 1) acetaldehyde, the primary oxidation product of ethanol metabolism, initiated Egr-1 production by increasing Egr-1 mRNA transcription and translation; and 2), while acetaldehyde enhanced Egr-1 synthesis, reactive products generated by ethanol oxidation inhibited proteasome activity, thereby stabilizing Egr-1 and sustaining its already-elevated levels in the nucleus. Our findings strongly corroborate recent findings in vivo that showed the involvement of Egr-1 in steatosis induced by acute ethanol administration (Donohue et al. 2012). It is clear that acetaldehyde regulates Egr-1 expression, but the exact mechanism by which the aldehyde controls Egr-1 is unknown. Zhang et al. recently showed that during liver fibrosis, Egr-1 is controlled by the hepatocyte nuclear factor-4α (HNF-4α) and the small heterodimer partner (SHP) (Zhang et al. 2011). These authors also report that Egr-1 may be regulated by the transcription factor E2F-1 or other unknown factors in the absence of HNF-4α. The specific functions of HNF-4α and SHP in our model remains to be tested. However, we postulate that free acetaldehyde binds directly to the Egr-1 promoter to increase Egr-1 gene transcription. Alternatively, acetaldehyde covalently binds SHP to block its negative effect on HNF-4α that targets the Egr-1 promoter, thereby enhancing Egr-1 gene expression. Based upon the data presented here, Fig 9 depicts our current view of how Egr-1 is regulated by ethanol oxidation and by the proteasome.
Fig 9. Proposed mechanism of Egr-1 regulation by ethanol oxidation.
ADH-catalysis of ethanol oxidation produces acetaldehyde, which enhances Egr-1 gene transcription by activating Egr-1 promoter. Increased gene transcription enhances Egr-1 mRNA which precedes a rise in nuclear Egr-1 protein. CYP2E1 and ADH catalysis of ethanol oxidation generates reactive products and inhibits proteasome activity. Such inhibition stabilizes Egr-1 protein, from hydrolysis by the proteasome. Finally, Egr-1 regulates SREBP1c and TNF-α to initiate ethanol induced steatosis
Supplementary Material
(A) Egr-1 promoter activity after 24 hr (B) Egr-1 mRNA levels after 12 hr in VL-17A cells treated with 50 mM ethanol in the presence or absence of 4-MP. Data are mean values of 4 to 6 samples ± SEM. ****P < 0.0001, ***P < 0.001,**P < 0.01, *P < 0.05 (control vs ethanol).
Densitometric ratios of Egr-1 to β-actin in VL-17A cells treated with 10µM methlynele blue in the presence and absence (controls) of 50 mM ethanol for 24 hr. Data are mean values of 4 samples ± SEM. ****P < 0.0001, ***P < 0.001,**P < 0.01, *P < 0.05 (control vs ethanol).
HepG2 and VL-17A cells were exposed to zero (controls) or 50mM ethanol for 24 and 48 hours and proteasome activity was measured. Data are mean values of 6 to 8 samples ± SEM. ****P < 0.0001, ***P < 0.001,**P < 0.01, *P < 0.05 (control vs ethanol).
(A) Densitometric ratios of CYP2E1 to β-actin # vs †, P =0.02; # vs ¶, P =0.01 (B) ADH to β-actin in cells treated with and without (controls) 50mM ethanol, as indicated on the abscissa. Data are mean values of 4 to 8 samples ± SEM. ****P < 0.0001, ***P < 0.001,**P < 0.01, *P < 0.05 (control vs ethanol).
Densitometric ratios of Egr-1 to β-actin in cells treated as indicated on the abscissa. Data are mean values of 4 samples ± SEM. ****P < 0.0001, ***P < 0.001,**P < 0.01, *P < 0.05 (control vs ethanol) Note: Cells were also treated with the indicated agents alone (i.e. 4MP, CMZ and trolox). The results were the same as untreated controls and are not shown.
Q-RT-PCR performed in VL-17A cells exposed to zero (controls) or 50 mM ethanol for various time periods, as indicated in the figure. Data are mean values of 4 samples ± SEM. ****P < 0.0001, ***P < 0.001,**P < 0.01, *P < 0.05 (control vs ethanol).
Acknowledgements
Casey S. Trambly provided valuable technical assistance in this work. Dr. Dahn L. Clemens developed the VA-13 and Vl-17A cells and provided technical expertise in expanding the Egr-1 promoter. The data presented are from work supported with resources and facilities at the VA-Nebraska-Western Iowa Health Care System of the Department of Veterans, Affairs Veterans Health Administration, Office of Research and Development.
Financial support: Supported by Grant Number 1- R01-AA16546 from the National Institute of Alcohol Abuse and Alcoholism, and by the Section of Gastroenterology and Hepatology, Department of Internal Medicine, University of Nebraska Medical Center.
This work was conducted at the VA-Nebraska-Western Iowa Health Care System
Abbreviations
- ADH
alcohol dehydrogenase
- CYP2E1
cytochrome P450 2E1
- Egr-1
early growth response-1 protein
- 4-MP
4-methylpyrazole
- DMEM
Dulbecco’s modified Eagle’s medium
- CMZ
chlormethiazole
- Suc-LLVY-AMC
succinyl-leucyl-leucyl-7-amido-4-methylcoumarin
- trolox
(6-hydroxy-2,5,7,8-tetramethylchroman-2-carboxylic acid)
- m.o.i
multiplicity of infection.
Footnotes
Publisher's Disclaimer: This is a PDF file of an unedited manuscript that has been accepted for publication. As a service to our customers we are providing this early version of the manuscript. The manuscript will undergo copyediting, typesetting, and review of the resulting proof before it is published in its final citable form. Please note that during the production process errors may be discovered which could affect the content, and all legal disclaimers that apply to the journal pertain.
Disclaimer: The contents of this paper do not represent the views of the Department of Veterans Affairs or the United States Government.
Contributor Information
Natalia A. Osna, Email: nosna@unmc.edu.
John S. Davis, Email: jsdavis@unmc.edu.
Terrence M. Donohue, Jr, Email: tdonohue@unmc.edu.
REFERENCES
- Bae MH, Jeong CH, Kim SH, Bae MK, Jeong JW, Ahn MY, et al. Regulation of Egr-1 by association with the proteasome component C8. Biochim Biophys Acta. 2002;1592:163–167. doi: 10.1016/s0167-4889(02)00310-5. [DOI] [PubMed] [Google Scholar]
- Bardag-Gorce F, French BA, Nan L, Song H, Nguyen SK, Yong H, et al. CYP2E1 induced by ethanol causes oxidative stress, proteasome inhibition and cytokeratin aggresome (Mallory body-like) formation. Exp Mol Pathol. 2006;81:191–201. doi: 10.1016/j.yexmp.2006.07.007. [DOI] [PubMed] [Google Scholar]
- Clemens DL, Forman A, Jerrells TR, Sorrell MF, Tuma DJ. Relationship between acetaldehyde levels and cell survival in ethanol-metabolizing hepatoma cells. Hepatology. 2002;35:1196–1204. doi: 10.1053/jhep.2002.32668. [DOI] [PubMed] [Google Scholar]
- Denechaud PD, Bossard P, Lobaccaro JM, Millatt L, Staels B, Girard J, et al. ChREBP, but not LXRs, is required for the induction of glucose-regulated genes in mouse liver. J Clin Invest. 2008;118:956–964. doi: 10.1172/JCI34314. [DOI] [PMC free article] [PubMed] [Google Scholar]
- Derdak Z, Villegas KA, Wands JR. Early growth response-1 transcription factor promotes hepatic fibrosis and steatosis in long-term ethanol-fed Long-Evans rats. Liver Int. 2012 doi: 10.1111/j.1478-3231.2012.02752.x. [DOI] [PMC free article] [PubMed] [Google Scholar]
- Donohue TM, Osna NA, Clemens DL. Recombinant HepG2 cells that express alcohol dehydrogenase and cytochrome P450 2E1 as a model of ethanol-elicited cytotoxicity. Int J Biochem Cell Biol. 2006;38:92–101. doi: 10.1016/j.biocel.2005.07.010. [DOI] [PubMed] [Google Scholar]
- Donohue TMJ, Osna NA, Whitaker NP, Trambly CS, Thomes PG, Todero SL, et al. Early Growth Response-1 Contributes to Steatosis Development After Acute Ethanol Administration. Alcohol Clin Exp Res. 2012;36:759–767. doi: 10.1111/j.1530-0277.2011.01681.x. [DOI] [PMC free article] [PubMed] [Google Scholar]
- Folch J, Lees M, Stanley GHS. A simple method for the isolation and purification of total lipid from animal tissue. J Biol Chem. 1957;226:497–509. [PubMed] [Google Scholar]
- Gashler A, Sukhatme VP. Early growth response protein 1 (Egr-1): prototype of a zinc-finger family of transcription factors. Prog Nucleic Acid Res Mol Biol. 1995;50:191–224. doi: 10.1016/s0079-6603(08)60815-6. [DOI] [PubMed] [Google Scholar]
- Labarca C, Paigen KA. simple, rapid, and sensitive DNA assay procedure. Anal Biochem. 1980;102:344–352. doi: 10.1016/0003-2697(80)90165-7. [DOI] [PubMed] [Google Scholar]
- Lawler JF, Jr, Yin M, Diehl AM, Roberts E, Chatterjee S. Tumor necrosis factor-alpha stimulates the maturation of sterol regulatory element binding protein-1 in human hepatocytes through the action of neutral sphingomyelinase. J Biol Chem. 1998;273:5053–5059. doi: 10.1074/jbc.273.9.5053. [DOI] [PubMed] [Google Scholar]
- McMullen MR, Pritchard MT, Wang Q, Millward CA, Croniger CM, Nagy LE. Early growth response-1 transcription factor is essential for ethanol-induced fatty liver injury in mice. Gastroenterology. 2005;128:2066–2076. doi: 10.1053/j.gastro.2005.02.065. [DOI] [PMC free article] [PubMed] [Google Scholar]
- Mezey E, Rennie-Tankersley L, Potter JJ. Liver alcohol dehydrogenase is degraded by the ubiquitin-proteasome pathway. Biochem Biophys Res Commun. 2001;285:644–648. doi: 10.1006/bbrc.2001.5226. [DOI] [PubMed] [Google Scholar]
- Osna NA, White RL, Todero S, McVicker BL, Thiele GM, Clemens DL, et al. Ethanol-induced oxidative stress suppresses generation of peptides for antigen presentation by hepatoma cells. Hepatology. 2007;45:53–61. doi: 10.1002/hep.21442. [DOI] [PubMed] [Google Scholar]
- Park SE, Lee SW, Hossain MA, Kim MY, Kim MN, Ahn EY, et al. A chenodeoxycholic derivative, HS-1200, induces apoptosis and cell cycle modulation via Egr-1 gene expression control on human hepatoma cells. Cancer Lett. 2008;270:77–86. doi: 10.1016/j.canlet.2008.04.038. [DOI] [PubMed] [Google Scholar]
- Pritchard MT, Cohen JI, Roychowdhury S, Pratt BT, Nagy LE. Early growth response-1 attenuates liver injury and promotes hepatoprotection after carbon tetrachloride exposure in mice. J Hepatol. 2010;53(4):655–662. doi: 10.1016/j.jhep.2010.04.017. [DOI] [PMC free article] [PubMed] [Google Scholar]
- Pritchard MT, Nagy LE. Ethanol-induced liver injury: potential roles for egr-1. Alcohol Clin Exp Res. 2005;29:146S–150S. doi: 10.1097/01.alc.0000189286.81943.51. [DOI] [PubMed] [Google Scholar]
- Roberts BJ, Song BJ, Soh Y, Park SS, Shoaf SE. Ethanol induces CYP2E1 by protein stabilization. Role of ubiquitin conjugation in the rapid degradation of CYP2E1. J Biol Chem. 1995;270:29632–29635. doi: 10.1074/jbc.270.50.29632. [DOI] [PubMed] [Google Scholar]
- Ryle PR, Chakraborty J, Thomson AD. The effect of methylene blue on the hepatocellular redox state and liver lipid content during chronic ethanol feeding in the rat. Biochem J. 1985;232:877–882. doi: 10.1042/bj2320877. [DOI] [PMC free article] [PubMed] [Google Scholar]
- Shi L, Kishore R, McMullen MR, Nagy LE. Chronic ethanol increases lipopolysaccharidestimulated Egr-1 expression in RAW 264.7 macrophages: contribution to enhanced tumor necrosis factor alpha production. J Biol Chem. 2002;277:14777–14785. doi: 10.1074/jbc.M108967200. [DOI] [PubMed] [Google Scholar]
- Smith PK, Krohn RI, Hermanson GT, Mallia AK, Gartner FH, Provenzano MD, et al. Measurement of protein using bicinchoninic acid. Anal Biochem. 1985;150:76–85. doi: 10.1016/0003-2697(85)90442-7. [DOI] [PubMed] [Google Scholar]
- Thomes PG, Trambly CS, Thiele GM, Duryee MJ, Fox HS, Haorah J, et al. Proteasome activity and autophagosome content in liver are reciprocally regulated by ethanol treatment. Biochem Biophys Res Commun. 2012;417:262–267. doi: 10.1016/j.bbrc.2011.11.097. [DOI] [PubMed] [Google Scholar]
- Yan SF, Fujita T, Lu J, Okada K, Shan Zou Y, Mackman N, et al. Egr-1, a master switch coordinating upregulation of divergent gene families underlying ischemic stress. Nat Med. 2000a;6:1355–1361. doi: 10.1038/82168. [DOI] [PubMed] [Google Scholar]
- Yan SF, Pinsky DJ, Mackman N, Stern DM. Egr-1: is it always immediate and early? J Clin Invest. 2000b;105:553–554. doi: 10.1172/JCI9513. [DOI] [PMC free article] [PubMed] [Google Scholar]
- You M, Fischer M, Deeg MA, Crabb DW. Ethanol induces fatty acid synthesis pathways by activation of sterol regulatory element-binding protein (SREBP) J Biol Chem. 2002;277:29342–29347. doi: 10.1074/jbc.M202411200. [DOI] [PubMed] [Google Scholar]
- Zhang Y, Bonzo JA, Gonzalez FJ, Wang L. Diurnal regulation of the early growth response 1 (Egr-1) protein expression by hepatocyte nuclear factor 4alpha (HNF4alpha) and small heterodimer partner (SHP) cross-talk in liver fibrosis. J Biol Chem. 2011;286(34):29635–29643. doi: 10.1074/jbc.M111.253039. [DOI] [PMC free article] [PubMed] [Google Scholar]
- Zhou J, Zhai Y, Mu Y, Gong H, Uppal H, Toma D, et al. A novel pregnane X receptor-mediated and sterol regulatory element-binding protein-independent lipogenic pathway. J Biol Chem. 2006;281:15013–15020. doi: 10.1074/jbc.M511116200. [DOI] [PMC free article] [PubMed] [Google Scholar]
- Zhou L, Xu L, Ye J, Li D, Wang W, Li X, et al. Cidea promotes hepatic steatosis by sensing dietary fatty acids. Hepatology. 2012;56(1):95–107. doi: 10.1002/hep.25611. [DOI] [PubMed] [Google Scholar]
Associated Data
This section collects any data citations, data availability statements, or supplementary materials included in this article.
Supplementary Materials
(A) Egr-1 promoter activity after 24 hr (B) Egr-1 mRNA levels after 12 hr in VL-17A cells treated with 50 mM ethanol in the presence or absence of 4-MP. Data are mean values of 4 to 6 samples ± SEM. ****P < 0.0001, ***P < 0.001,**P < 0.01, *P < 0.05 (control vs ethanol).
Densitometric ratios of Egr-1 to β-actin in VL-17A cells treated with 10µM methlynele blue in the presence and absence (controls) of 50 mM ethanol for 24 hr. Data are mean values of 4 samples ± SEM. ****P < 0.0001, ***P < 0.001,**P < 0.01, *P < 0.05 (control vs ethanol).
HepG2 and VL-17A cells were exposed to zero (controls) or 50mM ethanol for 24 and 48 hours and proteasome activity was measured. Data are mean values of 6 to 8 samples ± SEM. ****P < 0.0001, ***P < 0.001,**P < 0.01, *P < 0.05 (control vs ethanol).
(A) Densitometric ratios of CYP2E1 to β-actin # vs †, P =0.02; # vs ¶, P =0.01 (B) ADH to β-actin in cells treated with and without (controls) 50mM ethanol, as indicated on the abscissa. Data are mean values of 4 to 8 samples ± SEM. ****P < 0.0001, ***P < 0.001,**P < 0.01, *P < 0.05 (control vs ethanol).
Densitometric ratios of Egr-1 to β-actin in cells treated as indicated on the abscissa. Data are mean values of 4 samples ± SEM. ****P < 0.0001, ***P < 0.001,**P < 0.01, *P < 0.05 (control vs ethanol) Note: Cells were also treated with the indicated agents alone (i.e. 4MP, CMZ and trolox). The results were the same as untreated controls and are not shown.
Q-RT-PCR performed in VL-17A cells exposed to zero (controls) or 50 mM ethanol for various time periods, as indicated in the figure. Data are mean values of 4 samples ± SEM. ****P < 0.0001, ***P < 0.001,**P < 0.01, *P < 0.05 (control vs ethanol).


