

Abstract
The extracellular matrix (ECM) of articular cartilage is structurally and mechanically inhomogeneous and anisotropic, exhibiting variations in composition, collagen fiber architecture, and pericellular matrix (PCM) morphology among the different zones (superficial, middle, and deep). Joint loading exposes chondrocytes to a complex biomechanical environment, as the microscale mechanical environment of the chondrocyte depends on the relative properties of its PCM and local ECM. ECM anisotropy and chondrocyte deformation are influenced by the split-line direction, the preferred collagen fiber orientation parallel to the articular surface. While previous studies have demonstrated that cartilage macroscale properties vary with depth and the direction of loading relative to the split-line direction, the potential anisotropic behavior of the ECM and PCM at the microscale has yet to be examined. The goal of this study was to characterize the depth and directional dependence of the microscale biomechanical properties of porcine cartilage ECM and PCM in situ. Cartilage was cryosectioned to generate samples oriented parallel and perpendicular to the split-line direction and normal to the articular surface. Atomic force microscopy (AFM)-based stiffness mapping was utilized to measure ECM and PCM microscale elastic properties in all three directions within each zone. Distinct anisotropy in ECM elastic moduli was observed in the superficial and deep zones, while the middle zone exhibited subtle anisotropy. PCM elastic moduli exhibited zonal uniformity with depth and directional dependence when pooled across the zones. These findings provide new evidence for mechanical inhomogeneity and anisotropy at the microscale in articular cartilage.
Keywords: type VI collagen, chondron, proteoglycan, glycosaminoglycan, chondron, split-line, indentation, scanning probe microscopy
INTRODUCTION
Articular cartilage is the connective tissue that lines the articulating ends of diarthrodial joints, providing a nearly frictionless surface for joint articulation and functioning to support and distribute mechanical loads. Since the tissue is structurally and mechanically inhomogeneous and anisotropic [reviewed in (Mow et al., 1992)], joint activity generates a complex mechanical environment that varies with depth from the articular surface. Locally, chondrocytes experience stress and strain in directions both parallel and perpendicular to the direction of the applied external load as well as osmotic stress, fluid pressurization, and streaming potentials (Bachrach et al., 1998; Lai et al., 2002; Mow et al., 1994; Mow and Guo, 2002; Wang et al., 2002a; Wong and Sah, 2010). This mechanical environment has been shown to significantly affect chondrocyte metabolic activity, regulating the balance of catabolic and anabolic processes and influencing overall tissue and joint health [as reviewed in (Guilak, 2011; Jurvelin et al., 1997; Williams et al., 2010)].
Cartilage derives its mechanical properties from the structure and composition of its extensive extracellular matrix (ECM), which is rich in type II collagen and proteoglycans (PGs). Based on distance from the articular surface, the ECM is divided into three zones (superficial, middle, and deep) that vary in molecular composition (Muir et al., 1970; Venn and Maroudas, 1977) and matrix architecture (Hwang et al., 1992; Jeffery et al., 1991; Vanden Berg-Foels et al., 2012; Yin et al., 2011). Split-lines are indicative of the preferred collagen fiber orientation parallel to the articular surface (Below et al., 2002; Meachim et al., 1974) and provide an additional component of structural anisotropy. Variations in composition and ultrastructure contribute to the depth- (Chen et al., 2001; Jurvelin et al., 1997; Kempson et al., 1973; Schinagl et al., 1997; Wang et al., 2002a; Wang et al., 2002b; Wu and Herzog, 2002) and directional-dependent (Chahine et al., 2004; Huang et al., 2005; Jurvelin et al., 2003; Mizrahi et al., 1986; Wang et al., 2003) macroscale mechanical properties of the cartilage ECM. While recent studies have evaluated variations in cartilage biomechanical properties with depth at the nanoscale (Tomkoria et al., 2004), depth-dependent anisotropy relative to the split-line orientation has not been examined at the microscale.
Each chondrocyte is surrounded by a distinct pericellular matrix (PCM) that together with the enclosed cell makes up a chondron (Poole et al., 1987). The PCM differs from the ECM in its composition (Hunziker et al., 2002; Poole et al., 1992; Poole et al., 1997; Wang et al., 2008), structure (Hunziker et al., 1997; Poole et al., 1987; Vanden Berg-Foels et al., 2012), and mechanical properties (Alexopoulos et al., 2003; Alexopoulos et al., 2005; Darling et al., 2010; Guilak et al., 2005; Kim et al., 2010; Wilusz et al., in press). In normal cartilage, the PCM is generally defined by the exclusive presence of type VI collagen (Poole et al., 1988) and has a higher concentration of PGs than the ECM (Hunziker et al., 2002; Poole et al., 1984). Type VI collagen microfilaments interact with PGs (Wiberg et al., 2001; Wiberg et al., 2002; Wiberg et al., 2003) and small diameter type II collagen fibers (Wiberg et al., 2003) to constitute the mesh-like capsule of the PCM (Poole et al., 1987) and contribute significantly to the mechanical properties of the PCM (Alexopoulos et al., 2009).
The local mechanical environment of the chondrocyte depends heavily on the relative mechanical properties of the PCM and local ECM at the cell’s position within the tissue (Choi et al., 2007; Guilak and Mow, 2000; Julkunen et al., 2009; Korhonen et al., 2006; Korhonen et al., 2008; Wu and Herzog, 2002). Unlike ECM properties that vary significantly with depth, PCM mechanical properties have been shown to exhibit zonal uniformity (Alexopoulos et al., 2003; Alexopoulos et al., 2005; Guilak et al., 2005; Wilusz et al., in press). While previous studies have shown that PCM morphology reflects the local collagen fiber orientation of the ECM within each zone (Youn et al., 2006), PCM mechanical anisotropy has yet to be characterized. Confocal microscopy studies of chondrocyte deformation in situ have shown that the relationship between cell and ECM deformation is anisotropic in the surface zone and dependent on the split-line direction (Guilak et al., 1995). Finite element studies have demonstrated that ECM anisotropy may have a significant effect on cell deformation under load (Korhonen et al., 2008; Wu and Herzog, 2002), suggesting that the existence of PCM anisotropy could affect the local mechanical environment of the chondrocyte.
The goal of this study was to characterize the depth and directional dependence of microscale mechanical properties of porcine articular cartilage ECM and PCM in situ using atomic force microscopy (AFM). We hypothesized that microscale elastic moduli in the cartilage ECM exhibit depth-dependent anisotropy reflecting the local structure and composition in each zone and that PCM microscale moduli are uniform with depth and isotropic. To test these hypotheses, AFM-based stiffness mapping (Darling et al., 2010) was used to measure the elastic properties of ECM and PCM regions in three mutually-perpendicular directions based on to the split-line orientation.
METHODS
Tissue Sample Preparation
Full thickness cartilage samples were collected from the medial condyles of 2 – 3 year old, skeletally mature, female pigs with no macroscopic signs of cartilage degradation (N = 12 pigs). Local split-line direction was visualized by inserting a surgical needle dipped in India ink (Below et al., 2002) into the cartilage surface immediately adjacent to each 6 mm diameter explant (Figure 1A). Each explant was cut in half either parallel to or perpendicular to the local split-line direction, removed from the condyle, and wrapped in gauze soaked in phosphate buffered saline (PBS) for intermediate storage at −20°C.
Figure 1.
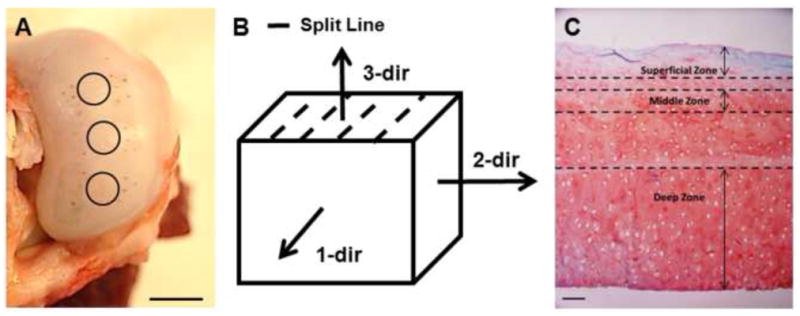
(A) Local split-line orientation near collected cartilage explants (circles) was visualized using India ink. Scale bar = 10 mm. (B) Direction of applied loads relative to the split-line orientation. (C) Histological staining of porcine cartilage for collagen (fast green) and PGs (Safranin-O). For AFM testing, cartilage zones were defined as superficial (0 – 150 μm from the articular surface), middle (200 – 300 μm) and deep (bottom 50% of sample thickness). Scale bar = 100 μm.
Samples were embedded in water-soluble embedding medium (Tissue-Tek O.C.T. Compound; Sakura Finetek USA, Inc., Torrance, CA) and sectioned in 5 μm-thick slices using a cryostat microtome (Leica CM1850; Leica Microsystems, Inc., Buffalo Grove, IL). Cartilage samples were cut in the transverse plane to generate full thickness samples orientated for indentation parallel (1-dir) and perpendicular (2-dir) to the split-line orientation. Additional zone-specific slices were cut parallel to the articular surface to generate sections oriented for indentation normal to the articular surface (3-dir) (Figure 1B). The cartilage zones were defined such that the superficial zone consisted of the region between 0 – 150 μm from the articular surface, the middle zone from 200 – 300 μm from the articular surface, and the deep zone as the bottom half of each explant (Figure 1C). These designations were made based on cell morphology and tissue architecture described previously in the literature (Hunziker et al., 1997; Hwang et al., 1992; Youn et al., 2006). Samples were collected on glass slides and rinsed with PBS to remove the water-soluble embedding medium. Samples remained in PBS at room temperature for AFM testing.
Mechanical Characterization via AFM-based Stiffness Mapping
Elastic moduli were mapped quantitatively using an AFM system (MFP-3D Bio AFM, Asylum Research, Santa Barbara, CA) integrated with an optical microscope (AxioObserver A1; Carl Zeiss, Inc., Thornwood, NY) to allow for phase contrast imaging of cartilage samples. Borosilicate glass spheres (5 μm diameter) were attached to AFM cantilevers (k = 4.5 N/m, Novascan Technologies, Inc.) for microscale mechanical measurements. Indentations were applied with a force trigger of 200 nN and an indentation velocity of 15 μm/s, based on our previous work showing little or no rate-dependence of moduli collected at velocities ranging from 5 μm/s – 25 μm/s (Wilusz et al., in press). Curves were sampled at 7.5 kHz.
Scan regions were selected based on microscopic examination of cartilage sections. ECM testing sites were located in areas visually devoid of cells (Figure 2A, B, C) and ECM properties were evaluated by performing 16 indentations applied over each 20 μm × 20 μm region (n ≥ 91 per zone, per direction). PCM scan regions were placed along the edge of cell-sized voids in the tissue section (Figure 2D) and 400 indentations were applied over each 10 μm × 10 μm region (n ≥ 28 per zone, per direction).
Figure 2.
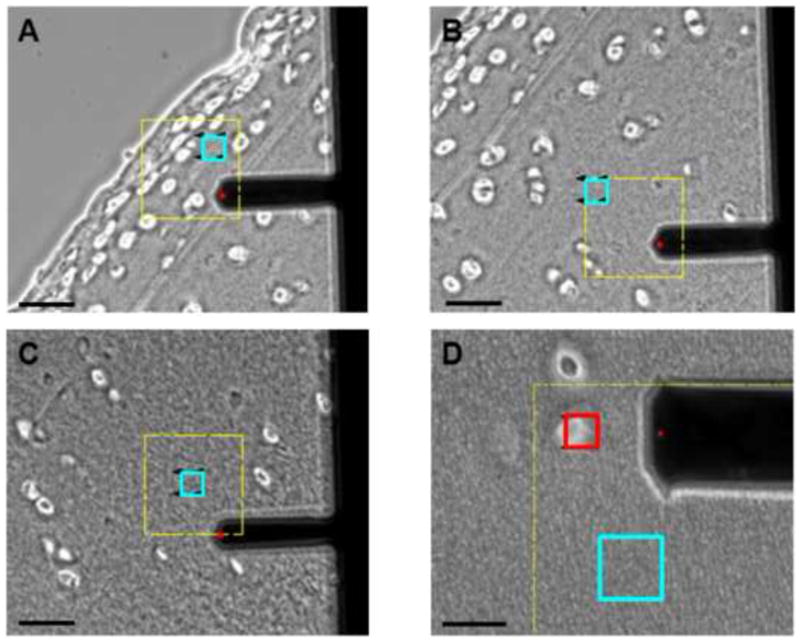
Phase contrast images showing ECM scan regions (blue) in the (A) superficial, (B) middle, and (C) deep zones based on microscopic examination of tissue sections. Cartilage section is oriented for loading parallel to the split-line orientation (1-dir). Scale bar = 50 μm. (D) PCM scan regions (red) were placed along the edge of cell-sized voids. An adjacent ECM scan region (blue) is also shown. Scale bar = 20 μm.
Data Evaluation
Raw data for cantilever deflection and z-piezo movement were analyzed using a custom Matlab script (The MathWorks, Natick, MA). A Hertzian contact model was used calculate tissue modulus (Darling et al., 2006) and provided excellent fits to the experimental data for all force-indentation curves (R2 > 0.90). For ECM regions, the Poisson’s ratio was assumed to be 0.03 in the superficial zone and 0.12 in the middle and deep zones based on published values for porcine cartilage (Choi et al., 2007). For PCM regions, the Poisson’s ratio was assumed to be 0.04 in all zones (Alexopoulos et al., 2005). Probe-surface contact was identified using a contact point extrapolation method described previously (Guo and Akhremitchev, 2006). Two-dimensional contour maps of calculated elastic moduli were generated for each ECM and PCM scan region.
Elastic moduli for PCM regions were extracted using a distance-based definition of the PCM (Darling et al., 2010). Briefly, the inner edge of the PCM was identified using spatial indicators of contact with the underlying glass substrate within each cell-sized void. PCM data were included for a region extending 1 μm radially from this edge to provide a consistent definition across all samples.
Histological Staining
For histological staining of collagen and proteoglycans, unfixed cartilage sections were rinsed with PBS to remove the water-soluble embedding medium. Sections were stained with 0.02% aqueous fast green (Sigma-Aldrich, St. Louis, MO) and Accustain Safranin-O solution (Sigma-Aldrich).
Picrosirius red staining (Junqueira et al., 1979) was utilized to visualize collagen fiber alignment in unfixed cartilage sections. Cartilage samples were sectioned in the transverse plane to generate full thickness samples orientated parallel to the split-line orientation. Sections were rinsed with PBS to remove the water-soluble embedding medium and digested in 50 μL of 0.25 IU/mL chondroitinase-ABC solution (Sigma-Aldrich) in 50 mM Tris buffer containing 60 mM sodium acetate and 0.02% bovine serum albumin (BSA), pH 8.0 at 37°C for 30 minutes to remove glycosaminoglycans. Sections were stained with Picrosirius Red solution (ScyTek Laboratories, Inc., Logan, UT) for 1 hour at room temperature, rinsed twice with 0.5% acetic acid, and dehydrated in ethanol. Stained sections were visualized using polarized light microscopy. A green bandpass filter (λ = 546 nm) was used to provide monochromatic illumination so that differences in light intensity, rather than hue variation, could be visualized (Thomopoulos et al., 2003). To determine the direction of maximum birefringence, images were taken at 10° increments as the analyzer and polarizer were rotated from 0° to 90° (data not shown).
Statistical Analyses
ECM and PCM data were evaluated separately for differences among cartilages zones and loading direction using a two-way ANOVA and Fisher’s LSD post-hoc test (α = 0.05). All data are presented as mean + standard error.
RESULTS
Picrosirius red staining viewed with polarized light revealed distinct ECM collagen alignment through the tissue depth (Figure 3A). High collagen birefringence was observed in a region extending 100 – 125 μm from the articular surface and in the bottom 50% of the cartilage section. PCM birefringence varied considerably from site-to-site and was complicated by edge effects associated with the circular cell-sized voids in the tissue section (Figure 3B).
Figure 3.

Representative polarized light images of picrosirius red stained porcine articular cartilage sections cut parallel to the local split-line orientation. Images shown were captured at the orientation of maximum birefringence. (A) Distinct ECM collagen alignment was observed through the tissue depth. Scale bar = 200 μm. (B) Collagen alignment in the PCM was highly variable site-to-site and complicated by edge effects associated with circular cell-sized voids. Scale bar = 50 μm.
Stiffness mapping revealed that ECM elastic moduli within each zone exhibit distinct directional dependence relative to the split-line orientation (Figure 4). In the superficial zone, 1-dir moduli were 20% greater than 2- and 3-dir moduli (p < 0.0005; Figure 4A). In the middle zone, 1-dir moduli were 14% greater than 2-dir moduli and no significant differences were observed between 1- or 2-dir moduli with 3-dir moduli (p > 0.05). In the deep zone, 3-dir moduli were 24% greater than moduli in both the 1- and 2- directions (p < 0.0005). A decrease in elastic moduli with depth was present in all three tested directions. In both the 1- and 2-directions, superficial zone moduli were significantly greater than those measured in the middle and deep zones (p < 0.000005) and middle zone moduli were greater than deep zone moduli (p < 0.05). In the 3-direction, the only significant difference observed was between the superficial and deep zones (p < 0.05).
Figure 4.

(A) Representative elastic maps for superficial zone ECM scan regions evaluated in the 1-, 2- and 3-directions. (B) Elastic moduli for ECM regions in the superficial, middle, and deep zones evaluated in the 1- (black), 2- (white) and 3- (striped) directions. ECM moduli exhibited distinct depth and directional dependence across the three zones. a: Superficial zone 1-dir as compared to superficial zone 2- & 3-dir (p < 0.0005). b: Superficial zone 1-dir as compared to middle and deep zone 1-dir (p < 0.000001). c: Superficial zone 2-dir as compared to middle and deep zone 2-dir (p < 0.000005). d: Superficial zone 3-dir as compared to deep zone 3-dir (p < 0.05). e: Middle zone 1-dir as compared to middle zone 2-dir (p < 0.05). f: Middle zone 1-dir as compared to deep zone 1-dir (p < 0.00005). g: Middle zone 2-dir as compared to deep zone 2-dir (p < 0.05). h: Deep zone 3-dir as compared to deep zone 1- and 2-dir (p < 0.0005). Moduli presented as mean + standard error (N = 12, n ≥ 91 per zone, per direction).
In PCM scan regions, stiffness mapping revealed lower modulus regions immediately surrounding cell-sized voids (Figure 5A). There was no significant interactive effect between cartilage zone and loading direction for PCM elastic moduli (p = 0.27) and PCM properties exhibited zonal uniformity through tissue depth (p = 0.38; Figure 5B). When pooled across zones, 1-dir PCM moduli were 16% greater than 2- and 3-dir moduli (p < 0.05).
Figure 5.

(A) Representative elastic maps for superficial zone PCM scan regions evaluated in the 1-, 2- and 3-directions. B. Elastic moduli for PCM regions in the superficial, middle and deep zones evaluated in the 1- (black), 2- (white), and 3- (striped) directions. There was no significant interactive effect between cartilage zone and loading direction (p = 0.27) and PCM moduli exhibited zonal uniformity (p = 0.38). When pooled across zones, PCM 1-dir moduli were significantly greater than 2-dir and 3-dir moduli (p < 0.05). Moduli presented as mean + standard error (N = 10, n ≥ 28 per zone, per direction).
DISCUSSION
Our results present new evidence that, at the microscale, articular cartilage mechanical properties exhibit inhomogeneity and anisotropy relative to the split-line orientation. Distinct anisotropy in ECM elastic moduli was observed in the superficial and deep zones whereas the middle zone exhibited subtle anisotropy. Contrary to our initial hypothesis, ECM microscale moduli decreased with depth in all three tested directions. PCM elastic moduli exhibited zonal uniformity with depth and when pooled across zones, were greatest in the direction parallel to the split-line orientation.
Our study supports the hypothesis that collagen fiber orientation has a significant influence on the directional dependence of cartilage ECM mechanical properties. In agreement with our picrosirius red staining results and previous macroscale studies (Chahine et al., 2004; Huang et al., 2005; Wang et al., 2003), AFM-based stiffness mapping demonstrated that ECM microscale elastic moduli exhibit distinct anisotropy in the superficial and deep zones where the local collagen fibers are highly aligned (Hwang et al., 1992; Jeffery et al., 1991). In the superficial zone, collagen fibers run parallel to the articular surface along the split-line orientation. Following this fiber alignment, moduli measured parallel to the split-lines (1-dir) were significantly greater than those measured perpendicular to split-line orientation (2- and 3-dir). In the deep zone, collagen fibers are oriented perpendicular to the articular surface and elastic moduli measured normal to the articular surface (3-dir) were significantly greater than moduli obtained in either transverse plane (1- and 2-dir). Furthermore, we observed subtle anisotropic behavior in the middle zone where moduli were greater parallel to the split-line orientation (1-dir) than perpendicular to it (2-dir). Following the cascade-like architecture of collagen fibers through the depth of the tissue, the middle zone serves as a structural transition between the mutually perpendicular fiber orientations of the superficial and deep zones. Since previous studies have shown the collagen fiber alignment at the articular surface carries through to the middle zone (Jeffery et al., 1991), this in-plane alignment of collagen fibrils likely contributes to the observed anisotropy in the middle zone.
Unlike previous macroscale studies which show a depth-dependent increase in ECM elastic moduli (Chahine et al., 2004; Chen et al., 2001; Schinagl et al., 1997; Wang et al., 2003), the observed ECM microscale elastic properties in the current study decreased with depth in all three tested directions. These observations may be related to the fact that AFM measures highly localized mechanical properties that may be influenced by the molecular composition of the tissue. During AFM microindentation, the effects of interstitial fluid pressurization are minimal, with an estimated relaxation time constant of 30 – 60 milliseconds based on moduli presented in our study (Park et al., 2009). As a result, fluid load support during localized indentation is minimal, approximately 10% based on the Peclet number (Bonnevie et al., 2012). This suggests that elastic moduli measured in our study reflect the intrinsic properties of the solid matrix. The molecular composition of the cartilage ECM varies with depth from the articular surface; collagen content is highest in the superficial zone and decreases with depth, while PG content follows an inverse trend, being lowest in the superficial zone and highest in the deep zone (Muir et al., 1970; Venn and Maroudas, 1977). It has been shown previously that the in situ nanoscale elastic modulus of PGs is an order of magnitude softer than that of collagen fibers (Loparic et al., 2010). The lowest moduli were observed in the deep zone, where PG content is highest and collagen content is lowest. The highest moduli were found in the superficial zone, where PG content is lowest and collagen fiber content is highest. As a result, the apparent softening of ECM properties with depth observed in the present work may be due in part to these depth-dependent variations in ECM composition.
AFM-based stiffness mapping allows for direct evaluation of PCM mechanical properties with minimal disruption of native matrix integration and a model framework for evaluating depth and directional dependence of PCM properties. Consistent with previous micropipette aspiration (Alexopoulos et al., 2003; Alexopoulos et al., 2005; Guilak et al., 2005) and AFM (Darling et al., 2010; Wilusz et al., in press) studies, PCM microscale elastic moduli exhibited zonal uniformity with depth. Within each zone, PCM microscale elastic moduli exhibited no directional dependence, reflecting its mesh-like capsule architecture. However, when pooled across the three zones, PCM moduli were statistically higher parallel to the split-line orientation (1-dir) as compared to the other two directions. This effect appears to be dominated by the superficial and middle zones where 1-dir moduli tended to be greater than those measured in the 2- and 3-directions. Previous studies have shown that PCM morphology reflects the local collagen fiber orientation in the ECM (Youn et al., 2006). In regions closer to the articular surface where the PCM is thinner (Youn et al., 2006), it is possible that local ECM collagen II fiber orientation in the plane of split-line orientation (Jeffery et al., 1991) contributes to subtle, but measurable, alignment of collagen VI microfilaments or other molecular components in the PCM. While picrosirius red staining is useful for visualizing fibrillar collagens like type I, II, III (Junqueira et al., 1979), there is little evidence suggesting that type VI collagen microfilaments can be visualized with this stain. In addition, an edge effect was found to be associated with the circular cell-sized voids in stained sections. As a result, we were unable to confidently evaluate type II collagen alignment within our 1 μm PCM region using this method.
In the current study, the PCM was defined as the region extending 1 μm radially from the edge of each cell-sized void. PCM thickness is generally greater than 2 μm, but has been shown to vary locally around single chondrocytes (Hunziker et al., 1997) as well as with depth through the cartilage zones (Youn et al., 2006). As a result, the pre-defined 1 μm region may under-estimate the actual extent of the PCM. There are limitations in lateral resolution when using micrometer-sized indenters for AFM stiffness mapping of soft substrates due to the size of the contact area during indentation (Radmacher et al., 1995). The contact radius for spherical probes scales with tip radius and indentation depth. Using a single force trigger of 200 nN to evaluate both the PCM and ECM leads to differences in contact radii between the two regions. PCM regions exhibit lower elastic moduli and therefore experience larger indentations than the adjacent ECM for the same applied force. As a result, contact radii in the PCM (1.8 – 2.0 μm) are larger than contact radii in the ECM (1.3 – 1.5 μm). Contact with adjacent ECM regions during indentation may have contributed the observed anisotropy in PCM mechanical properties and to stiffening of PCM moduli. The pre-defined 1 μm region was selected in an attempt to minimize these effects. Use of smaller radius indenters would improve lateral resolution but may result in moduli that do not reflect macroscale measurements (Stolz et al., 2004). Alternatively, using a biochemical definition of the PCM, such as immunofluorescence for type VI collagen (Poole et al., 1992; Poole et al., 1988; Wilusz et al., in press), would allow for a more complete characterization of spatial variations in anisotropy within the chondrocyte microenvironment.
In summary, our study provides new evidence for mechanical inhomogeneity and anisotropy at the microscale in articular cartilage. By demonstrating distinct depth-dependent anisotropy in ECM microscale elastic moduli, our results provide further support for local collagen fiber orientation and matrix composition as defining factors in cartilage mechanical behavior. In addition, our findings provide a new insight into the micromechanical environment of the chondrocyte, demonstrating zonal uniformity and mechanical isotropy of PCM elastic moduli despite the nonuniformity and anisotropy of the ECM. This detailed characterization of the cell microenvironment within each zone can be applied to theoretical models of cell-PCM-ECM interactions (Guilak and Mow, 2000; Kim et al., 2008; Korhonen et al., 2008; Wu and Herzog, 2002) to further our understanding of the specific mechanical stresses experience by the chondrocyte in health and disease.
Acknowledgments
We would like to thank Dr. Chris Gilchrist and Dr. Holly Leddy for their assistance with the picrosirius red staining and polarized light microscopy. This work was supported in part by a Duke University Pratt School of Engineering Undergraduate Research Fellowship (MAM), a National Science Foundation Graduate Research Fellowship (REW), and National Institutes of Health grants AG15768, AR50245, AR48182, AR48852.
Footnotes
Conflict of Interest Statement
The authors, Morgan A. McLeod, Rebecca E. Wilusz, and Farshid Guilak, have no conflicts of interest to declare.
Publisher's Disclaimer: This is a PDF file of an unedited manuscript that has been accepted for publication. As a service to our customers we are providing this early version of the manuscript. The manuscript will undergo copyediting, typesetting, and review of the resulting proof before it is published in its final citable form. Please note that during the production process errors may be discovered which could affect the content, and all legal disclaimers that apply to the journal pertain.
References
- Alexopoulos LG, Haider MA, Vail TP, Guilak F. Alterations in the mechanical properties of the human chondrocyte pericellular matrix with osteoarthritis. J Biomech Eng. 2003;125:323–333. doi: 10.1115/1.1579047. [DOI] [PubMed] [Google Scholar]
- Alexopoulos LG, Williams GM, Upton ML, Setton LA, Guilak F. Osteoarthritic changes in the biphasic mechanical properties of the chondrocyte pericellular matrix in articular cartilage. J Biomech. 2005;38:509–517. doi: 10.1016/j.jbiomech.2004.04.012. [DOI] [PubMed] [Google Scholar]
- Alexopoulos LG, Youn I, Bonaldo P, Guilak F. Developmental and osteoarthritic changes in Col6a1-knockout mice: biomechanics of type VI collagen in the cartilage pericellular matrix. Arthritis Rheum. 2009;60:771–779. doi: 10.1002/art.24293. [DOI] [PMC free article] [PubMed] [Google Scholar]
- Bachrach NM, Mow VC, Guilak F. Incompressibility of the solid matrix of articular cartilage under high hydrostatic pressures. J Biomech. 1998;31:445–451. doi: 10.1016/s0021-9290(98)00035-9. [DOI] [PubMed] [Google Scholar]
- Below S, Arnoczky SP, Dodds J, Kooima C, Walter N. The split-line pattern of the distal femur: A consideration in the orientation of autologous cartilage grafts. Arthroscopy. 2002;18:613–617. doi: 10.1053/jars.2002.29877. [DOI] [PubMed] [Google Scholar]
- Bonnevie ED, Baro VJ, Wang L, Burris DL. Fluid load support during localized indentation of cartilage with a spherical probe. J Biomech. 2012;45:1036–1041. doi: 10.1016/j.jbiomech.2011.12.019. [DOI] [PMC free article] [PubMed] [Google Scholar]
- Chahine NO, Wang CC, Hung CT, Ateshian GA. Anisotropic strain-dependent material properties of bovine articular cartilage in the transitional range from tension to compression. J Biomech. 2004;37:1251–1261. doi: 10.1016/j.jbiomech.2003.12.008. [DOI] [PMC free article] [PubMed] [Google Scholar]
- Chen SS, Falcovitz YH, Schneiderman R, Maroudas A, Sah RL. Depth-dependent compressive properties of normal aged human femoral head articular cartilage: relationship to fixed charge density. Osteoarthritis Cartilage. 2001;9:561–569. doi: 10.1053/joca.2001.0424. [DOI] [PubMed] [Google Scholar]
- Choi JB, Youn I, Cao L, Leddy HA, Gilchrist CL, Setton LA, Guilak F. Zonal changes in the three-dimensional morphology of the chondron under compression: the relationship among cellular, pericellular, and extracellular deformation in articular cartilage. J Biomech. 2007;40:2596–2603. doi: 10.1016/j.jbiomech.2007.01.009. [DOI] [PMC free article] [PubMed] [Google Scholar]
- Darling EM, Wilusz RE, Bolognesi MP, Zauscher S, Guilak F. Spatial mapping of the biomechanical properties of the pericellular matrix of articular cartilage measured in situ via atomic force microscopy. Biophys J. 2010;98:2848–2856. doi: 10.1016/j.bpj.2010.03.037. [DOI] [PMC free article] [PubMed] [Google Scholar]
- Darling EM, Zauscher S, Guilak F. Viscoelastic properties of zonal articular chondrocytes measured by atomic force microscopy. Osteoarthritis Cartilage. 2006;14:571–579. doi: 10.1016/j.joca.2005.12.003. [DOI] [PubMed] [Google Scholar]
- Guilak F. Biomechanical factors in osteoarthritis. Best Pract Res Clin Rheumatol. 2011;25:815–823. doi: 10.1016/j.berh.2011.11.013. [DOI] [PMC free article] [PubMed] [Google Scholar]
- Guilak F, Alexopoulos LG, Haider MA, Ting-Beall HP, Setton LA. Zonal uniformity in mechanical properties of the chondrocyte pericellular matrix: micropipette aspiration of canine chondrons isolated by cartilage homogenization. Ann Biomed Eng. 2005;33:1312–1318. doi: 10.1007/s10439-005-4479-7. [DOI] [PubMed] [Google Scholar]
- Guilak F, Mow VC. The mechanical environment of the chondrocyte: a biphasic finite element model of cell-matrix interactions in articular cartilage. J Biomech. 2000;33:1663–1673. [PubMed] [Google Scholar]
- Guilak F, Ratcliffe A, Mow VC. Chondrocyte deformation and local tissue strain in articular cartilage: a confocal microscopy study. J Orthop Res. 1995;13:410–421. doi: 10.1002/jor.1100130315. [DOI] [PubMed] [Google Scholar]
- Guo SL, Akhremitchev BB. Packing density and structural heterogeneity of insulin amyloid fibrils measured by AFM nanoindentation. Biomacromolecules. 2006;7:1630–1636. doi: 10.1021/bm0600724. [DOI] [PubMed] [Google Scholar]
- Huang CY, Stankiewicz A, Ateshian GA, Mow VC. Anisotropy, inhomogeneity, and tension-compression nonlinearity of human glenohumeral cartilage in finite deformation. J Biomech. 2005;38:799–809. doi: 10.1016/j.jbiomech.2004.05.006. [DOI] [PMC free article] [PubMed] [Google Scholar]
- Hunziker EB, Michel M, Studer D. Ultrastructure of adult human articular cartilage matrix after cryotechnical processing. Microsc Res Tech. 1997;37:271–284. doi: 10.1002/(SICI)1097-0029(19970515)37:4<271::AID-JEMT3>3.0.CO;2-O. [DOI] [PubMed] [Google Scholar]
- Hunziker EB, Quinn TM, Hauselmann HJ. Quantitative structural organization of normal adult human articular cartilage. Osteoarthritis Cartilage. 2002;10:564–572. doi: 10.1053/joca.2002.0814. [DOI] [PubMed] [Google Scholar]
- Hwang WS, Li B, Jin LH, Ngo K, Schachar NS, Hughes GN. Collagen fibril structure of normal, aging, and osteoarthritic cartilage. J Pathol. 1992;167:425–433. doi: 10.1002/path.1711670413. [DOI] [PubMed] [Google Scholar]
- Jeffery AK, Blunn GW, Archer CW, Bentley G. Three-dimensional collagen architecture in bovine articular cartilage. J Bone Joint Surg Br. 1991;73:795–801. doi: 10.1302/0301-620X.73B5.1894669. [DOI] [PubMed] [Google Scholar]
- Julkunen P, Wilson W, Jurvelin JS, Korhonen RK. Composition of the pericellular matrix modulates the deformation behaviour of chondrocytes in articular cartilage under static loading. Med Biol Eng Comput. 2009;47:1281–1290. doi: 10.1007/s11517-009-0547-8. [DOI] [PMC free article] [PubMed] [Google Scholar]
- Junqueira LC, Bignolas G, Brentani RR. Picrosirius staining plus polarization microscopy, a specific method for collagen detection in tissue sections. Histochem J. 1979;11:447–455. doi: 10.1007/BF01002772. [DOI] [PubMed] [Google Scholar]
- Jurvelin JS, Buschmann MD, Hunziker EB. Optical and mechanical determination of Poisson’s ratio of adult bovine humeral articular cartilage. J Biomech. 1997;30:235–241. doi: 10.1016/s0021-9290(96)00133-9. [DOI] [PubMed] [Google Scholar]
- Jurvelin JS, Buschmann MD, Hunziker EB. Mechanical anisotropy of the human knee articular cartilage in compression. Proc Inst Mech Eng H. 2003;217:215–219. doi: 10.1243/095441103765212712. [DOI] [PubMed] [Google Scholar]
- Kempson GE, Muir H, Pollard C, Tuke M. The tensile properties of the cartilage of human femoral condyles related to the content of collagen and glycosaminoglycans. Biochim Biophys Acta. 1973;297:456–472. doi: 10.1016/0304-4165(73)90093-7. [DOI] [PubMed] [Google Scholar]
- Kim E, Guilak F, Haider MA. The dynamic mechanical environment of the chondrocyte: a biphasic finite element model of cell-matrix interactions under cyclic compressive loading. J Biomech Eng. 2008;130:061009. doi: 10.1115/1.2978991. [DOI] [PMC free article] [PubMed] [Google Scholar]
- Kim E, Guilak F, Haider MA. An axisymmetric boundary element model for determination of articular cartilage pericellular matrix properties in situ via inverse analysis of chondron deformation. J Biomech Eng. 2010;132:031011. doi: 10.1115/1.4000938. [DOI] [PMC free article] [PubMed] [Google Scholar]
- Korhonen RK, Julkunen P, Rieppo J, Lappalainen R, Konttinen YT, Jurvelin JS. Collagen network of articular cartilage modulates fluid flow and mechanical stresses in chondrocyte. Biomech Model Mechanobiol. 2006;5:150–159. doi: 10.1007/s10237-006-0021-6. [DOI] [PubMed] [Google Scholar]
- Korhonen RK, Julkunen P, Wilson W, Herzog W. Importance of collagen orientation and depth-dependent fixed charge densities of cartilage on mechanical behavior of chondrocytes. J Biomech Eng. 2008;130:021003. doi: 10.1115/1.2898725. [DOI] [PubMed] [Google Scholar]
- Lai WM, Sun DD, Ateshian GA, Guo XE, Mow VC. Electrical signals for chondrocytes in cartilage. Biorheology. 2002;39:39–45. [PubMed] [Google Scholar]
- Loparic M, Wirz D, Daniels AU, Raiteri R, Vanlandingham MR, Guex G, Martin I, Aebi U, Stolz M. Micro- and nanomechanical analysis of articular cartilage by indentation-type atomic force microscopy: validation with a gel-microfiber composite. Biophys J. 2010;98:2731–2740. doi: 10.1016/j.bpj.2010.02.013. [DOI] [PMC free article] [PubMed] [Google Scholar]
- Meachim G, Denham D, Emery IH, Wilkinson PH. Collagen alignments and artificial splits at the surface of human articular cartilage. J Anat. 1974;118:101–118. [PMC free article] [PubMed] [Google Scholar]
- Mizrahi J, Maroudas A, Lanir Y, Ziv I, Webber TJ. The “instantaneous” deformation of cartilage: effects of collagen fiber orientation and osmotic stress. Biorheology. 1986;23:311–330. doi: 10.3233/bir-1986-23402. [DOI] [PubMed] [Google Scholar]
- Mow VC, Bachrach NM, Setton LA, Guilak F. Stress, Strain, Pressure, and Flow Fields in Articular Cartilage and Chondrocytes. In: Mow VC, Guilak F, Tran-Son-Tay R, Hochmuth RM, editors. Cell Mechanics and Cellular Engineering. Springer-Verlag; New York: 1994. pp. 345–379. [Google Scholar]
- Mow VC, Guo XE. Mechano-electrochemical properties of articular cartilage: their inhomogeneities and anisotropies. Annu Rev Biomed Eng. 2002;4:175–209. doi: 10.1146/annurev.bioeng.4.110701.120309. [DOI] [PubMed] [Google Scholar]
- Mow VC, Ratcliffe A, Poole AR. Cartilage and diarthrodial joints as paradigms for hierarchical materials and structures. Biomaterials. 1992;13:67–97. doi: 10.1016/0142-9612(92)90001-5. [DOI] [PubMed] [Google Scholar]
- Muir H, Bullough P, Maroudas A. The distribution of collagen in human articular cartilage with some of its physiological implications. J Bone Joint Surg Br. 1970;52:554–563. [PubMed] [Google Scholar]
- Park S, Costa K, Ateshian G, Hong K. Mechanical properties of bovine articular cartilage under microscale indentation loading from atomic force microscopy. Proceedings of the Institution of Mechanical Engineers, Part H: Journal of Engineering in Medicine. 2009;223:339–347. doi: 10.1243/09544119JEIM516. [DOI] [PubMed] [Google Scholar]
- Poole CA, Ayad S, Gilbert RT. Chondrons from articular cartilage. V. Immunohistochemical evaluation of type VI collagen organisation in isolated chondrons by light, confocal and electron microscopy. J Cell Sci. 1992;103 (Pt 4):1101–1110. doi: 10.1242/jcs.103.4.1101. [DOI] [PubMed] [Google Scholar]
- Poole CA, Ayad S, Schofield JR. Chondrons from articular cartilage: I. Immunolocalization of type VI collagen in the pericellular capsule of isolated canine tibial chondrons. J Cell Sci. 1988;90 (Pt 4):635–643. doi: 10.1242/jcs.90.4.635. [DOI] [PubMed] [Google Scholar]
- Poole CA, Flint MH, Beaumont BW. Morphological and functional interrelationships of articular cartilage matrices. J Anat. 1984;138 (Pt 1):113–138. [PMC free article] [PubMed] [Google Scholar]
- Poole CA, Flint MH, Beaumont BW. Chondrons in cartilage: ultrastructural analysis of the pericellular microenvironment in adult human articular cartilages. J Orthop Res. 1987;5:509–522. doi: 10.1002/jor.1100050406. [DOI] [PubMed] [Google Scholar]
- Poole CA, Gilbert RT, Herbage D, Hartmann DJ. Immunolocalization of type IX collagen in normal and spontaneously osteoarthritic canine tibial cartilage and isolated chondrons. Osteoarthritis Cartilage. 1997;5:191–204. doi: 10.1016/s1063-4584(97)80014-3. [DOI] [PubMed] [Google Scholar]
- Radmacher M, Fritz M, Hansma PK. Imaging soft samples with the atomic force microscope: gelatin in water and propanol. Biophys J. 1995;69:264–270. doi: 10.1016/S0006-3495(95)79897-6. [DOI] [PMC free article] [PubMed] [Google Scholar]
- Schinagl RM, Gurskis D, Chen AC, Sah RL. Depth-dependent confined compression modulus of full-thickness bovine articular cartilage. J Orthop Res. 1997;15:499–506. doi: 10.1002/jor.1100150404. [DOI] [PubMed] [Google Scholar]
- Stolz M, Raiteri R, Daniels AU, VanLandingham MR, Baschong W, Aebi U. Dynamic elastic modulus of porcine articular cartilage determined at two different levels of tissue organization by indentation-type atomic force microscopy. Biophys J. 2004;86:3269–3283. doi: 10.1016/S0006-3495(04)74375-1. [DOI] [PMC free article] [PubMed] [Google Scholar]
- Thomopoulos S, Williams GR, Gimbel JA, Favata M, Soslowsky LJ. Variation of biomechanical, structural, and compositional properties along the tendon to bone insertion site. J Orthop Res. 2003;21:413–419. doi: 10.1016/S0736-0266(03)00057-3. [DOI] [PubMed] [Google Scholar]
- Tomkoria S, Patel RV, Mao JJ. Heterogeneous nanomechanical properties of superficial and zonal regions of articular cartilage of the rabbit proximal radius condyle by atomic force microscopy. Med Eng Phys. 2004;26:815–822. doi: 10.1016/j.medengphy.2004.07.006. [DOI] [PubMed] [Google Scholar]
- Vanden Berg-Foels WS, Scipioni L, Huynh C, Wen X. Helium ion microscopy for high-resolution visualization of the articular cartilage collagen network. Journal of Microscopy. 2012;246:168–176. doi: 10.1111/j.1365-2818.2012.03606.x. [DOI] [PubMed] [Google Scholar]
- Venn M, Maroudas A. Chemical composition and swelling of normal and osteoarthrotic femoral head cartilage. I. Chemical composition. Ann Rheum Dis. 1977;36:121–129. doi: 10.1136/ard.36.2.121. [DOI] [PMC free article] [PubMed] [Google Scholar]
- Wang CC, Chahine NO, Hung CT, Ateshian GA. Optical determination of anisotropic material properties of bovine articular cartilage in compression. J Biomech. 2003;36:339–353. doi: 10.1016/s0021-9290(02)00417-7. [DOI] [PMC free article] [PubMed] [Google Scholar]
- Wang CC, Deng JM, Ateshian GA, Hung CT. An automated approach for direct measurement of two-dimensional strain distributions within articular cartilage under unconfined compression. J Biomech Eng. 2002a;124:557–567. doi: 10.1115/1.1503795. [DOI] [PubMed] [Google Scholar]
- Wang CC, Guo XE, Sun D, Mow VC, Ateshian GA, Hung CT. The functional environment of chondrocytes within cartilage subjected to compressive loading: a theoretical and experimental approach. Biorheology. 2002b;39:11–25. [PubMed] [Google Scholar]
- Wang QG, El Haj AJ, Kuiper NJ. Glycosaminoglycans in the pericellular matrix of chondrons and chondrocytes. J Anat. 2008;213:266–273. doi: 10.1111/j.1469-7580.2008.00942.x. [DOI] [PMC free article] [PubMed] [Google Scholar]
- Wiberg C, Hedbom E, Khairullina A, Lamande SR, Oldberg A, Timpl R, Morgelin M, Heinegard D. Biglycan and decorin bind close to the n-terminal region of the collagen VI triple helix. J Biol Chem. 2001;276:18947–18952. doi: 10.1074/jbc.M100625200. [DOI] [PubMed] [Google Scholar]
- Wiberg C, Heinegard D, Wenglen C, Timpl R, Morgelin M. Biglycan organizes collagen VI into hexagonal-like networks resembling tissue structures. J Biol Chem. 2002;277:49120–49126. doi: 10.1074/jbc.M206891200. [DOI] [PubMed] [Google Scholar]
- Wiberg C, Klatt AR, Wagener R, Paulsson M, Bateman JF, Heinegard D, Morgelin M. Complexes of matrilin-1 and biglycan or decorin connect collagen VI microfibrils to both collagen II and aggrecan. J Biol Chem. 2003;278:37698–37704. doi: 10.1074/jbc.M304638200. [DOI] [PubMed] [Google Scholar]
- Williams GM, Chan EF, Temple-Wong MM, Bae WC, Masuda K, Bugbee WD, Sah RL. Shape, loading, and motion in the bioengineering design, fabrication, and testing of personalized synovial joints. J Biomech. 2010;43:156–165. doi: 10.1016/j.jbiomech.2009.09.021. [DOI] [PMC free article] [PubMed] [Google Scholar]
- Wilusz RE, DeFrate LE, Guilak F. Immunofluorescence-guided atomic force microscopy to measure the micromechanical properties of the pericellular matrix of porcine articular cartilage. J R Soc Interface. doi: 10.1098/rsif.2012.0314. in press. [DOI] [PMC free article] [PubMed] [Google Scholar]
- Wong BL, Sah RL. Mechanical asymmetry during articulation of tibial and femoral cartilages: local and overall compressive and shear deformation and properties. J Biomech. 2010;43:1689–1695. doi: 10.1016/j.jbiomech.2010.02.035. [DOI] [PMC free article] [PubMed] [Google Scholar]
- Wu JZ, Herzog W. Elastic anisotropy of articular cartilage is associated with the microstructures of collagen fibers and chondrocytes. Journal of Biomechanics. 2002;35:931–942. doi: 10.1016/s0021-9290(02)00050-7. [DOI] [PubMed] [Google Scholar]
- Yin JH, Xia Y, Ramakrishnan N. Depth-dependent Anisotropy of Proteoglycan in Articular Cartilage by Fourier Transform Infrared Imaging. Vib Spectrosc. 2011;57:338–341. doi: 10.1016/j.vibspec.2011.08.005. [DOI] [PMC free article] [PubMed] [Google Scholar]
- Youn I, Choi JB, Cao L, Setton LA, Guilak F. Zonal variations in the three-dimensional morphology of the chondron measured in situ using confocal microscopy. Osteoarthritis Cartilage. 2006;14:889–897. doi: 10.1016/j.joca.2006.02.017. [DOI] [PubMed] [Google Scholar]