

Abstract
Many bacteria on earth exist in surface-attached communities known as biofilms. These films are responsible for manifold problems, including hospital-acquired infections and biofouling, but they can also be beneficial. Biofilm growth depends on the transport of nutrients and waste, for which diffusion is thought to be the main source of transport. However, diffusion is ineffective for transport over large distances and thus should limit growth. Nevertheless, biofilms can grow to be very large. Here we report the presence of a remarkable network of well-defined channels that form in wild-type Bacillus subtilis biofilms and provide a system for enhanced transport. We observe that these channels have high permeability to liquid flow and facilitate the transport of liquid through the biofilm. In addition, we find that spatial variations in evaporative flux from the surface of these biofilms provide a driving force for the flow of liquid in the channels. These channels offer a remarkably simple system for liquid transport, and their discovery provides insight into the physiology and growth of biofilms.
Keywords: advection, rugose, adaptation, multicellularity, wrinkles
Biofilms are dense multicellular communities of bacteria embedded in a self-produced extracellular matrix (1–3) that form on surfaces (4, 5). Biofilms are widespread in nature and implicated in many acute medical (6–8) and industrial (9) problems but can also be useful, for example, in waste remediation (10), plant protection (11), and microbial fuel cells (12). Biofilm growth and physiology rely on the transport of nutrients, waste, and signaling molecules, all of which are dissolved in water. For example, bacteria in biofilms require nutrients for their survival and growth, which they obtain from their environment, but biofilms often experience spatial variations in nutrient uptake, which can lead to regions of nutrient depletion. To ameliorate this, nutrients must be transported from regions of high concentration to regions of low concentration. Diffusion is the primary mechanism of molecular transport in biofilms. However, most nutrients are consumed while diffusing over distances greater than several hundred micrometers, for which diffusion is ineffective. Thus, biofilms would likely benefit from more efficient mechanisms of transport, such as liquid advection; however, liquid flows are strongly mediated by the structure of the biofilm (13–15), and little is known regarding how biofilm structure can enhance liquid transport.
Here we report that wild-type Bacillus subtilis biofilms grown on the surface of agar plates form a network of channels that have low resistance to liquid flow, thereby facilitating the transport of liquid through the biofilm. Moreover, spatial variation in the evaporative flux from the surface of these biofilms provides the driving force for the enhanced flow of liquid through these channels. These channels provide a remarkably simple system for enhanced liquid transport, and their discovery may provide insight into the physiology, growth, and morphology of biofilms.
Bacillus subtilis is a model bacterium for investigating biofilm formation (16–18). B. subtilis biofilms are commonly grown in the laboratory on the surface of agar plates containing water and nutrients. The agar gel is first inoculated with a liquid drop containing planktonic bacteria, which dries to form a circular footprint several millimeters in diameter. As the bacteria grow and divide, the biofilm increases in height, until it reaches a thickness of several hundred micrometers (19), and vertical growth slows dramatically. This limitation in thickness is consistent with diffusion-limited transport of nutrients (19). B. subtilis biofilms gain access to more nutrients by spreading horizontally (19, 20), as shown by the series of photographs in Fig. 1A (Materials and Methods). Nevertheless, as the colony spreads, most of the nutrients are consumed by cells on its periphery; hence, bacteria in the center of the biofilm become deprived of nutrients, because diffusion through the agar substrate is too slow to meet their demands. This suggests that B. subtilis biofilms, faced with nutrient depletion, may have developed mechanisms to facilitate nutrient transport.
Fig. 1.

Characterization of channels within B. subtilis biofilms. (A) Biofilm growing on the surface of an agar gel containing water and nutrients. The biofilm increases in height to hundreds of micrometers, spreads to reach a diameter of several centimeters, and forms macroscopic wrinkles. (B) Series of microscopy images of a region near the center of the biofilm. Injection of an aqueous dye reveals a network of channels beneath the wrinkles. (C) Microscopy image of a biofilm after injection of an aqueous solution containing a mixture of fluorescent beads reveals the connectivity of the channels. (D) SEM image of a wrinkle cross-section. (E) SEM image of the underside of a biofilm reveals well-defined channels. (Inset) SEM image of the microstructure of the biofilm. (F) Side view of a biofilm wrinkle reconstructed from profiles of plastic molds of the upper and lower surfaces of the biofilm and the surface of the agar.
Water is the primary solvent for nutrients in bacterial colonies, so its transport is essential to the delivery of nutrients. Diffusion is believed to be the dominant transport mechanism in biofilms (21). Any other potential transport mechanism must presumably involve advection and is therefore strongly mediated by the permeability of the biofilm to liquid flow; thus, the architecture of the biofilm is important for governing liquid transport through the biofilm (13–15). The architecture of mature wild-type B. subtilis biofilms (strain NCIB 3610) grown on agar exhibits a characteristic, wrinkled structure (Fig. 1A, 60 h). Macroscopic wrinkles appear after approximately 1 d of growth and, with continued growth, spread to form a complex network of branching wrinkles across the surface of the biofilm. Although the mechanism by which wrinkles form is not entirely clear, the shape of a biofilm wrinkle is reminiscent of a film that is folded out of plane; in fact, recent work has shown that mechanical stress generated during growth is relieved through buckling of the biofilm, which is triggered by localized cell death (22). The complex topography of these biofilms hints at the possible presence of structural heterogeneities within the biofilm, and these may affect liquid flow.
Results and Discussion
To probe the impact of the wrinkles on liquid flow, we image a B. subtilis biofilm using confocal microscopy and inject water containing a fluorescent dye into different regions of the biofilm (Materials and Methods). Flat regions of the biofilm are highly resistant to flow, and liquid cannot be driven into the biofilm without fracturing the film or delaminating the biofilm from the agar substrate. By contrast, when liquid is injected into a wrinkle, the result is striking: The solution flows rapidly into the space directly beneath the wrinkle, following a complex network of channels, which must have low resistance to liquid flow (Fig. 1B). These channels are filled with liquid: When a small volume of colloidal particles is injected into a channel, the particles travel along the channel, and their motion is confined by the channel walls. To explore the connectivity of this channel network, we inject an aqueous solution containing fluorescent colloidal particles into a wrinkle near the center of the biofilm (Materials and Methods). The resulting map of the channel network illustrates that the channels are highly interconnected (Fig. 1C). Intriguingly, network connectivity near the center of the biofilm appears to be highest, with multiple connections between points, whereas regions far from the center are branched, with fewer connections between points.
The ceiling and walls of the channels are clearly formed by the biofilm, but resolving the internal structure of a channel using optical microscopy is difficult; the film is thick [biofilm thickness (hb) > 0.1 mm], and light scattering limits the depth of imaging into the biofilm to tens of micrometers. Therefore, to explore the structure of the channels we remove the biofilm from the agar substrate and use scanning electron microscopy (SEM) to image the biofilm (Materials and Methods). Images of wrinkle cross-sections confirm the presence of well-defined channels beneath the biofilm (Fig. 1D); moreover, the SEM images reveal an open framework on the underside of the biofilm, indicating that the floor of the channel is formed by the agar substrate (Fig. 1E). To replicate the side profile of a single channel, we use a cross-linkable resin to create casts (23, 24) of the upper and lower surfaces of the biofilm and of the agar surface; we then use confocal microscopy to map the surfaces of the individual casts and reconstruct the surface profiles of three casts (Materials and Methods), as shown by the representative channel cross-section in Fig. 1F. For the cross-section shown, the channel height, hc, ≈ 0.1 mm and is approximately one-third of the biofilm thickness, hb ≈ 0.3 mm; however, both hc and hb vary widely throughout the biofilm (Fig. S1). To characterize the size distribution of channels in the network, we measure the maximum channel width at different points throughout the network and determine a mean channel width,  ≈ 91 ± 65 μm (Fig. S1).
Remarkably, we find that the pressure within the channels is reduced relative to atmospheric pressure: When a tapered glass capillary, partially filled with liquid, is inserted into a wrinkle, the liquid is spontaneously imbibed into the channel, and the pressure drop inside the channel overcomes the capillary pressure associated with the liquid-air meniscus in the glass capillary (Movie S1). To obtain an accurate measure of the pressure within the channel network, we image B. subtilis biofilms that contain channels that are open on one end (Fig. 2A). These water-filled channels are present in some biofilms and have an air–liquid interface at their open end (Fig. 2B). Here, the capillary pressure exerted by the interface at the end of the channel must be balanced by the pressure within the channel, so the curvature of the meniscus provides a measure of the reduced pressure of the liquid within the biofilm. We measure the average radius of curvature from multiple menisci to be a ≈ 65 ± 10 μm and estimate σ ≈ 30 mN/m (25); thus, the pressure drop is calculated to be ΔPc ≈ 0.9 kPa.
Fig. 2.
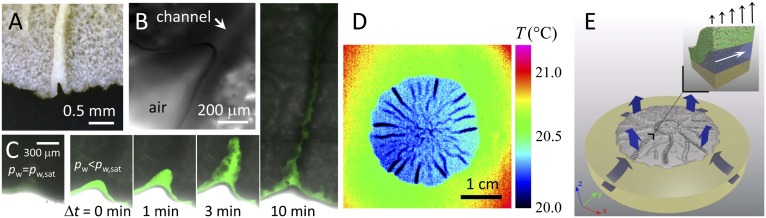
Reduced pressure in channels due to evaporation. (A) Photograph of an open channel. (B) Microscopy image of an air–water meniscus at the end of an open channel. (C) Series of microscopy images depicting the imbibition of fluorescent oil into an open channel. For conditions with no evaporation (pw = pw,sat), no imbibition occurs; when evaporation is induced (pw < pw,sat), the oil is imbibed far into the biofilm. (D) Infrared thermograph of a biofilm on agar exposed to ambient air with RH = 56% and T = 21.5 °C reveals spatial differences in evaporative flux. (E) Illustration of evaporation from the surface of the film (blue arrows) that drives liquid flow throughout the agar and the biofilm. (Inset) Liquid-filled channels with high permeability for liquid flow exist beneath the biofilm and facilitate the flow of liquid in the xy plane. A gradient in evaporative flux (black arrows) could drive liquid flow within the channel (white arrow).
The pressure of the water within the biofilm will also be reduced if there is evaporation from its surface, which must occur whenever a biofilm is exposed to air with an ambient water vapor pressure pw that is less than the saturated water vapor pressure pw,sat. Evaporation generates the pressure drop at the surface of the biofilm required to drive flow of water upward from the agar and through the biofilm. The magnitude of this pressure drop is diminished by the hydrodynamic resistance of the biofilm, and the pressure within the channel must be the pressure necessary to remove water from the agar at the flow rate imposed by evaporation. To determine this flow rate we measure the rate of weight loss from B. subtilis colonies of diameter d = 1.73 ± 0.05 cm and determine the evaporation rate to be 23.2 ± 0.5 μg/s (Fig. S2), which is close to that estimated for diffusion-limited evaporation (10 μg/s; SI Text); this corresponds to an average liquid velocity in the vertical direction of Vz ≈ 0.1 μm/s. The pressure drop, ΔPD, necessary to drive water at this velocity through an agar plate of thickness L = 0.5 cm can be calculated using Darcy’s law and the measured permeability of agar and is ∼1 kPa (SI Text), consistent with the value measured. The removal of water also results in compression of the agar; from a known bulk modulus we estimate this to be an order of magnitude less than the measured pressure (SI Text). An additional pressure drop is required to drive the liquid through the thickness of the biofilm itself. This can also be estimated using Darcy’s law, provided we know the permeability of the biofilm, which we obtain by measuring the pressure required to force water through a biofilm removed from the agar (SI Text). We find that the pressure drop is ∼1–2 kPa, which, intriguingly, is similar in magnitude to the pressure drop across the meniscus of the open channel.
To confirm the role of evaporation in setting the pressure within the channel, we prevent evaporation by setting the ambient pressure to be pw,sat, which causes the meniscus of the open channel to flatten. We then place a drop of silicone oil containing a green fluorescent dye near an open channel, allowing the drop to wet the meniscus. This has the effect of reducing the interfacial tension at the interface of the channel. When pw is decreased to induce evaporation, the meniscus not only becomes curved, but the oil is also drawn into the channel and travels deep into the biofilm, as shown in Fig. 2C. This result provides a clear demonstration that the reduced pressure within the channels is primarily due to evaporative flux (Fig. S3). To further explore the water flow induced by evaporation, we use an infrared camera to determine a temperature map of the surface in the vicinity of a biofilm. Any drop in surface temperature, relative to ambient temperature, is most likely due to evaporative cooling. There is a clear gradient in temperature of the surface of the agar approaching the biofilm, and an even lower temperature on the surface of the biofilm, as shown in Fig. 2D. This is consistent with flow of water from the agar into the biofilm, as shown by the arrows in Fig. 2E. Moreover, there are heterogeneities in evaporation rate across the surface of the biofilm; in particular, the evaporation at the surface of the wrinkles is highest, as shown by the dark blue lines in Fig. 2E. These spatial variations in evaporative flux result from the local curvature of the surface due to the wrinkles and are analogous to the spatial variations in evaporative flux present in evaporating liquid droplets responsible for the “coffee-ring” effect (26, 27).
Whereas evaporation drives the net flow of liquid in the vertical direction, perpendicular to the biofilm surface and the channel network, the enhancement of flow afforded by the high permeability of the channels will be greatest for horizontal flow, transverse to the biofilm. To investigate flow of liquid through the channel network, we introduce fluorescent particles into the channels and track their motion with confocal microscopy (Fig. 3A). We indeed observe horizontal flow of water in the channels, with velocities on the order of Vxy ≈ 10 μm/s (Movie S2). These flows propagate over millimeters in distance and occur throughout the channel network. To determine whether evaporation is the primary driving force for such flow, we monitor the flow within a single channel as a function of pw, which we control by covering the biofilm with a small dish (Fig. S4). When the biofilm is covered and allowed to equilibrate at pw = pw,sat, the flow velocity in the channel is negligible, as shown by the velocity profile in Fig. 3B. When the biofilm is then exposed to ambient air, flow rapidly recommences, as shown by the velocity map determined by particle imaging velocimetry (Fig. 3C). Flow continues until the biofilm is again covered and evaporation is suppressed. This effect can be repeated, as shown by the oscillations in the time trace of the average liquid velocity along the channel, plotted in Fig. 3D (Movie S3). The flows that we observe can transport water over macroscopic distances much faster than diffusion. For example, the time required for a molecule to diffuse a distance d is given by the diffusion time td ≈ d2/D. For d = 0.1 cm and a diffusion coefficient of D ≈ 10−5 cm2/s, td ≈ 103 s. By contrast, the time required for advective liquid transport is ta ≈ d/Vxy, for Vxy ≈ 10 μm/s and d = 0.1 cm is ta ≈ 102 s. This difference becomes more pronounced over larger distances, because td ∝ d2 and ta ∝ d. Thus, our measurements provide a clear demonstration that evaporative flux can drive liquid flows throughout the channel network over macroscopic distances much faster than diffusion. However, these flows are not driven directly by the evaporative flux. The pressure difference required to drive water at Vxy ≈ 10 μm/s through a cylindrical channel of width w = 100 μm and length L = 1 cm can be estimated by assuming Poiseuille flow and is ΔPxy ≈ 0.3 Pa (SI Text). This pressure drop is more than three orders of magnitude smaller than that required to drive the evaporation. Hence, the transverse flows must be driven by spatial variations in the evaporation rate. Such variations could arise from spatial heterogeneities in pore size (28, 29), local curvature, or even variations in air currents across the surface of the biofilm. Although our simple calculation of flow along a single channel likely provides the correct order of magnitude for ΔPxy, a complete understanding of the flow throughout a complex network would require a more sophisticated model for the network permeability.
Fig. 3.

Flow in channels driven by evaporation and correlation of evaporative flux with biofilm biomass. (A) Channel containing red fluorescent beads. (B) Velocity map of the liquid in the channel shows no net flow when the biofilm is covered (pw = pw,sat), and (C) directed flow when the biofilm is uncovered (pw < pw,sat). (D) Average velocity along the channel, vx, measured within white dashed line in A, as a function of time. Shaded regions indicate times when the biofilm is exposed to RH = 49%; unshaded regions correspond to time periods where the biofilm is covered with a small Petri dish and RH equilibrates at 100%. Black line guides the eye through a short break in the data. (E) Biofilms grown in low humidity exhibit greater biomass than those grown in high humidity. Total dry biomass mb from individual colonies grown for 60 h at 30 °C, plotted as a function of relative humidity. (Inset) Evaporative flux, Q from the surface of a biofilm and agar dish as a function of RH, measured by the total change in mass of the agar plates after 60 h. For both plots, the line is a linear fit through the data, n = 6, and error bars represent the SD.
The flow of liquid in channels will enhance the transport of nutrients and should thereby increase growth. To test this, we measure the total biomass of mature biofilms as a function of the evaporative flux experienced during growth. We control the rate of evaporation during biofilm growth by varying the relative humidity, RH = (pw/pw,sat)100% (Materials and Methods). As expected, we measure that the rate of evaporation is proportional to RH (Fig. 3E Inset). After 2.5 d of growth at fixed RH, we measure the total dry biomass per colony and find that the average colony biomass increases linearly with the evaporation rate (Fig. 3E).
B. subtilis biofilms grown on agar experience a life cycle that is characterized by several days of growth followed by cell death and gradual biofilm disassembly. Here we focus on the peak growth stage of the B. subtilis biofilm life cycle, when the channels can be conduits for enhanced transport of nutrients. However, the channels may remain important in later stages of the biofilm life cycle and may also enhance transport of substances such as waste or signaling molecules. Interestingly, we find that as the biofilm ages the structure of the channels evolves and they are internalized by the growth of bacteria on their floor. The evolution of the channel structure over 6 d is shown by the series of photographs and SEM images of channel cross-sections in Fig. 4. This structural evolution occurs throughout the entire network (Fig. S5). Our observation that the high permeability of the channel network is retained even in the late stages of biofilm growth suggests that they are physiologically relevant throughout the biofilm life cycle.
Fig. 4.
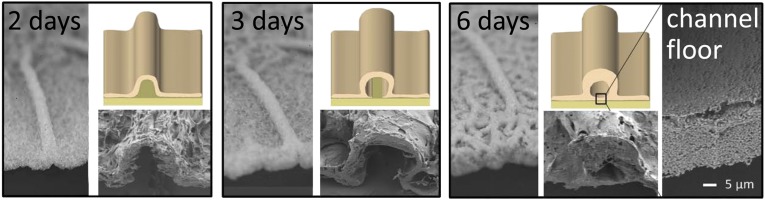
Structural evolution of the channels. Photographs, SEM images, and illustrations depict the structural evolution of a channel over time. By 6 d the biofilm has spread to cover the floor of the channel.
The presence of an extensive network of liquid-filled channels within B. subtilis biofilms suggests that these well-defined structures, with high permeability to liquid flow, enhance the transport of liquids. Whereas evaporation provides a driving force for liquid flow, planktonic bacteria or gradients in osmotic pressure could also drive such flow. An improved understanding of the physical mechanisms responsible for transport in bacterial biofilms is essential for our understanding of biofilm development and may provide insight into the prevention and control of biofilm growth. The role of the remarkable network of channels reported here must be incorporated in any new description of liquid transport in biofilms.
Materials and Methods
Biofilm Growth and Imaging.
Bacillus subtilis strain NCIB 3610 was used for all experiments. Biofilms were grown on 1.5 wt % agar plates containing MSgg media (30) and incubated at 30 °C and RH ≈ 95%, except for the set of controlled RH experiments, for ∼60 h. Biofilms were imaged using a 10× air objective on a Leica SP5 laser-scanning confocal microscope.
Injection and Imbibition of Liquids into the Biofilm.
Aqueous liquids containing fluorescent dye (rhodamine 6G, < 0.01 wt %) or fluorescent particles (carboxylate-modified, green fluorescent d ≈ 2 μm; yellow d ≈ 0.2 μm, <0.5 wt %; Invitrogen) were introduced into the biofilm channels using tapered, cylindrical glass capillaries (i.d. = 0.58 mm, o.d. = 1.0 mm, taper diameter ≈ 40 μm; World Precision Instruments). Capillaries were tapered using a micropipette puller (P-97; Sutter Instruments). Capillary insertion into a biofilm wrinkle was performed with micromanipulator mounted on the confocal microscope. Liquids were injected by driving liquid through the capillary using a syringe pump (Harvard Apparatus) and imbibed by inserted partially filled capillaries into channels.
SEM Imaging.
Mature biofilms were placed in a freezer at −80 °C for 12–24 h before being placed in a freeze-dryer. Freeze-dried biofilms were removed from their agar substrates, cut using a razor blade, sputter-coated with a ∼10-nm layer of Pt/Pd (HR 208; Cressington), and imaged with an Ultra Plus Field Emission Scanning Electron Microscope (Carl Zeiss).
Corrosion Cast Experiments.
Molds of the upper and lower surfaces of the biofilm and the top surface of the agar were created using a crosslinkable resin (Mercox II; Ladd Research). The components of the resin were mixed according to instructions and then poured onto the surface of a mature biofilm that had been grown in a small agar culture dish (d = 5 cm) according to the conditions outlined above. The resin wet the surface of the biofilm and the agar and spread to fill the dish, forming a layer ∼0.5 cm thick. The resin was allowed to cure for ∼20 min and then lifted off of the dish. The biofilm remained adhered to the resin block and was peeled off the agar when the resin was removed, exposing the underside of the biofilm and the surface of the agar beneath the footprint of the biofilm. Casts of the lower surface of the biofilm were created in the same manner as described above. The biofilm left behind a shallow, but detailed, imprint on the agar, so the bottom of the channel could not be assumed to be completely flat; for this reason, we created a cast of the agar surface as well.
Each cast was gently cleaned with soap and water, soaked in an aqueous NaOH solution (5 wt %) for 12 h, and again gently cleaned with soap and water. A channel cross-section was replicated by imaging each cast individually using the confocal microscope in reflection mode. In this mode, backscattered laser light is used to create a map of the cast surface. The individual surface maps were aligned relative to one another in xy and z using fiduciary marks. A side profile (xz) of a single channel was then constructed from the surface profiles using ImageJ software.
Channel molds were also created by imbibing the premixed resin directly into a single channel. The resin was first mixed and imbibed into a tapered glass capillary, and the capillary was inserted manually into a biofilm wrinkle. This was done rapidly, before significant cross-linking had occurred. The resin was allowed to cure for ∼20 min, and the biofilm was dissolved away by soaking the intact biofilm and agar in an aqueous NaOH solution (5 wt %) for 12 h. The channel cast was then rinsed with distilled water and imaged with confocal microscopy. To aid in imaging the resin casts, a small amount of Nile Red was added to the premixed resin before imbibition into a channel. Three-dimensional reconstructions of channel sections were created by collecting z stacks of each section and then reconstructing the stacks in ImageJ.
Evaporation Rate Measurements.
Evaporation rates from biofilms and agar slabs were measured by growing wild-type biofilms as detailed above then punching out cylindrical slabs of the agar and biofilms on top of agar using a cylindrical punch with an inner diameter d = 1.73 ± 0.05 cm. Each slab was placed on a glass slide and the outer wall of each agar cylinder coated with vacuum grease to prevent evaporation from the sides of the slab. In this manner, only the upper surface of the slab was allowed to evaporate. The mass of each slab was then measured with an analytical balance as a function of time to determine the evaporation rate. Measurements were done in triplicate. The evaporation data are plotted in Fig. S2. Relative humidity was measured with a digital hygrometer (Traceable; VWR).
Biofilm Growth in Controlled Humidity.
Biofilms were grown as described in Materials and Methods, Biofilm Growth and Imaging (MSgg plates, 30 °C for 60 h) and the relative humidities were controlled using saturated salt concentrations. For each RH, six individual, inoculated agar dishes were attached, upside-down with their lids removed, to the lid of a disposable, rectangular plastic container (Gladware) of volume ∼3 dm3. The lower portion of each container was filled with a saturated salt slurry. The following salts were used to set the corresponding RHs: monopotassium phosphate, 94.5%; potassium chloride, 84%; sodium chloride, 75%; sodium bromide, 56%; potassium carbonate, 43%; magnesium chloride, 33%; and lithium chloride, 11%. [These relative humidity percentages are % (p/p), where p is pressure.] The total evaporation rate from the agar and biofilm was measured by weighing the total mass of the dish before and after 60 h of growth. The dry biomass of each colony was determined by scraping the biofilms off each plate and drying them at 80 °C for 2 h before weighing them. These experiments with various RH of air differ from studies of biofilm growth on substrates of various water activity, where humid air serves as the only source of water for bacterial growth and low RH has been shown to inhibit bacterial growth. In the experiments here there is always enough water in the agar gel for bacteria to grow; different values of RH determine the flux of water from agar and throughout the biofilm.
Miscellaneous.
Ambient water vapor pressure for the following experiments was as follows: silicone oil imbibition, pw = 0.22pw,sat; IR imaging, pw = 0.56pw,sat; particle image velocimetry, pw = 0.49pw,sat. Carboxylate-modified fluorescent microspheres from Invitrogen were diluted to a particle mass fraction <0.5 wt % for use in imaging liquid flow. Air–liquid surface tensions were measured using a du Nouy ring tensiometer (701; Sigma). Particle image velocimetry was used to determine flow velocities using an open source code (OpenPIV) implemented in Matlab. Infrared thermography was performed with an infrared camera (SC5000; Flir Systems).
Supplementary Material
Acknowledgments
We thank A. Seminara, H. Vlamakis, R. Kolter, J. Weaver, S. M. Rubinstein, K. Alim, A. J. Ehrlicher, and P. J. Lu for discussions; G. M. Süel for discussions and comments on the manuscript; Emmanuel Keita for suggesting the use of the IR camera; and Ronn Friedlander for help with the use of the IR camera. This work was supported by BASF, by Harvard Materials Research Science and Engineering Center Grant DMR-082048, by Deutsche Forschungsgemeinschaft Fellowship Grant ZA593/2-1 (to V.Z.), by the Fund for Scientific Research in Flanders (to M.D.V.), and by the Kavli Institute for Bionano Science and Technology at Harvard University. M.P.B. is an investigator of the Simons Foundation.
Footnotes
The authors declare no conflict of interest.
This article is a PNAS Direct Submission.
This article contains supporting information online at www.pnas.org/lookup/suppl/doi:10.1073/pnas.1216376110/-/DCSupplemental.
References
- 1.Flemming H-C, Wingender J. The biofilm matrix. Nat Rev Microbiol. 2010;8(9):623–633. doi: 10.1038/nrmicro2415. [DOI] [PubMed] [Google Scholar]
- 2.Sutherland IW. Biofilm exopolysaccharides: A strong and sticky framework. Microbiology. 2001;147(Pt 1):3–9. doi: 10.1099/00221287-147-1-3. [DOI] [PubMed] [Google Scholar]
- 3.Branda SS, Vik S, Friedman L, Kolter R. Biofilms: The matrix revisited. Trends Microbiol. 2005;13(1):20–26. doi: 10.1016/j.tim.2004.11.006. [DOI] [PubMed] [Google Scholar]
- 4.Ghannoum M, O’Toole GA, editors. Microbial Biofilms. Washington, DC: ASM Press; 2004. [Google Scholar]
- 5.O’Toole G, Kaplan HB, Kolter R. Biofilm formation as microbial development. Annu Rev Microbiol. 2000;54:49–79. doi: 10.1146/annurev.micro.54.1.49. [DOI] [PubMed] [Google Scholar]
- 6.Costerton JW, Stewart PS, Greenberg EP. Bacterial biofilms: A common cause of persistent infections. Science. 1999;284(5418):1318–1322. doi: 10.1126/science.284.5418.1318. [DOI] [PubMed] [Google Scholar]
- 7.Bryers JD. Medical biofilms. Biotechnol Bioeng. 2008;100(1):1–18. doi: 10.1002/bit.21838. [DOI] [PMC free article] [PubMed] [Google Scholar]
- 8.Otto M. Staphylococcal biofilms. Curr Top Microbiol Immunol. 2008;322:207–228. doi: 10.1007/978-3-540-75418-3_10. [DOI] [PMC free article] [PubMed] [Google Scholar]
- 9.Costerton JW, et al. Bacterial biofilms in nature and disease. Annu Rev Microbiol. 1987;41:435–464. doi: 10.1146/annurev.mi.41.100187.002251. [DOI] [PubMed] [Google Scholar]
- 10.Rittmann BE, McCarty PL. Environmental Biotechnology: Principles and Applications. New York: McGraw-Hill; 2001. [Google Scholar]
- 11.Nagórska K, Bikowski M, Obuchowski M. Multicellular behaviour and production of a wide variety of toxic substances support usage of Bacillus subtilis as a powerful biocontrol agent. Acta Biochim Pol. 2007;54(3):495–508. [PubMed] [Google Scholar]
- 12.Brenner K, You LC, Arnold FH. Engineering microbial consortia: A new frontier in synthetic biology. Trends Biotechnol. 2008;26(9):483–489. doi: 10.1016/j.tibtech.2008.05.004. [DOI] [PubMed] [Google Scholar]
- 13.Stewart PS. Mini-review: convection around biofilms. Biofouling. 2012;28(2):187–198. doi: 10.1080/08927014.2012.662641. [DOI] [PubMed] [Google Scholar]
- 14.Seymour JD, Codd SL, Gjersing EL, Stewart PS. Magnetic resonance microscopy of biofilm structure and impact on transport in a capillary bioreactor. J Magn Reson. 2004;167(2):322–327. doi: 10.1016/j.jmr.2004.01.009. [DOI] [PubMed] [Google Scholar]
- 15.Houry A, et al. Bacterial swimmers that infiltrate and take over the biofilm matrix. Proc Natl Acad Sci USA. 2012;109(32):13088–13093. doi: 10.1073/pnas.1200791109. [DOI] [PMC free article] [PubMed] [Google Scholar]
- 16.Aguilar C, Vlamakis H, Losick R, Kolter R. Thinking about Bacillus subtilis as a multicellular organism. Curr Opin Microbiol. 2007;10(6):638–643. doi: 10.1016/j.mib.2007.09.006. [DOI] [PMC free article] [PubMed] [Google Scholar]
- 17.Branda SS, et al. Genes involved in formation of structured multicellular communities by Bacillus subtilis. J Bacteriol. 2004;186(12):3970–3979. doi: 10.1128/JB.186.12.3970-3979.2004. [DOI] [PMC free article] [PubMed] [Google Scholar]
- 18.Branda SS, Chu F, Kearns DB, Losick R, Kolter R. A major protein component of the Bacillus subtilis biofilm matrix. Mol Microbiol. 2006;59(4):1229–1238. doi: 10.1111/j.1365-2958.2005.05020.x. [DOI] [PubMed] [Google Scholar]
- 19.Seminara A, et al. Osmotic spreading of Bacillus subtilis biofilms driven by an extracellular matrix. Proc Natl Acad Sci USA. 2012;109(4):1116–1121. doi: 10.1073/pnas.1109261108. [DOI] [PMC free article] [PubMed] [Google Scholar]
- 20.Wilking JN, Angelini TE, Seminara A, Brenner MP, Weitz DA. Biofilms as complex fluids. MRS Bull. 2011;36(5):385–391. [Google Scholar]
- 21.Stewart PS. Diffusion in biofilms. J Bacteriol. 2003;185(5):1485–1491. doi: 10.1128/JB.185.5.1485-1491.2003. [DOI] [PMC free article] [PubMed] [Google Scholar]
- 22. Asally M, et al. (2012) Localized cell death focuses mechanical forces during 3D patterning in a biofilm. Proc Natl Acad Sci USA 109(46):18891–18896. [DOI] [PMC free article] [PubMed]
- 23.Batson OV. Corrosion specimens prepared with a new material. Anat Rec. 1955;121(2):425–425. [Google Scholar]
- 24.Burger PC, Chandler DB, Klintworth GK. Scanning electron microscopy of vascular casts. J Electron Microsc Tech. 1984;1(4):341–348. [PubMed] [Google Scholar]
- 25.Yeh MS, Wei YH, Chang JS. Enhanced production of surfactin from Bacillus subtilis by addition of solid carriers. Biotechnol Prog. 2005;21(4):1329–1334. doi: 10.1021/bp050040c. [DOI] [PubMed] [Google Scholar]
- 26.Deegan RD, et al. Capillary flow as the cause of ring stains from dried liquid drops. Nature. 1997;389(6653):827–829. [Google Scholar]
- 27.Deegan RD, et al. Contact line deposits in an evaporating drop. Phys Rev E Stat Phys Plasmas Fluids Relat Interdiscip Topics. 2000;62(1 Pt B):756–765. doi: 10.1103/physreve.62.756. [DOI] [PubMed] [Google Scholar]
- 28.Yiotis AG, Boudouvis AG, Stubos AK, Tsimpanogiannis IN, Yortsos YC. Effect of liquid films on the isothermal drying of porous media. Phys Rev E Stat Nonlin Soft Matter Phys. 2003;68(3 Pt 2):037303. doi: 10.1103/PhysRevE.68.037303. [DOI] [PubMed] [Google Scholar]
- 29.Yiotis AG, Boudouvis AG, Stubos AK, Tsimpanogiannis IN, Yortsos YC. Effect of liquid films on the drying of porous media. AIChE J. 2004;50(11):2721–2737. doi: 10.1103/PhysRevE.68.037303. [DOI] [PubMed] [Google Scholar]
- 30.Branda SS, González-Pastor JE, Ben-Yehuda S, Losick R, Kolter R. Fruiting body formation by Bacillus subtilis. Proc Natl Acad Sci USA. 2001;98(20):11621–11626. doi: 10.1073/pnas.191384198. [DOI] [PMC free article] [PubMed] [Google Scholar]
Associated Data
This section collects any data citations, data availability statements, or supplementary materials included in this article.