

Abstract
Background
The Japanese Gastric Cancer Association (JGCA) started a new nationwide gastric cancer registration in 2008.
Methods
From 208 participating hospitals, 53 items including surgical procedures, pathological diagnosis, and survival outcomes of 13,626 patients with primary gastric cancer treated in 2002 were collected retrospectively. Data were entered into the JGCA database according to the JGCA classification (13th edition) and UICC TNM classification (5th edition) using an electronic data collecting system. Finally, data of 13,002 patients who underwent laparotomy were analyzed.
Results
The 5-year follow-up rate was 83.3 %. The direct death rate was 0.48 %. UICC 5-year survival rates (5YEARSs)/JGCA 5YEARSs were 92.2 %/92.3 % for stage IA, 85.3 %/84.7 % for stage IB, 72.1 %/70.0 % for stage II, 52.8 %/46.8 % for stage IIIA, 31.0 %/28.8 % for stage IIIB, and 14.9 %/15.3 % for stage IV, respectively. The proportion of patients more than 80 years old was 7.8 %, and their 5YEARS was 51.6 %. Postoperative outcome of the patients with primary gastric carcinoma in Japan have apparently improved in advanced cases and among the aged population when compared with the archival data. Further efforts to improve the follow-up rate are needed.
Conclusions
Postoperative outcome of the patients with primary gastric carcinoma in Japan have apparently improved in advanced cases and among the aged population when compared with the archival data. Further efforts to improve the follow-up rate are needed.
Keywords: Gastric cancer, Nationwide registry, 5-year survival rate (5YEARS), Japan
Introduction
The registration committee of the Japanese Gastric Cancer Association (JGCA) started a new registration program in 2008 after a 10-year blank period, and we reported the 5-year follow-up data of the patients treated in 2001 [1]. The registration has been continuing, and here we report the results of those treated in 2002.
Materials and methods
Leading hospitals in Japan voluntarily downloaded and fulfilled the database provided by the JGCA and sent the anonymized data to the JGCA data center. The collected data were analyzed according to the previously reported methods [1].
Results
Data of 14,394 patients were collected from 208 hospitals; 126 (60.6 %) hospitals participated in both years, but 82 hospitals were new, which was a 10 % increase as compared to the previous year (13,067 patients from 187 hospitals). The geographic distribution of the registered patients among the 47 prefectures is illustrated in Fig. 1. In Tokyo, 2,332 patients per year were registered, followed by 1,464 in Osaka. Four other prefectures registered more than 500 patients. On the other hand, the number of registered patients was fewer than 100 in 10 prefectures, and there were no registered patients in 2 prefectures.
Fig. 1.

Geographic distribution of registered patients by prefecture
Patients with remnant stomach cancer, non-epithelial malignant tumor, and gastric cancer combined with malignant tumor of other organs were excluded. Patients who were treated by endoscopic mucosal resection were also excluded. Data of 768 patients lacked essential items. Consequently, data of the remaining 13,002 patients were used for the final analysis.
The results are shown in Tables 1, 2, 3, 4, 5, 6, 7, 8, 9, 10, 11, 12, 13, 14, 15, 16, 17, 18, 19, 20, 21, 22, 23, 24, 25, 26, 27, and 28. Data given for each category of patients are: total number of patients, survival rates by year, standard error of 5YEARS, the number of direct death within 30 postoperative days, the number of patients lost to follow-up within 5 years, the number of 5-year survivors, and main cause of death, such as local and/or lymph node metastasis, peritoneal metastasis, liver metastasis, distant metastasis, recurrence at unknown site, other cancer, and other disease. Figures 2, 3, 4, 5, 6, 7, 8, 9, 10, 11, 12, 13, 14, 15, 16, and 17 provide cumulative survival curves of patients stratified by essential categories.
Table 1.
Primary cancer
| Categories | No. of patients | Direct death | Lost f.u. | 1 years (%) | 2 years (%) | 3 years (%) | 4 years (%) | 5 years (%) | SE at 5 years | Alive | Local rec. | Peritoneal | Liver rec. | Distant meta. | R | Other cancer | Other disease | Unknown |
|---|---|---|---|---|---|---|---|---|---|---|---|---|---|---|---|---|---|---|
| Primary cancer | 13626 | 89 | 2233 | 88.1 | 79.6 | 74.5 | 71.2 | 68.9 | 0.4 | 7436 | 454 | 1483 | 388 | 243 | 322 | 167 | 567 | 333 |
lost f.u. lost to follow-up, years(%) years of cumulative survival rate, SE standard error, rec recurrence, peritoneal peritoneal recurrence, R recurrence of unknown site
Table 2.
Resected cases and unresected cases and other surgeries
| Categories | No. of patients | Direct death | Lost f.u. | 1 year (%) | 2 years (%) | 3 years (%) | 4 years (%) | 5 years (%) | SE at 5 years | Alive | Local rec. | Peritoneal | Liver rec. | Distant meta. | R | Other cancer | Other disease | Unknown |
|---|---|---|---|---|---|---|---|---|---|---|---|---|---|---|---|---|---|---|
| Resected cases | 13002 | 63 | 2173 | 89.8 | 81.6 | 76.5 | 73.1 | 70.7 | 0.4 | 7286 | 410 | 1283 | 357 | 215 | 278 | 158 | 539 | 303 |
| Unresected cases | 355 | 21 | 25 | 25.7 | 7.3 | 2.9 | 1.9 | 1.5 | 0.7 | 4 | 37 | 183 | 24 | 24 | 32 | 2 | 12 | 12 |
Table 3.
Sex (resected cases)
| Categories | No. of patients |
Direct death | Lost f.u. | 1 years (%) | 2 years (%) |
3 years (%) | 4 years (%) | 5 years (%) | SE at 5 years | Alive | Local rec. | Peritoneal | Liver rec. | Distant meta. | R | Other cancer | Other disease | Unknown |
|---|---|---|---|---|---|---|---|---|---|---|---|---|---|---|---|---|---|---|
| Male | 8887 | 43 | 1464 | 89.7 | 81.4 | 76.1 | 72.5 | 70.0 | 0.5 | 4939 | 292 | 805 | 280 | 136 | 203 | 133 | 425 | 210 |
| Female | 4115 | 20 | 709 | 90.1 | 82.2 | 77.4 | 74.3 | 72.3 | 0.7 | 2347 | 118 | 478 | 77 | 79 | 75 | 25 | 114 | 93 |
Table 4.
Age (resected cases)
| Categories | No. of patients | Direct death | Lost f.u. | 1 year (%) | 2 years (%) | 3 years (%) | 4 years (%) | 5 years (%) | SE at 5 years | Alive | Local rec. | Peritoneal | Liver rec. | Distant meta. | R | Other cancer | Other disease | Unknown |
|---|---|---|---|---|---|---|---|---|---|---|---|---|---|---|---|---|---|---|
| <39 | 297 | 0 | 50 | 93.0 | 83.2 | 82.1 | 80.2 | 79.4 | 2.4 | 190 | 5 | 36 | 1 | 4 | 4 | 0 | 1 | 6 |
| 40–59 | 3622 | 10 | 581 | 93.4 | 86.7 | 83.2 | 80.3 | 78.8 | 0.7 | 2316 | 78 | 327 | 67 | 61 | 64 | 28 | 42 | 58 |
| 60–79 | 8075 | 40 | 1279 | 89.1 | 80.5 | 74.8 | 71.4 | 68.9 | 0.5 | 4450 | 282 | 798 | 255 | 142 | 180 | 110 | 387 | 192 |
| >80 | 1008 | 13 | 263 | 81.6 | 71.6 | 63.9 | 57.0 | 51.4 | 1.8 | 330 | 45 | 122 | 34 | 8 | 30 | 20 | 109 | 47 |
Table 5.
Tumor location (resected cases)
| Categories | No. of patients | Direct death | Lost f.u. | 1 year (%) | 2 years (%) | 3 years (%) | 4 years (%) | 5 years (%) | SE at 5 years | Alive | Local rec. | Peritoneal | Liver rec. | Distant meta. | R | Other cancer | Other disease | Unknown |
|---|---|---|---|---|---|---|---|---|---|---|---|---|---|---|---|---|---|---|
| U | 2681 | 18 | 434 | 87.3 | 77.5 | 71.1 | 67.1 | 64.3 | 1.0 | 1356 | 104 | 267 | 99 | 76 | 68 | 39 | 150 | 88 |
| M | 5182 | 8 | 881 | 93.6 | 88.4 | 84.4 | 81.7 | 79.7 | 0.6 | 3322 | 102 | 339 | 101 | 62 | 72 | 48 | 153 | 102 |
| L | 4249 | 28 | 766 | 90.3 | 81.8 | 76.8 | 73.2 | 70.8 | 0.7 | 2338 | 159 | 380 | 124 | 46 | 90 | 59 | 200 | 87 |
| Whole | 584 | 8 | 62 | 63.7 | 37.9 | 28.7 | 22.9 | 19.3 | 1.7 | 88 | 37 | 256 | 20 | 24 | 45 | 5 | 22 | 25 |
U upper third, M middle third, L lower third
Table 6.
Macroscopic type (resected cases)
| Categories | No. of patients | Direct death | Lost f.u. | 1 year (%) | 2 years (%) | 3 years (%) | 4 years (%) | 5 years (%) | SE at 5 years | Alive | Local rec. | Peritoneal | Liver rec. | Distant meta. | R | Other cancer | Other disease | Unknown |
|---|---|---|---|---|---|---|---|---|---|---|---|---|---|---|---|---|---|---|
| Type0 | 6869 | 13 | 1294 | 98.1 | 96.1 | 94.0 | 92.1 | 90.2 | 0.4 | 4959 | 40 | 69 | 31 | 22 | 24 | 105 | 244 | 81 |
| Type1 | 363 | 0 | 62 | 89.1 | 78.6 | 71.1 | 68.2 | 65.5 | 2.6 | 187 | 12 | 22 | 24 | 9 | 9 | 5 | 20 | 13 |
| Type2 | 1717 | 21 | 291 | 87.0 | 75.8 | 68.1 | 63.0 | 60.4 | 1.2 | 798 | 86 | 147 | 118 | 49 | 61 | 20 | 105 | 42 |
| Type3 | 2575 | 17 | 364 | 79.6 | 63.3 | 54.3 | 49.1 | 46.0 | 1.0 | 914 | 181 | 532 | 158 | 79 | 102 | 22 | 115 | 108 |
| Type4 | 923 | 9 | 86 | 63.7 | 37.9 | 28.2 | 21.5 | 17.7 | 1.3 | 127 | 55 | 450 | 12 | 39 | 72 | 2 | 36 | 44 |
| Type5 | 339 | 2 | 43 | 83.9 | 74.5 | 67.0 | 63.7 | 60.6 | 2.8 | 171 | 16 | 51 | 9 | 12 | 8 | 3 | 13 | 13 |
Table 7.
Histological type (resected cases)
| Categories | No. of patients | Direct death | Lost f.u. | 1 years (%) | 2 years (%) | 3 years (%) | 4 years (%) | 5 years (%) | SE at 5 years | Alive | Local rec. | Peritoneal | Liver rec. | Distant meta. | R | Other cancer | Other disease | Unknown |
|---|---|---|---|---|---|---|---|---|---|---|---|---|---|---|---|---|---|---|
| Papillary adenocarcinoma (pap) | 464 | 6 | 86 | 88.2 | 78.8 | 70.7 | 66.7 | 64.3 | 2.4 | 227 | 15 | 30 | 36 | 7 | 13 | 10 | 26 | 14 |
| tub 1 | 2846 | 9 | 542 | 96.2 | 92.4 | 88.3 | 85.9 | 83.6 | 0.7 | 1877 | 32 | 71 | 47 | 14 | 29 | 51 | 146 | 37 |
| tub 2 | 3458 | 18 | 585 | 91.0 | 82.8 | 77.0 | 73.3 | 70.8 | 0.8 | 1936 | 120 | 259 | 131 | 64 | 63 | 48 | 169 | 83 |
| por 1 | 1746 | 10 | 301 | 85.0 | 75.1 | 70.1 | 66.3 | 64.4 | 1.2 | 867 | 81 | 192 | 72 | 41 | 63 | 13 | 69 | 47 |
| por 2 | 2449 | 15 | 309 | 83.0 | 70.2 | 64.2 | 59.6 | 57.0 | 1.0 | 1148 | 120 | 530 | 43 | 63 | 80 | 16 | 81 | 59 |
| Signet-ring cell carcinoma (sig) | 1581 | 5 | 279 | 94.2 | 89.0 | 85.8 | 83.6 | 81.5 | 1.0 | 1030 | 18 | 127 | 4 | 17 | 18 | 16 | 30 | 42 |
| Mucinous adenocarcinoma (muc) | 259 | 0 | 34 | 83.7 | 68.6 | 61.9 | 59.3 | 55.2 | 3.2 | 116 | 14 | 53 | 4 | 5 | 6 | 2 | 11 | 14 |
| Adenosquamous carcinoma | 17 | 0 | 0 | 52.9 | 29.4 | 23.5 | 23.5 | 23.5 | 10.3 | 4 | 2 | 1 | 4 | 1 | 0 | 1 | 1 | 3 |
| Squamous cell carcinoma | 6 | 0 | 0 | 100.0 | 66.7 | 50.0 | 50.0 | 50.0 | 20.4 | 3 | 0 | 0 | 2 | 0 | 1 | 0 | 0 | 0 |
| Miscellaneous carcinoma | 75 | 0 | 18 | 77.9 | 69.0 | 64.2 | 62.4 | 58.8 | 6.1 | 29 | 4 | 6 | 11 | 1 | 1 | 0 | 2 | 3 |
tub 1 tubular adenocarcinoma, well-differentiated type; tub 2 tubular adenocarcinoma, moderately differentiated type; por 1 poorly differentiated adenocarcinoma, solid type, por 2, poorly differentiated adenocarcinoma, non-solid type
Table 8.
Histological findings (resected cases)
| Categories | No. of patients | Direct death | Lost f.u. | 1 year (%) | 2 years (%) | 3 years (%) | 4 years (%) | 5 years (%) | SE at 5 years | Alive | Local rec. | Peritoneal | Liver rec. | Distant meta. | R | Other cancer | Other disease | Unknown |
|---|---|---|---|---|---|---|---|---|---|---|---|---|---|---|---|---|---|---|
| Differentiated type | 6768 | 33 | 1213 | 93.0 | 86.6 | 81.3 | 78.1 | 75.7 | 0.5 | 4040 | 167 | 360 | 214 | 85 | 105 | 109 | 341 | 134 |
| Undifferentiated type | 6035 | 30 | 923 | 86.5 | 76.5 | 71.5 | 67.8 | 65.5 | 0.6 | 3161 | 233 | 902 | 123 | 126 | 167 | 47 | 191 | 162 |
| Other type | 98 | 0 | 18 | 74.9 | 61.5 | 55.7 | 54.4 | 51.8 | 5.3 | 36 | 6 | 7 | 17 | 2 | 2 | 1 | 3 | 6 |
Table 9.
Lymphatic invasion(ly) (resected cases)
| Categories | No. of patients | Direct death | Lost f.u. | 1 year (%) | 2 years (%) | 3 years (%) | 4 years (%) | 5 years (%) | SE at 5 years | Alive | Local rec. | Peritoneal | Liver rec. | Distant meta. | R | Other cancer | Other disease | Unknown |
|---|---|---|---|---|---|---|---|---|---|---|---|---|---|---|---|---|---|---|
| ly0 | 5744 | 10 | 1089 | 97.8 | 95.3 | 93.3 | 91.3 | 89.6 | 0.4 | 4108 | 22 | 108 | 21 | 21 | 23 | 80 | 202 | 70 |
| ly1 | 3156 | 16 | 524 | 92.6 | 84.9 | 79.7 | 75.4 | 72.7 | 0.8 | 1833 | 67 | 278 | 88 | 42 | 58 | 38 | 148 | 80 |
| ly2 | 2208 | 14 | 321 | 83.2 | 69.1 | 59.8 | 54.9 | 51.3 | 1.1 | 891 | 135 | 370 | 142 | 74 | 87 | 25 | 103 | 60 |
| ly3 | 1769 | 23 | 217 | 67.1 | 46.1 | 36.4 | 31.2 | 28.6 | 1.1 | 387 | 183 | 516 | 105 | 77 | 103 | 12 | 78 | 91 |
Table 10.
Venous invasion(v) (resected cases)
| Categories | No. of patients | Direct death | Lost f.u. | 1 years (%) | 2 years (%) | 3 years (%) | 4 years (%) | 5 years (%) | SE at 5 years | Alive | Local rec. | Peritoneal | Liver rec. | Distant meta. | R | Other cancer | Other disease | Unknown |
|---|---|---|---|---|---|---|---|---|---|---|---|---|---|---|---|---|---|---|
| v0 | 8027 | 22 | 1456 | 95.8 | 91.6 | 88.3 | 85.8 | 83.4 | 0.4 | 5344 | 105 | 384 | 68 | 57 | 69 | 107 | 308 | 129 |
| v1 | 2800 | 21 | 405 | 85.1 | 72.9 | 65.1 | 60.3 | 57.6 | 1.0 | 1284 | 146 | 446 | 110 | 81 | 84 | 32 | 121 | 91 |
| v2 | 1347 | 11 | 183 | 75.5 | 57.8 | 48.3 | 42.9 | 40.8 | 1.4 | 425 | 100 | 291 | 97 | 44 | 75 | 13 | 68 | 51 |
| v3 | 676 | 9 | 104 | 66.1 | 45.5 | 38.2 | 33.3 | 31.5 | 1.9 | 151 | 54 | 145 | 80 | 31 | 44 | 3 | 34 | 30 |
Table 11.
Depth of invasion (resected cases)
| Categories | No. of patients | Direct death | Lost f.u. | 1 year (%) | 2 years (%) | 3 years (%) | 4 years (%) | 5 years (%) | SE at 5 years | Alive | Local rec. | Peritoneal | Liver rec. | Distant meta. | R | Other cancer | Other disease | Unknown |
|---|---|---|---|---|---|---|---|---|---|---|---|---|---|---|---|---|---|---|
| pT1(M) | 3293 | 9 | 689 | 98.8 | 97.8 | 96.4 | 94.9 | 93.5 | 0.5 | 2410 | 3 | 7 | 3 | 2 | 4 | 40 | 109 | 26 |
| pT1(SM) | 3110 | 6 | 550 | 98.0 | 95.8 | 93.5 | 91.7 | 89.7 | 0.6 | 2268 | 17 | 12 | 17 | 13 | 9 | 51 | 129 | 44 |
| pT2(MP) | 1341 | 4 | 252 | 95.8 | 91.5 | 87.2 | 84.8 | 82.1 | 1.1 | 869 | 25 | 31 | 27 | 16 | 13 | 17 | 62 | 29 |
| pT2(SS) | 2115 | 14 | 306 | 87.8 | 76.0 | 67.9 | 62.5 | 59.1 | 1.1 | 996 | 110 | 236 | 128 | 73 | 69 | 29 | 104 | 64 |
| pT3(SE) | 2567 | 26 | 301 | 72.5 | 51.0 | 40.3 | 33.6 | 30.3 | 1.0 | 614 | 192 | 839 | 153 | 94 | 138 | 14 | 109 | 113 |
| pT4(SI) | 458 | 4 | 52 | 57.7 | 34.6 | 26.3 | 21.9 | 20.6 | 2.0 | 68 | 47 | 154 | 28 | 17 | 42 | 4 | 21 | 25 |
Table 12.
pT classification (resected cases)
| Categories | No. of patients | Direct death | Lost f.u. | 1 year (%) | 2 years (%) | 3 years (%) | 4 years (%) | 5 years (%) | SE at 5 years | Alive | Local rec. | Peritoneal | Liver rec. | Distant meta. | R | Other cancer | Other disease | Unknown |
|---|---|---|---|---|---|---|---|---|---|---|---|---|---|---|---|---|---|---|
| pT1 | 6403 | 15 | 1239 | 98.4 | 96.9 | 95.0 | 93.3 | 91.7 | 0.4 | 4678 | 20 | 19 | 20 | 15 | 13 | 91 | 238 | 70 |
| pT2 | 3456 | 18 | 558 | 90.9 | 82.0 | 75.3 | 71.1 | 67.9 | 0.8 | 1865 | 135 | 267 | 155 | 89 | 82 | 46 | 166 | 93 |
| pT3 | 2567 | 26 | 301 | 72.5 | 51.0 | 40.3 | 33.6 | 30.3 | 1.0 | 614 | 192 | 839 | 153 | 94 | 138 | 14 | 109 | 113 |
| pT4 | 458 | 4 | 52 | 57.7 | 34.6 | 26.3 | 21.9 | 20.6 | 2.0 | 68 | 47 | 154 | 28 | 17 | 42 | 4 | 21 | 25 |
Table 13.
Lymph node metastasis (resected cases)
| categories | No. of patients | Direct death | Lost f.u. | 1 yearr (%) | 2 years (%) | 3 years (%) | 4 years (%) | 5 years (%) | SE at 5 years | Alive | Local rec. | Peritoneal | Liver rec. | Distant meta. | R | Other cancer | Other disease | Unknown |
|---|---|---|---|---|---|---|---|---|---|---|---|---|---|---|---|---|---|---|
| pN0 | 7603 | 20 | 1482 | 97.6 | 95.3 | 92.9 | 90.9 | 88.9 | 0.4 | 5350 | 29 | 132 | 52 | 21 | 34 | 107 | 303 | 93 |
| pN1 | 2619 | 17 | 374 | 86.3 | 73.9 | 66.6 | 61.4 | 58.9 | 1.0 | 1240 | 115 | 402 | 124 | 59 | 81 | 28 | 124 | 72 |
| pN2 | 2032 | 15 | 246 | 76.4 | 56.0 | 44.5 | 38.1 | 34.6 | 1.1 | 547 | 172 | 542 | 132 | 88 | 114 | 15 | 79 | 97 |
| pN3 | 522 | 9 | 41 | 54.9 | 30.1 | 20.3 | 16.5 | 14.3 | 1.6 | 61 | 86 | 158 | 36 | 43 | 41 | 3 | 22 | 31 |
Table 14.
Peritoneal cytology (resected cases)
| Categories | No. of patients | Direct death | Lost f.u. | 1 year (%) | 2 years (%) | 3 years (%) | 4 years (%) | 5 years (%) | SE at 5 years | Alive | Local rec. | Peritoneal | Liver rec | Distant meta. | R | Other cancer | Other disease | Unknown |
|---|---|---|---|---|---|---|---|---|---|---|---|---|---|---|---|---|---|---|
| CY0 | 5075 | 16 | 761 | 89.9 | 80.0 | 73.2 | 68.6 | 65.6 | 0.7 | 2675 | 229 | 576 | 200 | 117 | 112 | 60 | 199 | 146 |
| CY1 | 761 | 16 | 71 | 52.2 | 26.1 | 18.3 | 15.0 | 12.3 | 1.3 | 72 | 45 | 386 | 28 | 36 | 52 | 2 | 33 | 36 |
Table 15.
Peritoneal metastasis (P) (resected cases)
| Categories | No. of patients | Direct death | Lost f.u. | 1 year(%) | 2 years (%) | 3 years (%) | 4 years (%) | 5 years (%) | SE at 5 years | Alive | Local rec. | Peritoneal | Liver rec. | Distant meta. | R | Other cancer | Other disease | Unknown |
|---|---|---|---|---|---|---|---|---|---|---|---|---|---|---|---|---|---|---|
| fP0 | 12004 | 47 | 2082 | 92.3 | 85.2 | 80.3 | 77.0 | 74.5 | 0.4 | 7087 | 349 | 862 | 308 | 184 | 218 | 154 | 503 | 257 |
| fP1 | 762 | 15 | 62 | 48.9 | 23.3 | 13.9 | 9.9 | 8.3 | 1.1 | 49 | 48 | 402 | 44 | 28 | 56 | 4 | 31 | 38 |
Table 16.
Liver metastasis (H) (resected cases)
| Categories | No. of patients | Direct death | Lost f.u. | 1 year (%) | 2 years (%) | 3 years (%) | 4 years (%) | 5 years (%) | SE at 5 years | Alive | Local rec. | Peritoneal | Liver rec. | Distant meta. | R | Other cancer | Other disease | Unknown |
|---|---|---|---|---|---|---|---|---|---|---|---|---|---|---|---|---|---|---|
| fH0 | 12441 | 57 | 2114 | 91.0 | 83.1 | 78.0 | 74.6 | 72.2 | 0.4 | 7114 | 386 | 1197 | 229 | 200 | 247 | 156 | 517 | 281 |
| fH1 | 326 | 6 | 34 | 39.8 | 22.3 | 15.5 | 12.7 | 11.4 | 1.9 | 23 | 10 | 63 | 122 | 12 | 28 | 0 | 17 | 17 |
Table 17.
Distant metastasis including peritoneal and liver metastasis (M) (resected cases)
| Categories | No. of patients | Direct death | Lost f.u. | 1 year (%) | 2 years (%) | 3 years (%) | 4 years (%) | 5 years (%) | SE at 5 years | Alive | Local rec. | Peritoneal | Liver rec | Distant meta. | R | Other cancer | Other disease | Unknown |
|---|---|---|---|---|---|---|---|---|---|---|---|---|---|---|---|---|---|---|
| fM0 | 12530 | 56 | 2128 | 90.4 | 82.5 | 77.5 | 74.1 | 71.7 | 0.4 | 7104 | 376 | 1186 | 322 | 185 | 262 | 155 | 518 | 294 |
| fM1 | 216 | 6 | 15 | 53.2 | 29.5 | 18.1 | 13.5 | 12.4 | 2.4 | 22 | 21 | 73 | 28 | 26 | 15 | 1 | 11 | 4 |
Table 18.
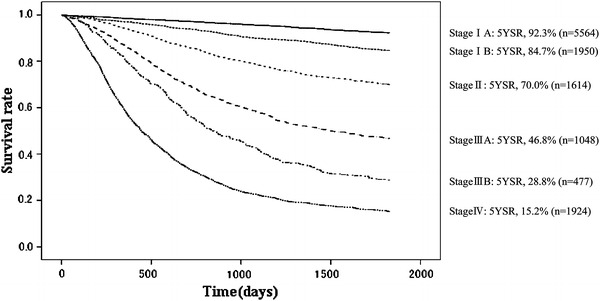
Japanese stage (resected cases)
| Categories | No. of patients | Direct death | Lost f.u. | 1 year (%) | 2 years (%) | 3 years (%) | 4 years (%) | 5 years (%) | SE at 5 years | Alive | Local rec. | Peritoneal | Liver rec. | Distant meta. | R | Other cancer | Other disease | Unknown |
|---|---|---|---|---|---|---|---|---|---|---|---|---|---|---|---|---|---|---|
| StageIA | 5640 | 14 | 1113 | 98.5 | 97.1 | 95.4 | 93.8 | 92.2 | 0.4 | 4126 | 11 | 11 | 10 | 4 | 11 | 86 | 215 | 53 |
| StageIB | 1822 | 5 | 364 | 97.2 | 94.4 | 90.8 | 88.1 | 85.3 | 0.9 | 1216 | 14 | 41 | 25 | 15 | 12 | 27 | 79 | 29 |
| StageII | 1424 | 3 | 220 | 95.0 | 86.5 | 80.2 | 75.5 | 72.1 | 1.2 | 834 | 50 | 100 | 43 | 30 | 30 | 15 | 69 | 33 |
| StageIIIA | 1178 | 6 | 159 | 88.6 | 74.0 | 63.1 | 56.1 | 52.8 | 1.5 | 501 | 81 | 199 | 55 | 30 | 40 | 14 | 56 | 43 |
| StageIIIB | 678 | 4 | 85 | 82.1 | 58.0 | 43.8 | 34.9 | 31.0 | 1.9 | 161 | 61 | 205 | 38 | 31 | 31 | 5 | 32 | 29 |
| StageIV | 1902 | 30 | 180 | 55.6 | 31.0 | 21.7 | 17.4 | 14.9 | 0.9 | 218 | 180 | 708 | 180 | 101 | 149 | 8 | 80 | 98 |
Table 19.
Japanese stage (resected cases)
| Categories | No. of patients | Direct death | Lost f.u. | 1 year (%) | 2 years (%) | 3 years (%) | 4 years (%) | 5 years (%) | SE at 5 years | Alive | Local rec. | Peritoneal | Liver rec. | Distant meta. | R | Other cancer | Other disease | Unknown |
|---|---|---|---|---|---|---|---|---|---|---|---|---|---|---|---|---|---|---|
| StageI | 7462 | 19 | 1477 | 98.2 | 96.4 | 94.3 | 92.4 | 90.5 | 0.4 | 5342 | 25 | 52 | 35 | 19 | 23 | 113 | 294 | 82 |
| StageII | 1424 | 3 | 220 | 95.0 | 86.5 | 80.2 | 75.5 | 72.1 | 1.2 | 834 | 50 | 100 | 43 | 30 | 30 | 15 | 69 | 33 |
| StageIII | 1856 | 10 | 244 | 86.2 | 68.2 | 56.1 | 48.4 | 44.9 | 1.2 | 662 | 142 | 404 | 93 | 61 | 71 | 19 | 88 | 72 |
| StageIV | 1902 | 30 | 180 | 55.6 | 31.0 | 21.7 | 17.4 | 14.9 | 0.9 | 218 | 180 | 708 | 180 | 101 | 149 | 8 | 80 | 98 |
Table 20.
TNM stage (resected cases)
| Categories | No. of patients | Direct death | Lost f.u. | 1 year (%) | 2 years (%) | 3 years (%) | 4 years (%) | 5 years (%) | SE at 5 years | Alive | Local rec. | Peritoneal | Liver rec. | Distant meta. | R | Other cancer | Other disease | Unknown |
|---|---|---|---|---|---|---|---|---|---|---|---|---|---|---|---|---|---|---|
| Stage IA | 5564 | 15 | 1111 | 98.2 | 97.1 | 95.5 | 93.9 | 92.3 | 0.4 | 4062 | 10 | 9 | 9 | 4 | 11 | 84 | 210 | 54 |
| Stage IB | 1950 | 5 | 385 | 97.0 | 93.8 | 89.9 | 87.5 | 84.7 | 0.9 | 1294 | 17 | 49 | 25 | 15 | 20 | 28 | 84 | 33 |
| Stage II | 1614 | 5 | 261 | 94.0 | 85.4 | 78.4 | 73.3 | 70.0 | 1.2 | 903 | 62 | 125 | 64 | 35 | 34 | 14 | 80 | 36 |
| Stage IIIA | 1048 | 9 | 133 | 86.1 | 68.4 | 58.2 | 50.6 | 46.8 | 1.6 | 399 | 75 | 204 | 44 | 33 | 37 | 15 | 55 | 53 |
| Stage IIIB | 477 | 1 | 58 | 79.6 | 55.6 | 41.9 | 32.2 | 28.8 | 2.2 | 107 | 45 | 166 | 19 | 18 | 28 | 4 | 17 | 15 |
| Stage IV | 1924 | 27 | 184 | 57.3 | 32.8 | 22.4 | 17.9 | 15.2 | 0.9 | 223 | 180 | 704 | 189 | 107 | 142 | 12 | 83 | 100 |
Table 21.
TNM stage (resected cases)
| Categories | No. of patients | Direct death | Lost f.u. | 1 year (%) | 2 years (%) | 3 years (%) | 4 years (%) | 5 years (%) | SE at 5 years | Alive | Local rec. | Peritoneal | Liver rec. | Distant meta. | R | Other cancer | Other disease | Unknown |
|---|---|---|---|---|---|---|---|---|---|---|---|---|---|---|---|---|---|---|
| StageI | 7514 | 20 | 1496 | 98.1 | 96.2 | 94.1 | 92.2 | 90.3 | 0.4 | 5356 | 27 | 58 | 34 | 19 | 31 | 112 | 294 | 87 |
| StageII | 1614 | 5 | 261 | 94.0 | 85.4 | 78.4 | 73.3 | 70.0 | 1.2 | 903 | 62 | 125 | 64 | 35 | 34 | 14 | 80 | 36 |
| StageIII | 1525 | 10 | 191 | 84.1 | 64.4 | 53.2 | 44.9 | 41.2 | 1.3 | 506 | 120 | 370 | 63 | 51 | 65 | 19 | 72 | 68 |
| StageIV | 1924 | 27 | 184 | 57.3 | 32.8 | 22.4 | 17.9 | 15.2 | 0.9 | 223 | 180 | 704 | 189 | 107 | 142 | 12 | 83 | 100 |
Table 22.
Surgical approach (resected cases)
| Categories | No. of patients | Direct death | Lost f.u. | 1 year (%) | 2 years (%) | 3 years (%) | 4 years (%) | 5 years (%) | SE at 5 years | Alive | Local rec. | Peritoneal | Liver rec. | Distant meta. | R | Other cancer | Other disease | Unknown |
|---|---|---|---|---|---|---|---|---|---|---|---|---|---|---|---|---|---|---|
| Laparotomy | 12166 | 59 | 2021 | 89.6 | 81.2 | 76.0 | 72.4 | 69.9 | 0.4 | 6745 | 391 | 1238 | 346 | 204 | 273 | 147 | 514 | 287 |
| Thoracolaparotomy | 152 | 2 | 13 | 70.7 | 52.0 | 41.4 | 38.5 | 35.4 | 4.0 | 45 | 14 | 35 | 6 | 10 | 5 | 3 | 12 | 9 |
| Laparoscopic | 658 | 2 | 136 | 97.7 | 96.4 | 95.0 | 94.4 | 93.3 | 1.0 | 481 | 4 | 6 | 4 | 0 | 0 | 8 | 13 | 6 |
| Others | 6 | 0 | 2 | 80.0 | 60.0 | 60.0 | 60.0 | 60.0 | 21.9 | 2 | 1 | 0 | 0 | 0 | 0 | 0 | 0 | 1 |
Table 23.
Surgical procedures (resected cases)
| Categories | No. of patients | Direct death | Lost f.u. | 1 year (%) | 2 years (%) | 3 years (%) | 4 years (%) | 5 years (%) | SE at 5 years | Alive | Local rec. | Peritoneal | Liver rec. | Distant meta. | R | Other cancer | Other disease | Unknown |
|---|---|---|---|---|---|---|---|---|---|---|---|---|---|---|---|---|---|---|
| Distal gastrectomy | 7743 | 32 | 1405 | 93.1 | 86.9 | 82.6 | 79.9 | 77.7 | 0.5 | 4742 | 197 | 515 | 179 | 72 | 124 | 83 | 283 | 143 |
| Total gastrectomy | 3966 | 25 | 548 | 81.2 | 67.5 | 60.1 | 54.9 | 51.9 | 0.8 | 1635 | 207 | 752 | 164 | 138 | 145 | 45 | 194 | 138 |
| Proximal gastrectomy | 523 | 2 | 111 | 94.8 | 91.3 | 88.3 | 86.5 | 85.1 | 1.6 | 341 | 5 | 12 | 9 | 2 | 4 | 7 | 22 | 10 |
| Pylorus-preserving gastrectomy | 397 | 1 | 37 | 99.5 | 98.2 | 95.9 | 94.8 | 92.6 | 1.3 | 332 | 1 | 2 | 3 | 1 | 1 | 3 | 14 | 3 |
| Segmental or local gastrectomy | 351 | 3 | 67 | 95.0 | 91.2 | 86.2 | 82.9 | 81.2 | 2.2 | 224 | 0 | 2 | 2 | 2 | 4 | 17 | 24 | 9 |
| Surgical mucosal resection | 22 | 0 | 5 | 100.0 | 89.5 | 78.9 | 78.9 | 73.3 | 10.2 | 12 | 0 | 0 | 0 | 0 | 0 | 3 | 2 | 0 |
Table 24.
Lymph node dissection (D) (resected cases)
| Categories | No. of patients | Direct death | Lost f.u. | 1 ysr (%) | 2 ysr (%) | 3 ysr (%) | 4 ysr (%) | 5 ysr (%) | SE at 5 ysr | Alive | Local rec. | Peri-toneal | Liver rec. | Distant meta. | R | Other cancer | Other disease | Un-known |
|---|---|---|---|---|---|---|---|---|---|---|---|---|---|---|---|---|---|---|
| D0 | 802 | 12 | 125 | 80.5 | 73.7 | 69.1 | 67.0 | 65.6 | 1.7 | 420 | 17 | 95 | 34 | 10 | 17 | 18 | 49 | 17 |
| D1 | 2553 | 15 | 457 | 86.4 | 79.1 | 74.6 | 71.2 | 68.8 | 1.0 | 1356 | 58 | 276 | 65 | 29 | 56 | 48 | 145 | 63 |
| D1 + α | 1684 | 7 | 349 | 92.0 | 86.1 | 83.2 | 80.9 | 78.6 | 1.1 | 1008 | 39 | 94 | 27 | 13 | 31 | 21 | 77 | 25 |
| D1 + β | 882 | 2 | 165 | 93.5 | 88.3 | 85.6 | 83.5 | 81.4 | 1.4 | 563 | 18 | 45 | 19 | 8 | 9 | 9 | 33 | 13 |
| D2 | 6056 | 20 | 907 | 91.6 | 82.2 | 76.0 | 72.1 | 69.6 | 0.6 | 3424 | 240 | 654 | 183 | 126 | 124 | 53 | 201 | 144 |
| D3 | 343 | 2 | 35 | 82.8 | 66.6 | 58.4 | 51.1 | 47.7 | 2.8 | 138 | 28 | 67 | 21 | 17 | 17 | 3 | 6 | 11 |
Table 25.
Resection margins (resected cases)
| Categories | No. of patients | Direct death | Lost f.u. | 1 year (%) | 2 years (%) | 3 years (%) | 4 years (%) | 5 years (%) | SE at 5 years | Alive | Local rec. | Peritoneal | Liver rec. | Distant meta. | R | Other cancer | Other disease | Unknown |
|---|---|---|---|---|---|---|---|---|---|---|---|---|---|---|---|---|---|---|
| PM− and DM− | 12217 | 56 | 2089 | 91.0 | 83.1 | 78.1 | 74.7 | 72.3 | 0.4 | 6984 | 355 | 1102 | 332 | 192 | 240 | 155 | 500 | 268 |
| PM+ and/or DM+ | 397 | 7 | 43 | 50.9 | 32.2 | 23.4 | 18.4 | 16.2 | 2.0 | 50 | 34 | 144 | 18 | 15 | 34 | 2 | 27 | 30 |
Table 26.
Combined resection of neighboring organs (resected cases)
| Categories | No. of patients | Direct death | Lost f.u. | 1 year (%) | 2 years (%) | 3 years (%) | 4 years (%) | 5 years (%) | SE at 5 years | Alive | Local rec. | Peritoneal | Liver rec. | Distant meta. | R | Other cancer | Other disease | Unknown |
|---|---|---|---|---|---|---|---|---|---|---|---|---|---|---|---|---|---|---|
| No combined resection | 7955 | 33 | 1494 | 92.0 | 85.6 | 81.4 | 78.6 | 76.5 | 0.5 | 4729 | 193 | 588 | 161 | 80 | 132 | 98 | 326 | 154 |
| Combined resection | 4309 | 29 | 615 | 85.1 | 73.2 | 66.3 | 61.5 | 58.7 | 0.8 | 2032 | 191 | 651 | 183 | 123 | 135 | 55 | 192 | 132 |
PM proximal margin, DM distal margin
Table 27.
Combined resected organs (resected cases)
| Categories | No. of patients | Direct death | Lost f.u. | 1 year (%) | 2 years (%) | 3 years (%) | 4 years (%) | 5 years (%) | SE at 5 years | Alive | Local rec. | Peritoneal | Liver rec. | Distant meta. | R | Other cancer | Other disease | Unknown |
|---|---|---|---|---|---|---|---|---|---|---|---|---|---|---|---|---|---|---|
| Caudal pancreas | 313 | 1 | 35 | 74.2 | 54.5 | 45.5 | 39.7 | 37.5 | 2.9 | 96 | 28 | 77 | 15 | 17 | 22 | 3 | 10 | 10 |
| Spleen | 1444 | 10 | 189 | 84.7 | 68.8 | 59.6 | 53.7 | 49.7 | 1.4 | 573 | 80 | 288 | 61 | 70 | 49 | 15 | 68 | 51 |
| Transverse colon | 101 | 1 | 19 | 71.6 | 52.3 | 43.0 | 38.0 | 36.7 | 5.2 | 25 | 5 | 27 | 4 | 2 | 9 | 0 | 7 | 3 |
| Transverse mesocolon | 53 | 1 | 7 | 82.9 | 61.4 | 53.2 | 40.3 | 38.1 | 7.0 | 15 | 3 | 15 | 2 | 1 | 4 | 0 | 5 | 1 |
| Diaphragma | 9 | 0 | 1 | 50.8 | 25.4 | 0.0 | 0.0 | 0.0 | 0.0 | 0 | 0 | 0 | 4 | 2 | 0 | 0 | 1 | 1 |
| Liver | 96 | 2 | 11 | 63.6 | 49.2 | 40.2 | 34.5 | 33.2 | 5.0 | 24 | 7 | 11 | 17 | 4 | 8 | 2 | 6 | 6 |
| Gallbladder | 2121 | 12 | 339 | 89.1 | 81.9 | 77.3 | 73.5 | 71.2 | 1.0 | 1215 | 59 | 213 | 73 | 22 | 40 | 28 | 80 | 52 |
| Adrenal gland | 10 | 0 | 0 | 90.0 | 80.0 | 80.0 | 80.0 | 80.0 | 12.6 | 8 | 1 | 0 | 0 | 0 | 0 | 0 | 0 | 1 |
| Kidney | 7 | 0 | 2 | 85.7 | 85.7 | 85.7 | 68.6 | 68.6 | 18.6 | 3 | 0 | 0 | 0 | 0 | 0 | 1 | 1 | 0 |
| Small intestine | 10 | 0 | 1 | 90.0 | 70.0 | 60.0 | 60.0 | 60.0 | 15.5 | 5 | 0 | 1 | 0 | 0 | 0 | 0 | 2 | 1 |
| Abdominal wall | 1 | 0 | 0 | 0.0 | 0.0 | 0.0 | 0.0 | 0.0 | 0.0 | 0 | 0 | 0 | 1 | 0 | 0 | 0 | 0 | 0 |
| Ovary | 22 | 0 | 3 | 67.4 | 52.1 | 41.7 | 41.7 | 41.7 | 11.0 | 7 | 0 | 11 | 0 | 1 | 0 | 0 | 0 | 0 |
| Pancreas head (PD) | 20 | 2 | 2 | 85.0 | 69.1 | 58.4 | 41.8 | 35.9 | 11.3 | 6 | 2 | 0 | 1 | 0 | 2 | 1 | 5 | 1 |
| Others | 66 | 0 | 4 | 86.4 | 75.6 | 67.9 | 67.9 | 67.9 | 5.8 | 41 | 1 | 5 | 3 | 2 | 1 | 4 | 2 | 3 |
PD pancreatoduodenectomy
Table 28.
Curative potential (resected cases)
| Categories | No. of patients | Direct death | Lost f.u. | 1 year (%) | 2 years (%) | 3 years (%) | 4 years (%) | 5 years (%) | SE at 5 years | Alive | Local rec. | Peritoneal | Liver rec. | Distant meta. | R | Other cancer | Other disease | Unknown |
|---|---|---|---|---|---|---|---|---|---|---|---|---|---|---|---|---|---|---|
| A | 8102 | 20 | 1585 | 97.8 | 95.4 | 92.9 | 90.6 | 88.6 | 0.4 | 5674 | 58 | 119 | 66 | 39 | 39 | 113 | 300 | 109 |
| B | 3078 | 14 | 398 | 88.3 | 72.5 | 62.1 | 56.1 | 52.5 | 0.9 | 1318 | 206 | 508 | 137 | 94 | 115 | 39 | 155 | 108 |
| C | 1505 | 28 | 149 | 49.0 | 24.7 | 16.4 | 12.1 | 9.9 | 0.8 | 109 | 126 | 624 | 150 | 78 | 120 | 3 | 71 | 75 |
Fig. 2.
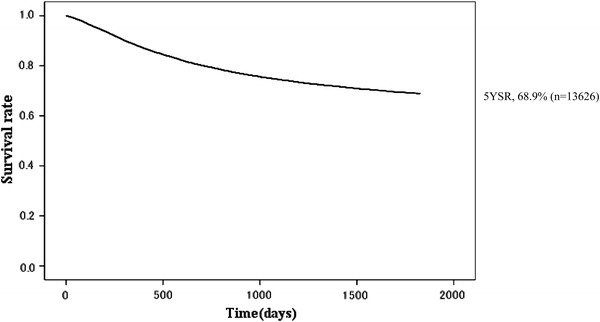
Kaplan–Meier survival for all patients with primary gastric cancer. 5YEARS 5-year survival rate
Fig. 3.

Kaplan–Meier survival for resected cases and unresected cases
Fig. 4.

Kaplan–Meier survival of resected cases stratified by sex
Fig. 5.
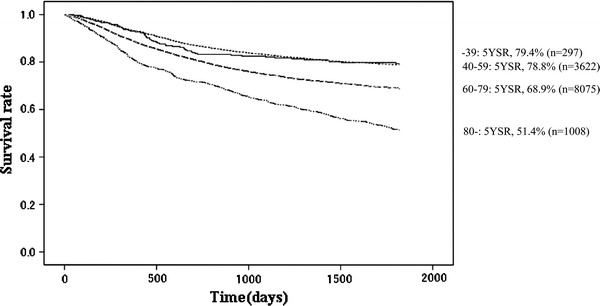
Kaplan–Meier survival of resected cases stratified by age
Fig. 6.
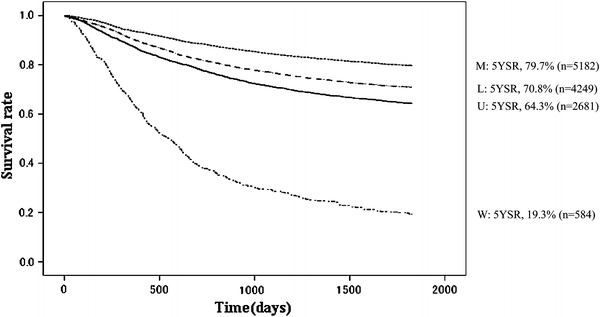
Kaplan–Meier survival of resected cases stratified by tumor location. W whole stomach
Fig. 7.

Kaplan–Meier survival of resected cases stratified by macroscopic type
Fig. 8.

Kaplan–Meier survival of resected cases stratified by histological findings
Fig. 9.
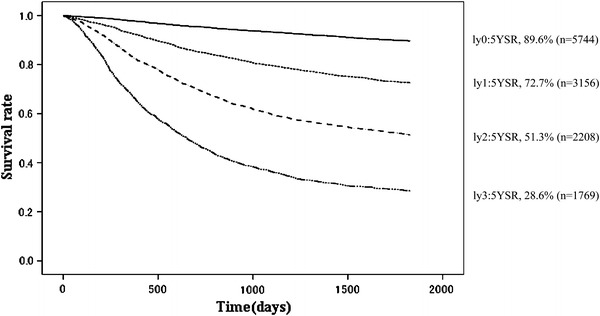
Kaplan–Meier survival of resected cases stratified by lymphatic invasion
Fig. 10.

Kaplan–Meier survival of resected cases stratified by depth of tumor invasion
Fig. 11.
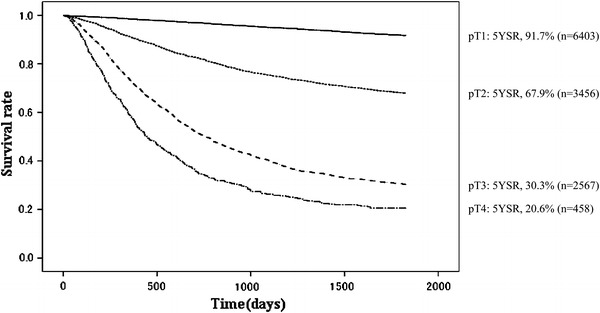
Kaplan–Meier survival of resected cases stratified by pT classification
Fig. 12.
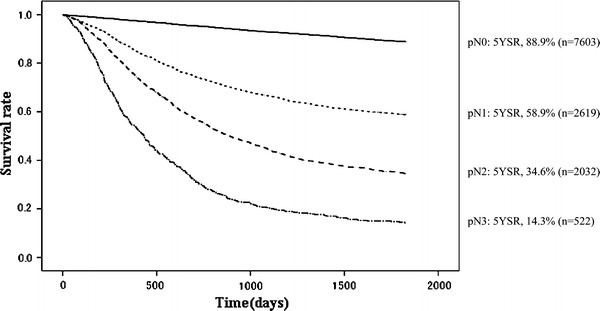
Kaplan–Meier survival of resected cases stratified by lymph node metastasis
Fig. 13.
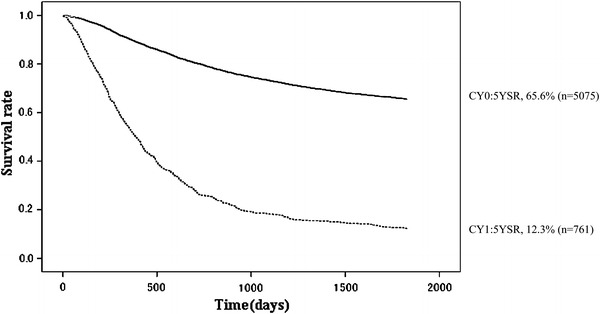
Kaplan–Meier survival of resected cases stratified by peritoneal cytology
Fig. 14.

Kaplan–Meier survival of resected cases stratified by peritoneal metastasis
Fig. 15.

Kaplan–Meier survival of resected cases stratified by Japanese Gastric Cancer Association (JGCA) stage
Fig. 16.
Kaplan–Meier survival of resected cases stratified by TNM stage
Fig. 18.

Chronological change of gastric cancer patients older than 80 years. The nationwide registry was suspended for a decade from 1992
The 5YEARS in 13,626 patients with primary gastric cancer was 68.9 % (Table 1; Fig. 2). During the 5-year follow-up, 2,233 patients were lost; the follow-up rate was 83.6 %. Of the 13,626 patients, 13,002 underwent gastric resection. Accordingly, the resection rate was 95.4 %, and the 5YEARS of the resected patients was 70.7 % (Table 2; Fig. 3). Sixty-three of 13,002 resected cases died within 30 days postoperatively. The direct death rate was 0.48 %. The frequent causes of death in patients who had undergone gastrectomy were peritoneal metastasis (n = 1,283), followed by other diseases (n = 539), local recurrence including node metastasis (n = 410), liver metastasis (n = 357), recurrence at unknown site (n = 278), and other cancer (n = 158).
The proportion of male patients was 68.4 % with 5YEARS of 70.0 %; for female patients 5YEARS was 72.3 %, which was better statistically (Table 3; Fig. 4). Patients more than 80 years old were 7.8 % of all patients, and their 5YEARS was 51.4 % (Table 4; Fig. 5). On the other hand, 5YEARS of the patients under 39 years old was 79.4 % (P < 0.001). Cancer was located in the upper-third of the stomach in 21.1 % of the cases, and its 5YEARS was relatively low at 64.3 % (Table 5; Fig. 6). Patients with type 4 cancer amounted to 7.2 %, and their 5YEARS was markedly low at 17.7 % (Table 6; Fig. 7). The 5YEARS of type 3 was 46.0 % and that of type 2 was 60.4 %. For histological type, frequency of the undifferentiated type including poorly differentiated adenocarcinoma, signet-ring cell carcinoma, and mucinous adenocarcinoma was 46.8 % and its 5YEARS was 65.5 %, which was inferior to that of the differentiated type (75.7 %, P < 0.001; Tables 7, 8; Fig. 8). The grade of lymphatic invasion (ly0–ly3) and venous invasion (v0–v3) showed significant correlations with the prognosis (Tables 9, 10; Fig. 9).
A high incidence of early-stage cancer remained characteristic in 2002, as shown in Tables 11 and 12. The proportion of pathological M and SM (pT1) cancer was 49.7 %, and its primary cause of death was not cancer recurrence (17.9 %, n = 87) or other cancer (18.7 %), but other diseases (49.0 %, n = 238). The proportion of pathological MP and SS (pT2) was 26.8 %, SE (pT3) 19.9 %, and SI (pT4) 3.6 %. The 5YEARS of these subsets were 67.9 %, 30.3 %, and 20.6 %, respectively (Figs. 10, 11). The primary cause of death in advanced cancer was cancer recurrence, and the peritoneal recurrence rate was remarkably high in the pT3 and pT4 subsets. For the lymph node metastasis, the proportion of pN0 was 59.5 %, pN1 20.4 %, pN2 15.9 %, and pN3 4.1 %, and the 5YEARS of each subset was 88.9 %, 58.9 %, 34.6 %, and 14.3 %, respectively (Table 13; Fig. 12).
Peritoneal washing cytology was carried out in 5,836 patients with advanced gastric cancer; the positive rate was 13.0 %. The 5YEARS of cytology-positive (CY1) patients was 12.3 %, which was almost as dismal as the 5YEARS of the P1 patients (8.3 %; Tables 14, 15; Figs. 13, 14). The 5YEARS of patients with liver metastasis (H1) was 11.4 %, and of those with other types of distant metastasis was 12.4 % (Tables 16, 17).
The 5YEARS of the patients stratified by JGCA staging system was 92.2 % for stage IA, 85.3 % for stage IB, 72.1 % for stage II, 52.8 % for stage IIIA, 31.0 % for stage IIIB, and 14.9 % for stage IV. These JGCA 5YEARSs seemed to correlate well with TNM 5YEARSs, which were 92.3 % for stage IA, 84.7 % for stage IB, 70.0 % for stage II, 46.8 % for stage IIIA, 28.8 % for stage IIIB, and 15.2 % for stage IV (Table 18, 19, 20, 21; Figs. 15, 16).
For operative procedures, the proportion of patients who underwent laparoscopic gastrectomy was only 5.1 % in 2002, and their 5YEARS was 93.3 % (Table 22). Eligibility for laparoscopic surgery was strictly limited at that time, and the laparoscopic approach was selected almost exclusively in patients with the preoperative diagnosis of early gastric cancer. Only 1.2 % of the patients were treated by thoracolaparotomy, and their 5YEARS was 35.4 %. Thoracolaparotomy was usually carried out in patients with advanced gastric cancer with esophageal invasion more than 3 cm in length. Total gastrectomy was performed for 30.5 % of the patients, and their 5YEARS was 51.9 % (Table 23). D2 lymph node dissection, a standard procedure for resectable advanced gastric cancer according to the JGCA treatment guidelines, was performed in 49.2 % of the patients (Table 24) [2, 3]. The risk of direct death among those who underwent D2 gastrectomy was only 0.3 %. The proportion of patients treated with less invasive surgery such as proximal gastrectomy, pylorus-preserving gastrectomy, segmental gastrectomy, and local resection of the stomach was 9.8 %. D0, D1, D1 + α, and D1 + β dissection were carried out in 6.5 %, 20.7 %, 13.7 %, and 7.2 % of the patients, respectively. D0 and D1 dissection were carried out mainly in patients with noncurative factors or poor surgical risks. The incidence of positive resection margin (PM+ and/or DM+) was 3.1 % (Table 25). Combined resection of other organs was performed in 35.1 % (Table 26). The frequent combined resected organs in patients who underwent gastrectomy were gallbladder (n = 2121), spleen (n = 1444), caudal pancreas (n = 313), transverse colon (n = 101), liver (n = 96), and so on in descending order (Table 27).
The curative potential of gastric resection was an important prognostic factor. The proportion of patients with no residual tumors with high probability of cure (resection A) was 63.9 %, and their 5YEARS was 88.6 %. On the other hand, patients with definite residual tumors (resection C) amounted to 11.9 % of all patients who underwent laparotomy, and their 5YEARS was 9.9 % (Table 28; Fig. 17).
Fig. 17.

Kaplan–Meier survival of resected cases stratified by curative potential of gastric resection
Discussion
Estimates of the worldwide incidence, mortality, and prevalence of 26 cancers in the year 2002 were available in the GLOBOCAN series of the International Agency for Research on Cancer [4]. With an estimated 934,000 new cases per year in 2002 (8.6 % of new cancer cases), the incidence of stomach cancer is in fourth place, after cancers of the lung, breast, and colon and rectum. It is the second most common cause of death from cancer (700,000 deaths annually).
The data presented in this report were collected from 208 hospitals in Japan. Cancer incidence rate (annual number of newly diagnosed cases per 100,000 population) in Japan in 2002 was approximately 520 for males and 370 for females. The incidences of various cancers in Japan are estimated from data collected by the cancer registry system in a dozen prefectures. According to these statistics, the number of cancer incidences in 2002 was approximately 589,000. The stomach was the leading site (21 %) for males and the second highest site (14 %) for females. The number of new patients who were diagnosed as gastric cancer in 2002 was estimated to be 106,760 [5]. Accordingly, 13,626 patients registered by this program corresponded to approximately 13 % of the whole population affected by gastric cancer in Japan. Even though these patients may not represent the average features of gastric cancer found in this country, this report is considered to have analyzed the largest number of patients for the past 10 years, clarifying the trends of gastric cancer in Japan. Just for reference, the proportion of patients registered in the nationwide registry of other organs of all patients diagnosed were 6 % in colon cancer, 24 % in esophageal cancer, 25 % in liver cancer, and 26 % in lung cancer, respectively [6].
The reliability of the results in this report depends on the quality of data accumulated in the JGCA database. Because of the complexity of the JGCA staging system, the error checking system on the data entry screen did not function completely. In several categories such as lymph node metastasis (N), the JGCA system could not be converted to the TNM system automatically. Therefore, the registration committee had to make great efforts to confirm raw data sent to the data center from the participating hospitals.
As compared with our archived data of 12,004 patients treated in 2001 [1], the proportion of early cancer declined from 51.2 % to 49.7 % [pT1 (M) cancer, 27.4 % to 25.6 %, and pT1 (SM) cancer, 23.8 % to 24.1 %], suggesting that an increasing number of patients with mucosal cancer were sent for endoscopic treatment. These data suggest that we should start to register gastric patients treated with endoscopic mucosal resection (EMR) and/or endoscopic submucosal dissection (ESD) as soon as possible. The surgical mortality within 30 days significantly improved, from 0.6 % to 0.48 % (P < 0.001). Just for reference, it was 4.0 % in 1963 and 1.0 % in 1991 [7], Moreover, the nationwide database of gastrointestinal surgery in 2008 showed that was 0.2 % in gastrectomy and 0.4 % in total gastrectomy [8].
Accordingly with the rapidly aging society in Japan, the proportion of patients more than 80 years old continued increasing (Fig. 18): it was 0.7 % in 1963, 4.9 % in 1990, 7.0 % in 2001, and 7.8 % in 2002, respectively. Although the risk for surgery increases in elderly patients who have comorbidities, evaluations of risk can allow interventions that may decrease morbidity and mortality. Appropriate treatments should be offered to the elderly. However, these data have the intrinsic weakness of being retrospectively collected 7 years after surgery. Unfortunately, we in Japan continue to have a legal difficulty in registering personal information, which is essential for long-term and prospective follow-up. The overall follow-up rate in our program was 83.5 %. In other words, the outcome of 17.5 % of the patients is unknown. The proportion of patients who were lost to follow-up in the Japanese nationwide registry of colon cancer, liver cancer, and thyroid cancer was 19.6 %, 25.8 %, and 20.6 %, respectively [6]. Rules and regulations regarding handling of these data will have to change radically to overcome the issue of accuracy and reliability of the nationwide registry in Japan, and this could be out of the hands of the surgeons who have contributed to the best of their abilities to gather these data. On the other hand, the Japanese Association of Clinical Cancer Centers, consisting of 25 cancer center hospitals, reported that their follow-up rate was 98.5 %, and 5YEARS of 9,980 patients who underwent surgery from 1997 to 2000 were 90.4 % for TNM stage I, 67.8 % for stage II, 43.3 % for stage III, and 9.3 % for stage IV, respectively [9]. When the patients with gastric cancer had a medical examination in clinical cancer centers, they registered the place where their family records were registered, and office workers of the clinical cancer centers confirmed regularly their safety from the family registration; this was the reason for the extremely high follow-up rate. In the current analyses, 5YEARS in stage IV patients was 15.2 %. We might have overestimated our 5YEARS in stage IV patients, but we found that our follow-up rate increased as the stage advanced; the follow-up rate of stage IV patients was 90.4 %. These data suggest that the lower follow-up rate may not have had serious effects on 5YEARSs in our program. Although, the correlation between follow-up rate and survival rate is complicated, our follow-up system needs to be improved if we are to evaluate the survival rates more accurately.
Cytological examination was conducted in 3,481 (59.4 %) of 5,857 patients with T2, T3, or T4 cancer. The 5YEARS of CY1 patients was 12.3 % and their 5YEARS was as poor as that of patients with peritoneal metastasis. Although this examination was not carried out commonly in the days of 2002, it could still be regarded as a significant and independent prognostic factor from the data that were available. These findings further support the need for staging laparoscopy for accurate preoperative staging in patients with advanced gastric cancer.
JGCA restarted a nationwide registration from 2008. The object of the new nationwide registry was primarily to calculate the stage-specific 5YEARSs among patients who underwent gastrectomy. Therefore, the structure of the database was required to be simple, and the number of registration items was kept to a minimum. Undoubtedly, the next objective would be to collect and analyze data of patients with inoperable disease, remnant gastric cancer, gastrointestinal stromal tumor, malignant lymphoma of the stomach, and other entities that were excluded in the current project. We also began to register patients who were treated by EMR/ESD by adding additional items and updating data entry software from 2011.
We hope that this report will be useful when surveying trends and changes in the clinical practice and treatment results of gastric cancer in Japan. Details of the individual data presented in this report will soon become available for scientific and clinical research with the permission of the registration committee. In addition, most of the surgical and pathological data could easily be transferred to the international database in the near future for various analyses. The registration committee will continue the efforts to improve the registration system, ultimately to collect meaningful annual data.
Acknowledgments
The JGCA Registration Committee appreciates the great effort of participating hospitals in registering accurate and detailed data for this project. I wish to express my great gratitude to Ms. Yoshimi Sugamura, Niigata University Medical and Dental Hospital, for her valuable assistance.
Conflict of interest
The authors declare that there are no conflicts of interest related to the contents of this manuscript.
Open Access
This article is distributed under the terms of the Creative Commons Attribution License which permits any use, distribution, and reproduction in any medium, provided the original author(s) and the source are credited.
Appendix: Participating hospitals
Data of gastric cancer patients in this report were collected from the surgical or gastrointestinal departments of the following 208 hospitals (in alphabetical order): Akashi Municipal Hospital, Aomori City Hospital, Asahikawa Medical University Hospital, Cancer Institute Hospital, Chiba Cancer Center, Chiba University Hospital, Dokkyo Medical University Hospital, Ebina General Hospital, Fuchu Hospital, Fujita Health University (Banbuntane Houtokukai Hospital), Fukaya Red Cross Hospital, Fukui Red Cross Hospital, Fukuoka University Chikushi Hospital, Fukuoka University Hospital, Fukushima Medical University Hospital, Gifu Prefectural General Medical Center, Gifu University Hospital, Gunma Prefectural Cancer Center, Gunma University Hospital, Hakodate Goryoukaku Hospital, Hakodate Municipal Hospital, Hamamatsu University School of Medicine, University Hospital, Handa City Hospital, Health Insurance Hitoyoshi General Hospital, Higashiosaka City General Hospital, Himeji Central Hospital, Hiroshima City Asa Hospital, Hiroshima City Hospital, Hiroshima Prefectural Hospital, Hiroshima Red Cross Hospital and Atomic-bomb Survivors Hospital, Hiroshima University Hospital, Hitachi General Hospital, Hokkaido University Hospital, Hoshigaoka Koseinenkin Hospital, Hospital, University of the Ryukyus, Hyogo Cancer Center, Hyogo Prefectural Nishinomiya Hospital, Ibaraki Prefectural Central Hospital, Ibaraki Seinan Medical Center Hospital, Ishikawa Prefectural Central Hospital, Iwate Medical University Hospital, Iwate Prefectural Central Hospital, Iwate Prefectural Kamaishi Hospital, Izumi Municipal Hospital, JA Hiroshima Kouseiren Hiroshima General Hospital, Japanese Red Cross Medical Center, Jikei University School of Medicine, Jikei University Aoto Hospital, Juntendo University Juntendo Hospital, Jusendo Medical Hospital, Kagawa Prefectural Central Hospital, Kagawa Medical University Hospital, Kakogawa Municipal Hospital, Kanagawa Cancer Center, Kanazawa University Hospital, Kansai Electric Power Hospital, Kansai Rousai Hospital, Kawasaki Medical School Hospital, Keio University Hospital, Keiyukai Sapporo Hospital, Kimitsu Chuo Hospital, Kinki Central Hospital, Kinki University Hospital, Kiryu Kosei General Hospital, Kitakyushu Municipal Medical Center, Kobe Century Memorial Hospital, Kobe City Medical Center General Hospital, Kouchi Medical School Hospital, Kumamoto Medical Center, Kumamoto Regional Medical Center, Kumamoto University Hospital, Kurashiki Central Hospital, Kurobe Kyosai Hospital, Kuroishi General Hospital, Kurume University Hospital, Kushiro Rosai Hospital, Kyorin University Hospital, Kyoto Second Red Cross Hospital, Kyoto University Hospital, Kyushu University Hospital, Matsushita Memorial Hospital, Matsuyama Red Cross Hospital, Misawa City Hospital, Mitoyo General Hospital, Miyagi Cancer Center, Mizushima Kyodo Hospital, Muroran City General Hospital, Musashino Red Cross Hospital, Nagahama City Hospital, Nagano Municipal Hospital, Nagano Red Cross Hospital, Nagaoka Chuo General Hospital, Nagasaki Municipal Hospital, Nagoya University Hospital, Nakagami Hospital, Nanpuh Hospital, Nara Medical University Hospital, Nara Hospital, Kinki University Faculty of Medicine, National Cancer Center Hospital, National Defense Medical College Hospital, NHO Ciba Medical Center, NHO Kasumigaura Medical Center, NHO Kyushu Cancer Center, NHO Osaka Medical Center, NHO Sendai Medical Center, NHO Shikoku Cancer Center, NHO Tokyo Medical Center, NHO Yokohama Medical Center, Nihon University Itabashi Hospital, Nihon University Surugadai Hospital, Niigata Cancer Center Hospital, Niigata City General Hospital, Niigata Prefectural Shibata Hospital, Niigata Prefectural Yoshida Hospital, Niigata University Medical and Dental Hospital, Nippon Koukan Hospital, Nippon Medical School Chiba Hokusoh Hospital, Nippon Medical School Hospital, Nishi-kobe Medical Center, NTT West Osaka Hospital, Obihiro Tokushukai Hospital, Oita Red Cross Hospital, Oita University Hospital, Okayama University Hospital, Okitama Public General Hospital, Onomichi Municipal Hospital, Osaka City University Hospital, Osaka General Medical Center, Osaka Kouseinenkin Hospital, Osaka Medical Center for Cancer and Cardiovascular Diseases, Osaka Medical College Hospital, Osaka Police Hospital, Osaka Red Cross Hospital, Osaka Seamen’s Insurance Hospital, Osaka University Hospital, Otsu Municipal Hospital, Otsu Red Cross Hospital, Rinku General Medical Hospital, Sado General Hospital, Saga University Hospital, Saiseikai Chuwa Hospital, Saiseikai Fukuoka General Hospital, Saiseikai Kumamoto Hospital, Saiseikai Niigata Daini Hospital, Saiseikai Noe Hospital, Saiseikai Utsunomiya Hospital, Saitama Medical Center, Saitama Medical Center Jichi Medical University, Saitama Red Cross Hospital, Saitama Social Insurance Hospital, Saku Central Hospital, Sapporo City General Hospital, Sapporo Medical Center, Sapporo Medical University Hospital, Sapporo Social Insurance General Hospital, Sayama Hospital, Seirei Hamamatsu General Hospital, Shakaihoken Kobe Central Hospital, Shiga University of Medical Science Hospital, Shimonoseki City Central Hospital, Shinnittetsu Yahata Memorial Hospital, Shinshu University Hospital, Shizuoka Cancer Center, Showa Inan Hospital, Showa University Northern Yokohama Hospital, Showa University Toyosu Hospital, Social Insurance Central General Hospital, Social Insurance Kinan Hospital, Southern Tohoku General Hospital, St. Luke’s International Hospital, St. Marianna University School of Medicine Yokohama City West Hospital, Suita Municipal Hospital, Sumitomo Hospital, Suwa Red Cross Hospital, Takeda General Hospital, Tochigi Cancer Center, Toho University Ohashi Medical Center, Tohoku University Hospital, Tokushima Municipal Hospital, Tokushima Prefectural Central Hospital, Tokushima University Hospital, Tokyo Medical University Ibaraki Medical Center, Tokyo Metropolitan Bokutoh Hospital, Tokyo Metropolitan Cancer and Infectious Disease Center Komagome Hospital, Tokyo Women’s Medical University (Institute of Gastroenterology), Tokyo Women’s Medical University Hospital, Tokyo Women’s Medical University Medical Center East, Tonami General Hospital, Toranomon Hospital, Tottori Municipal Hospital, Toyama Prefectural Central Hospital, Toyama University Hospital, Toyohashi Municipal Hospital, Tsuchiura Kyodo General Hospital, Tsukuba University Hospital, University Hospital Kyoto Prefectural University of Medicine, University of Fukui Hospital, University of Miyazaki Hospital, University of Yamanashi Hospital, Wakayama Medical University Hospital, Yamachika Memorial General Hospital, Yamagata Prefectural Central Hospital, Yamagata University Hospital, Yamaguchi Rousai Hospital, Yamanashi Prefectural Central Hospital, Yao Municipal Hospital, Yodogawa Christian Hospital, Yokohama City University Hospital, Yokohama City University Medical Center, and Yuri Kumiai General Hospital.
Footnotes
All the authors are members of the Registration Committee of the Japanese Gastric Cancer Association.
References
- 1.Isobe Y, Nashimoto A, Akazawa K, Oda I, Hayashi K, Miyashiro I, et al. Gastric cancer treated in Japan: 2008 annual report of the JGCA nationwide registry. Gastric Cancer. 2011;14:301–316. doi: 10.1007/s10120-011-0085-6. [DOI] [PMC free article] [PubMed] [Google Scholar]
- 2.Japanese Gastric Cancer Association . Gastric cancer treatment guidelines for doctor’s reference (in Japanese). Kanehara: Tokyo; 2001. [Google Scholar]
- 3.Japanese Gastric Cancer Association. Introduction to JGCA gastric cancer treatment guidelines. www.jgca.jp/PDFfiles/E-guideline.PDF.
- 4.Ferlay J, Bray F, Pisani P, Parkin DM. GLOBOCAN 2002: cancer incidence and mortality and prevalence worldwide. IARC Cancer Base No. 5, version 2.0. Lyon: IARC Press; 2004.
- 5.Matsuda T, Marugame T, Kamo K, Katanoda K, Ajiki W, Sobue T, et al. Cancer incidence and incidence rates in Japan in 2002 based on data from 11 population-based cancer registries. Jpn J Clin Oncol. 2008;38:641–648. doi: 10.1093/jjco/hyn074. [DOI] [PubMed] [Google Scholar]
- 6.Higashi T, Sobue T, Nishimoto H. The current status of site-specific cancer registries in Japan. Surg Ther 2011;104(2):169–176 (in Japanese).
- 7.Maruyama K, Kaminishi M, Hayashi K, Isobe Y, Honda I, Katai H, et al. Gastric cancer treated in 1991 in Japan: data analysis of nationwide registry. Gastric Cancer. 2006;9:21–66. doi: 10.1007/s10120-006-0370-y. [DOI] [PubMed] [Google Scholar]
- 8.Goto M, Kitagawa Y, Kimura O, Shimada M, Tomita N, et al. 2008 annual investigational report of the JSGS Database Committee. http://www.jsgs.or.jp/modules/oshirase/index.php?content_id=164.
- 9.Survival rate in the member hospitals of the association of clinical cancer centers (diagnosed in 1997–2000). In: Kato H, Sobue T, Katanoda K, Saito Y, Tukuma H, Saruki N, et al., editors. Cancer statistics in Japan: 2008. Tokyo: Foundation for Promotion of Cancer Research; 2009.