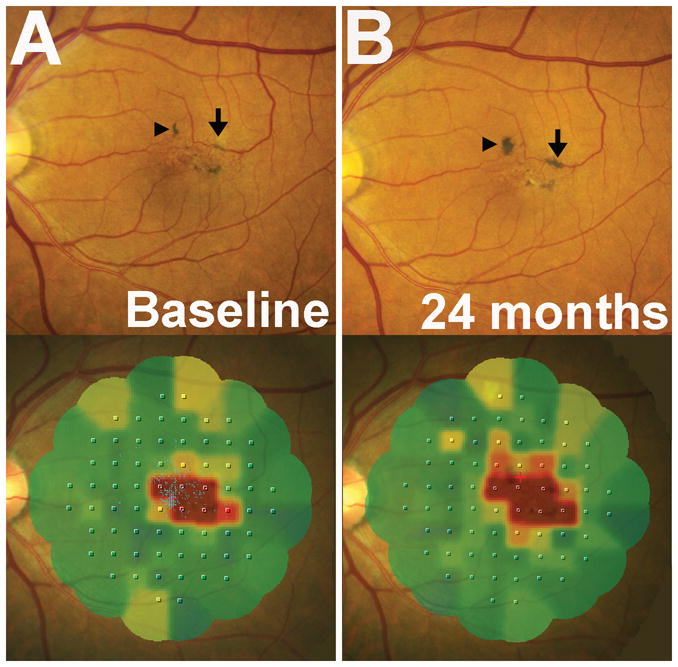
Figure 5. Association of pigment clumping with functional scotomas on microperimetry testing.

Longitudinal fundus photographs and microperimetric evaluations in a study eye with pigment clumping without neovascular changes. (A) The location of areas of pigment clumping observed on fundus photographs (top) are spatially correlated with the location of functional scotomas and decreased retinal sensitivity on microperimetry (MP1) testing (bottom). (B) Progression in the areas of pigment clumping over 24 months in the same eye (arrows in A, B) was also accompanied by an increase in the extent of retinal loci reporting decreased retinal sensitivity. Color coding in MP1 interpolated map output employs green and yellow to represent points of higher retinal sensitivity and orange and red to represent points of lower retinal sensitivity. Red areas on the interpolated map indicate areas of absolute scotoma.
