

Abstract
Cerebellar functional circuitry has been examined in several prior studies using resting fMRI data and seed-based procedures, as well as whole-brain independent component analysis (ICA). Here, we hypothesized that ICA applied to functional data from the cerebellum exclusively would provide increased sensitivity for detecting cerebellar networks compared to previous approaches. Consistency of group-level networks was assessed in two age- and sex-matched groups of twenty-five subjects each. Cerebellum-only ICA was compared to the traditional whole-brain ICA procedure to examine the potential gain in sensitivity of the novel method. In addition to replicating a number of previously identified cerebellar networks, the current approach revealed at least one network component that was not apparent with the application of whole brain ICA. These results demonstrate the gain in sensitivity attained through specifying the cerebellum as a target structure with regard to the identification of robust and reliable networks. The use of similar procedures could be important in further expanding on previously defined patterns of cerebellar functional anatomy, as well as provide information about unique networks that have not been explored in prior work. Such information may prove crucial for understanding the cognitive and behavioral importance of the cerebellum in health and disease.
Keywords: Cerebellar networks, Functional connectivity, fcMRI, ICA
Introduction
Traditionally, the cerebellum was viewed as a region of the brain that is concerned principally with motor control and motor learning (Ito, 1984; Kheradmand and Zee, 2011). More recently, the cerebellum has been acknowledged to contribute to a range of cognitive and behavioral processes. Importantly, reciprocal connections between cerebellum and association cortices, including prefrontal cortex (Middleton and Strick, 1994, 2001) and parietal lobe (Clower et al., 2001), provide the anatomical connectivity that may support cerebellum’s role in higher cortical functions, including cognition and emotion (Allen and Courchesne, 1998; Ivry et al., 2002; Leiner et al., 1993; Schmahmann and Pandya, 1997).
Clinical evidence of the cerebellum’s contribution to cognitive and emotional functioning comes from neuropsychological studies demonstrating deficits in patients with cerebellar compromise due to damage or disease. In particular, lesions of the cerebellar posterior lobe (lobes VI–IX) can result in impairment in executive, visuospatial, linguistic, and affective functions. Collectively, this constellation of clinical symptoms has been termed the Cerebellar Cognitive Affective Syndrome or CCAS (Schmahmann and Sherman, 1998) and, importantly, can occur in the absence of motor impairment (Paulus et al., 2004) or impairment in simple motor learning (Fortier et al., 2000). There is also some evidence of laterality in the presentation of symptoms occurring with cerebellar lesions. For example, language deficits have been reported with damage to the right cerebellar hemisphere (Murdoch, 2010), and this could be expected given the decussation of cerebellar projections at the level of the superior cerebellar peduncle prior to communicating with the rest of the brain (Brodal, 1979).
Classical tract tracing and dissection procedures provided the basis of cerebellar connectivity until recently (Kelly and Strick, 2003; Middleton and Strick, 1994, 2001; O’Reilly et al., 2009; Schmahmann, 1991; Stoodley and Schmahmann, 2009), when neuroimaging was applied to the study of connective anatomy. Two prominent techniques are diffusion tensor imaging (DTI), which provides information about anatomical connectivity, and functional connectivity, which provides information about covariation in functional brain activity. DTI has provided great insights into the connective anatomy of the cerebellum due to the unique contrast within this image to detect major white matter fascicles. For example, Ramnani et al. (2006) used DTI to identify white matter tract projections from the prefrontal cortex to the pontine nuclei in the cortico-ponto-cerebellar system. Unfortunately, DTI data can be limited in areas with complex anatomy, such as with the crossing white matter fibers that are prominent within the cerebellum. Considering the relatively low resolution of the diffusion-weighted images, the exact fiber direction of the white matter tracts at a single voxel can be difficult to resolve using the most common procedures. Functional connectivity methods, by focusing on the time course and covariation of the BOLD signal across the remote areas of the brain, can provide additional insights.
Recently, the analysis of the spatially distributed nature of regional brain activity, measured by blood oxygenation level dependent (BOLD) fMRI during rest, has proven to be a useful technique to discover the “functional connectivity” within and between various cortical and sub-cortical structures. Although for years the primary use of fMRI has been studying stimulus driven or task-related activity, a rapidly accumulating body of literature has demonstrated the utility of resting state neural activity fluctuations for understanding neural organization (Buckner et al., 2008). Coherent fluctuations in BOLD signal across large-scale spatial areas are interpreted to reflect communication across those regions, potentially driven by sensory or motor activity, or to achieve a cognitive or behavioral goal (Biswal et al., 1995; Lowe et al., 1998). Maps of network activity assessed by functional connectivity analysis have been demonstrated to have a basis in anatomical connectivity between associated regions (Krienen and Buckner, 2009; Smith et al., 2009; Sporns et al., 2002).
Current approaches to studying coherence of functional networks of cerebellar activity include seed-based correlational analyses and whole-brain independent component analysis (ICA). Using a seed in the anterior prefrontal cortex (aPFC), Vincent et al. (2008) identified lateral cerebellar involvement in the frontoparietal control system. This system, consisting of anterior prefrontal, dorsolateral prefrontal, dorsomedial superior frontal/anterior cingulate, anterior inferior parietal lobule, and anterior insular cortex, was hypothesized to integrate information from the dorsal attention and hippocampal–cortical memory systems. Recent work has mapped the resting-state connectivity voxel-wise across the cerebellar cortex for a specified set of cortical regions or “masks” (O’Reilly et al., 2009). For example, O’Reilly et al. (2009) identified cortical masks covering prefrontal, motor, somatosensory, posterior parietal, visual and auditory cortices. This analysis revealed two primary zones in the cerebellum: a primary sensory motor zone (lobules V–VII) and a supramodal zone (lobules VIIa, Crus I and Crus II). The latter zone contained overlapping functional connectivity maps for prefrontal and posterior–parietal cortex, suggesting that they could be involved in nonmotor, cognitive and affective function. Buckner et al. (2011) present functional connectivity MRI (fcMRI) evidence demonstrating that almost half of the human cerebellum, including all of Crus I and Crus II, is functionally connected to cerebral association areas involved in the default network (including posterior cingulate, lateral temporal cortex, inferior parietal lobe and medial prefrontal regions) and a cognitive control network (including dorsolateral prefrontal cortex, rostral portion of inferior parietal cortex and a frontal midline area). They further indicate that there is a roughly linear relationship between the extent of cerebral representation of a network and its size (volume) in the cerebellum.
The use of ICA to study resting state connectivity in the brain is gaining momentum (Damoiseaux et al., 2006; De Luca et al., 2006; Habas et al., 2009). Unlike the seed correlation-based approach, ICA is inherently exploratory and data-driven (Beckmann and Smith, 2005; Beckmann et al., 2005). In most cases, implementation of an ICA consists of an iterative algorithm that attempts to explain the BOLD signal with a number of spatially distributed components and their characteristic time courses. Based on the idea that a random mixing results in a more Gaussian-like distribution, the ICA approximates maximally non-Gaussian sources that when combined together explain the observed BOLD signal. In this way, the ICA addresses a limitation of a seed-based correlation analysis that concerns independence of the signals.
Using whole-brain ICA (whbr-ICA) procedures, a system resembling frontoparietal control system was split by Damoiseaux et al. (2006) into left and right hemisphere components (their Fig. 1C and 1D), as would be expected given the anatomy. Habas et al. (2009), applied ICA to whole-brain resting state data from two independent datasets to determine their contribution to a-priori defined connectivity networks in the cortex. The cortical networks had been previously identified as involved in such processes as executive control, episodic memory, salience detection and sensory motor function. Their analysis indicated an association between cerebellar Crus I and Crus II with the executive control networks (bilaterally), lobule VI with the salience network, and lobule IX with the default network. They concluded that the largest portions of the most recently developed neocerebellum, Crus I and Crus II, are involved in the executive control network and are therefore possibly implicated in complex cognitive function.
Fig. 1.
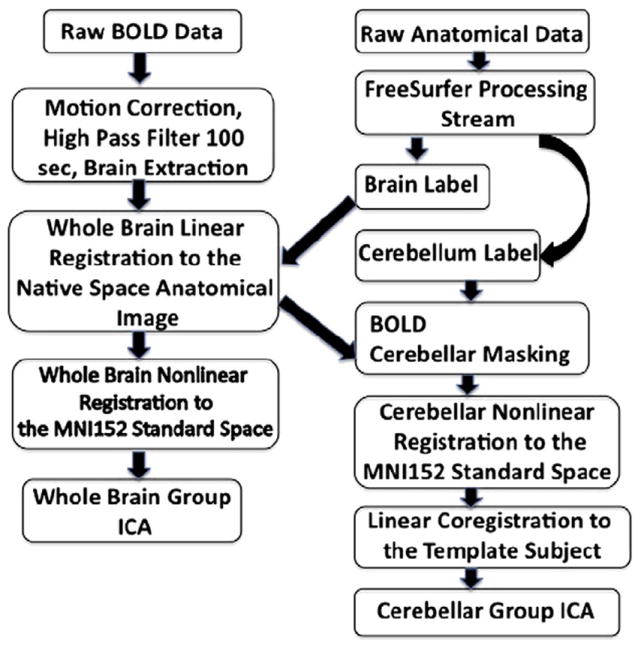
Flowchart highlighting the processing steps involved in crbl-ICA. The first four steps are the same as for the whbr-ICA.
In the current study, we examined whether further elucidation of cerebellar connectivity might be achieved using an ICA approach to resting state fMRI data using a “cerebellum only” approach. Considering that the cerebellum, on average, amounts to only about ten percent of the whole brain volume (Llinas et al., 2003), the sensitivity of ICA procedures for detecting information within the cerebellum may be overpowered by cortical or nuisance signals throughout the rest of the brain that may drive estimation across whole-brain networks. The goal of the current study was to expand on prior data driven approach for the analysis by using ICA restricted to the cerebellum. It was hypothesized that the use of data from the cerebellum exclusively in ICA would provide increased sensitivity for detecting cerebellar networks compared to whole-brain approaches. We examined the consistency of these cerebellar networks in two groups of 25 age-and sex-matched participants. We explored consistency of the cerebellar networks by applying our analysis across the two independent samples, as well as the associated activity in the rest of the brain. We hypothesized that the cerebellum-only approach would provide better sensitivity for detecting cerebellar resting state networks (cRSN) by accounting for the signal variations only in the cerebellum, as opposed to the signals in the entire brain. Even though the ICA detection was originally restricted to the cerebellar volume, the correlated variation in the rest of the brain identified the cerebro-cerebellar functional interactions. We found that the use of the current procedure provided increased sensitivity as well as the potential identification of novel networks not available through whole-brain analysis.
Materials and methods
Participants
The data for this study were obtained from the 1000 Functional Connectomes Project (http://www.nitrc.org/projects/fcon_1000/). All subjects in the present study (n = 50, 29 women/21 men, age = 21.5 ± 2.9) were young healthy adults pseudo-randomly grouped into two sex- and age- matched samples: Group 1 (n = 25, 15 women/10 men, age = 21.6 ± 3.2) and Group 2 (n = 25, 14 women/11 men, age = 21.4 ± 2.7), see Table 1. All imaging was performed on a 3 T scanner with anatomical scans acquired at 1.2×1.2×1.2 mm voxel size and functional scans acquired at 3.0×3.0×3.0 mm voxel size, TR = 3 s.
Table 1.
The “1000 Functional Connectomes” project data for current study.
| Center | PI | N | Subgroups | Age | Sex | Handedness |
|---|---|---|---|---|---|---|
| Cambridge, MA, USA | Randy L. Buckner | 50 | Group 1, n = 25 | 21.6 ± 3.2 | 15 f/10 m | 4 left handed |
| Group 2, n = 25 | 21.4 ± 2.7 | 14 f/11 m | 4 left handed |
Preprocessing
Data processing was carried out using tools from the FMRIB Software Library, FSL (Smith et al., 2004). The raw BOLD data was motion corrected with Motion Correction using FMRIB’s Linear Image Registration Tool (MCFLIRT) (Jenkinson and Smith, 2001) and the brain was extracted using Brain Extraction Tool (BET) (Smith, 2002). Anatomical labels in native space were created using the automated segmentation procedures distributed with the FreeSurfer data processing suite (http://surfer.nmr.mgh.harvard.edu) to isolate cerebellum in the structural scans (Fischl et al., 2002). Fig. 1 shows a detailed flow-chart highlighting the steps involved in processing the cerebellar BOLD signal.
Functional volumes were linearly registered to the MPRAGE data with FLIRT (Jenkinson and Smith, 2001). The cerebellar anatomic label was applied as a mask to the BOLD volumes. The MPRAGE data was then transformed to the MNI152 space with a nonlinear transform computed by FNIRT. While the whole brain non-linear registration to the MNI space performed well on the major cortical regions, in some cases it proved sub-optimal for the cerebellar regions. To account for significant subject variability in cerebellar registration, we performed an additional linear co-registration for every subject’s MNI space cerebellum to a single template subject. Hence, throughout the current paper the results of running cerebellar analyses are displayed on the individual MNI space template cerebellum. Registrations used a cerebellum only atlas for the cerebellum-only time concatenated group ICA (crbl-ICA), and whole brain atlas for whole-brain time concatenated group ICA (whbr-ICA). The same transform was applied to the functional data to bring it into the standard space.
Performing ICA on the cerebellum exclusively (crbl-ICA)
For each replication group independently, group ICA was performed for cerebellum-only data by time-concatenation of each participant’s 4D data. Variance normalization (Beckmann and Smith, 2004), spatial smoothing with a 5 mm filter, resampling to 2 mm spatial resolution, and temporal high-pass filtering with a cut-off frequency of 0.01 Hz were all applied as standard processing for ICA. The data decomposition into Independent Component (IC) maps was achieved using the MELODIC software tool (Beckmann and Smith, 2005; Software Library (FSL); http://www.fmrib.ox.ac.uk/fsl). Instead of limiting the number of components to a fixed number, we used automatic estimation of the number of components available within the MELODIC framework. To further test the consistency of the crbl-ICA networks we performed a bootstrapping procedure where 1000 random groups of 25 subjects each were generated from the original 50 subject dataset and ran through the group crbl-ICA.
Performing ICA on the whole brain (whbr-ICA)
Identical preprocessing and processing steps were used as for the cerebellum-only approach, with the exception of performing the group time-concatenated ICA on the whole brain (i.e. the first four steps outlined in Fig. 1). Network projections from crbl-ICA data were compared to the whbr-ICA results.
Determining consistent cerebellar networks
Identification of consistent resting state networks within the cerebellum required three major steps: (1) matching the cerebellar networks across the two groups following the cerebellum-only ICA (crbl-ICA), (2) elimination of noisy cerebro-cerebellar networks using autocorrelation and frequency spectrum analysis (3) projecting the time series from the crbl-ICA to the rest of the brain, and elimination of noisy cRSNs based on the spatial distribution of the projected cRSNs in the brain.
Cerebellum networks from ICA analysis were assessed for consistency by selecting the components across the two independent groups with the greatest Jaccard index, indicating the greatest overlap in voxels determined to be part of the group level IC network thresholded at z > 3 and binarized. The Jaccard index was defined as:
where A and B represent the matching group level ICs in Group 1 and Group 2, respectively. J(A,B) ranged from 0.77 to 0.02 for all group-level matches across the two samples.
Due to the exploratory nature of ICA, it was expected that some ICs would represent physiological noise. Taking advantage of the low autocorrelation characteristic of white noise, we eliminated ICs with first-order auto-correlation of less than 0.30. This threshold conservatively separated a single matching noise IC component across the two groups from the other IC’s possessing higher autocorrelations, Fig. 2.
Fig. 2.
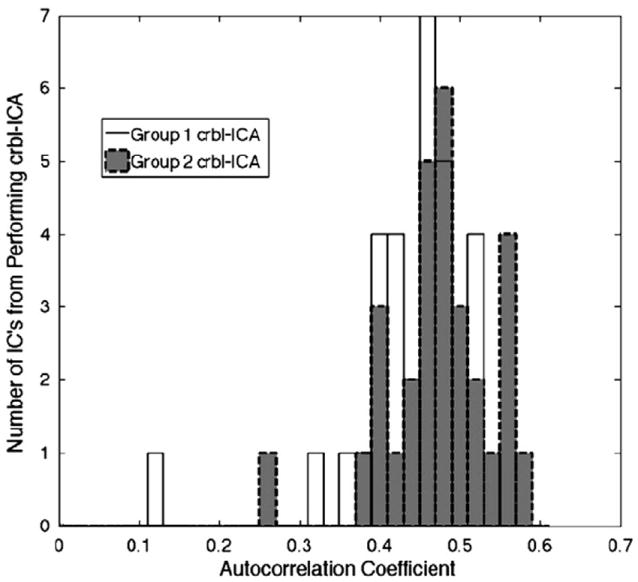
Histogram of autocorrelations in the cRSNs identified in the two groups. A single matching network had autocorrelation of less than 0.30.
Additionally, we computed a metric that was derived from the ratio of signal power within a low-frequency range (0.01 Hz–0.1 Hz) and signal power outside of that range; any ICs with this ratio not exceeding 1.0 were discarded. While the exact frequency range of the resting state BOLD signal has not been defined, previously reported findings by other groups support the frequency range criteria used in the present paper: 0.01–0.08 Hz (Cole et al., 2010) and <0.1 Hz (Zuo et al., 2010), although this procedure limits detection of potentially important networks outside of this range.
Cortical networks derived from cerebellum-only ICA and whole-brain ICA
According to the probabilistic ICA model, the observed BOLD signal represents the linear mixture of hidden sources in the presence of Gaussian noise. Within the general linear model (GLM) framework, the hidden sources correspond to the functional resting state networks characterized by their corresponding time series, also known as the mixing matrix. To simplify modeling of the relevant BOLD signal sources, the Gaussian noise is usually neglected.
When applied to the crbl-ICA, the cerebellar BOLD activity gets decomposed onto a product of a series of cerebellar spatial maps with the mixing matrix. The relationship between the cerebellum-only ICs and the rest of the brain was accessed by multiplying the whole brain BOLD data by the pseudo-inverse of the crbl-ICA mixing matrix, a process we will refer to as projecting the cerebellar time series to the rest of the brain, or unmixing. The resulting whole-brain projected activations were converted to z-value maps. We then overlaid the maps from projecting the results of the crbl-ICA, as well as the whbr-ICA results, on the inflated average brain surfaces computed from multiple coregistered brains in standard space.
Cerebellum-only ICA compared to whole-brain ICA
In order to compare the cerebellar networks produced from the crbl-ICA against whbr-ICA derived maps, we used the template matching procedure described above (Eq. (1)) to match each crbl-IC to whbr-ICs. When matching was performed on the cerebellum level, several of the crbl-ICA networks did not appear to have a whbr-ICA match. Performing the matching on the whole brain level using the whbr-ICA and the projected crbl-ICA revealed the otherwise undetectable match.
Temporal profiles of the cRSNs
One of the concerns for limiting ICA to a smaller region of the brain arises from the possibility of breaking a single cRSN into its constituent parts. If this were the case one would expect the representative signal of the constituent parts of the network to possess similar temporal profile. Performing time-concatenated crbl-ICA decomposed the pre-processed BOLD signal into a set of spatial maps and their associated time courses. For each spatial map, the MELODIC performed a principal component analysis (PCA) to determine the most characteristic time course. Comparing the correlation coefficients for the representative time series of each cRSN provided further insight into their possible interdependence.
Results
Identification of resting state cerebellar networks was determined by crbl-ICA for the two replication groups separately. These analyses resulted in the identification of 30 total ICs for both Group 1 and Group 2. As indicated above, three steps were employed to identify consistent resting-state cerebellar networks.
Step 1: Every IC in Group 1 was paired to the best matching IC counterpart in Group 2 using the Jaccard index and was then arranged in a descending order of magnitude. Thus, matches with the highest Jaccard index represented the most similar networks across the two groups based on the amount of spatial overlap within the thresholded z-value maps
Step 2: Nine ICs were labeled as noise by the automatic procedure based on the autocorrelation and frequency spectrum criteria. Visual inspection confirmed that these components indeed represented noise.
Step 3: To determine the whole-brain components of the remaining twenty one network matches we applied the unmixing matrix to the pre-processed group whole-brain BOLD dataset. While some of the whole brain projections revealed activations within gray matter regions, other ICs projected to known regions of physiological noise such as ventricles, white matter, and CSF around the brain. Only seven cRSNs were consistent across the two groups and visually assessed to project mostly to gray matter regions outside of the cerebellum (Fig. 3 and Table 2).
Fig. 3.
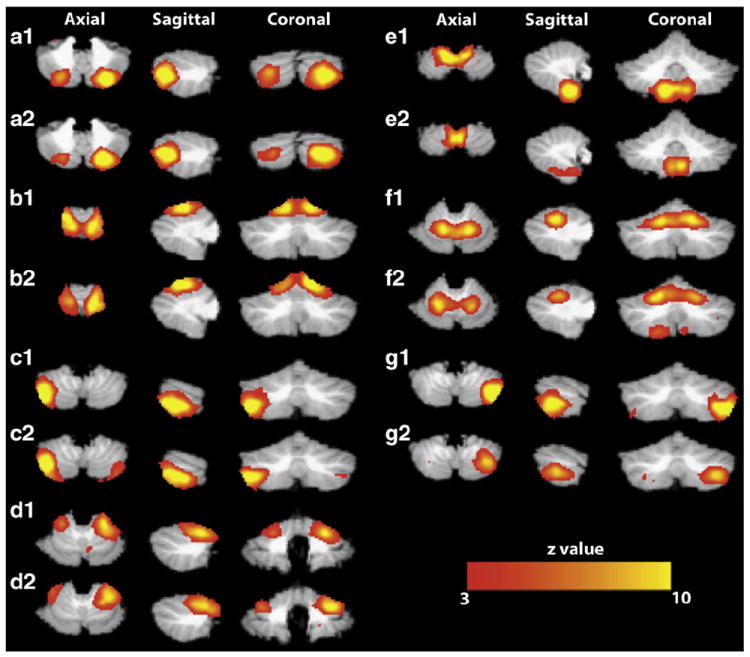
Consistent group-level independent components in the cerebellum for replication Group 1 and Group 2 using crbl-ICA. Panels (a1–g1) display Group 1 cerebellar networks. Panels (a2–g2) display matching Group 2 cerebellar networks. Maps are thresholded at z>3 (equivalent of p<0.01 uncorrected) and presented with the left cerebellar hemisphere to the right of the image. All data is shown in standard space. Networks are labeled with correspondence to the letters in Table 2.
Table 2.
Seven cerebellar regions corresponding to consistent resting-state networks, as determined by cerebellum-only ICA. Regional delineations were determined based on the SUITE probabilistic atlas.
| Network | Right hemisphere | Left hemisphere | Vermis |
|---|---|---|---|
| a | Crus I and Crus II | VI, Crus I, Crus II, and VIIb | – |
| b | V and VI | I–IV, V, and VI | VI |
| c | Crus I, Crus II, VIIb, and IX | – | – |
| d | V and VI | V and VI | – |
| e | VIIIa, VIIIb, and IX | VIIIb, and IX | – |
| f | V and VI | I–IV, V, and VI | VI |
| g | – | Crus I, Crus II, VI, VIIb | – |
Bootstrapping and consistency of the crbl-ICA networks
The results of each group crbl-ICA (n = 1000) were matched to the mean of the corresponding networks from the two original age and sex matched groups reported above. For each match the algorithm selected a top match, as well as the second and third best matches, see Fig. 4.
Fig. 4.
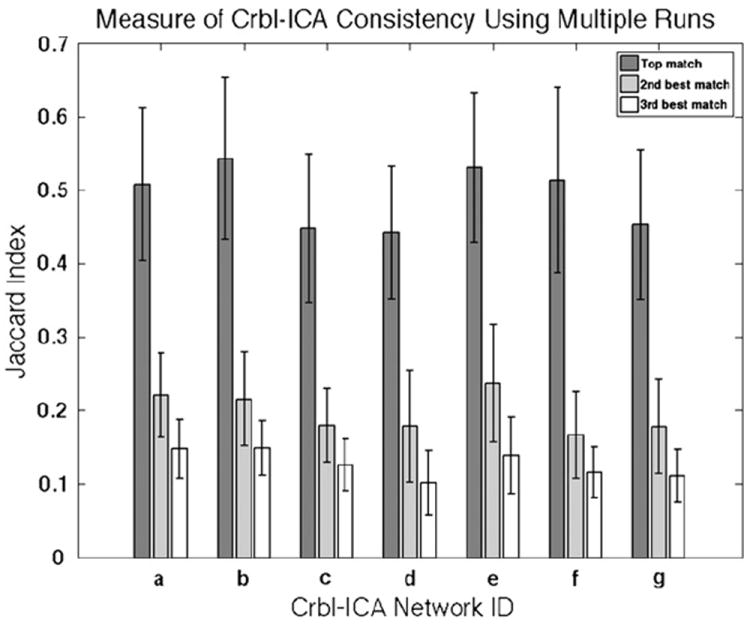
Mean Jaccard index and standard error were computed for performing a bootstrapping group crbl-ICA (n = 1000) and subsequent template matching. Top matches proved to be significantly more accurate (p<0.001) than what could be expected by random chance.
With only noise present in any given match one would expect the Jaccard index for all three matches to be decrementing in a somewhat linear fashion from the top to the third best match. This proved to be not the case as the difference between the Jaccard index of the top and the second best match significantly exceeded (p<0.001) that of the second and third best matches. Thus the Jaccard index values for the top match fell into the 0.44–0.54 range and the corresponding values for what likely represented noise ranged from 0.10 to 0.24. The second best match can also be interpreted as the highest approximation of the Jaccard index resulting from random matching.
Once the consistent resting-state cerebellar networks were determined based on the crbl-ICA, we looked for similar cerebellar networks in the whbr-ICA. The template-matching algorithm was used to determine the whole-brain component having the highest spatial overlap, as determined by the Jaccard index, with each of the projected consistent cerebellar networks. Five of the seven cRSNs shown in Figs. 3 (a, b, c, e, and g) had matching networks identified by the whbr-ICA, shown in Fig. 5. While network (e) derived with crbl-ICA didn’t appear to have a whbr-ICA counterpart at a threshold of z > 3, a match could be seen by lowering the threshold to z > 1.6.
Fig. 5.
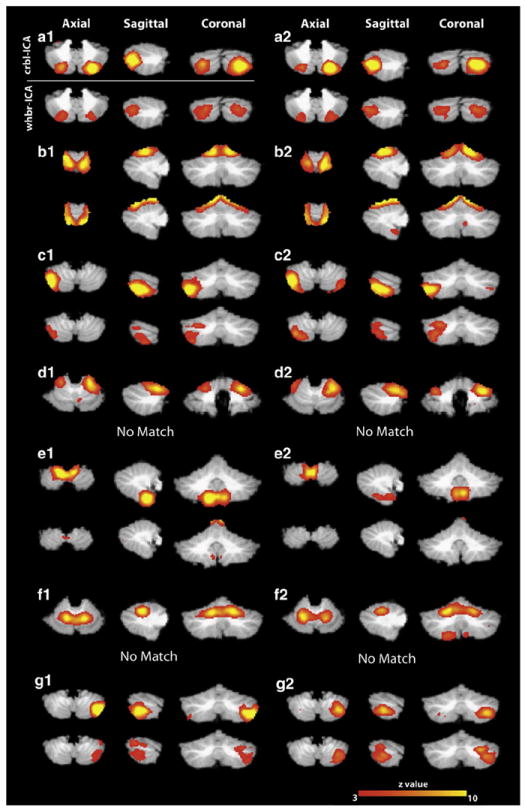
Consistent group-level independent components in the cerebellum identified with the crbl-ICA and the whbr-ICA in Groups 1 and 2. Panels a1-g1 represent cerebellar ICs from Group 1 and panels a2-g2 correspond to matching cerebellar networks from Group 2. For every panel the top row shows the results from running the crbl-ICA and the bottom row corresponds to the results from the whbr-ICA.
Resting state cerebellar networks produced from crbl-ICA and whbr-ICA
Next, we considered the statistical strength of each of the seven cRSNs identified by crbl-ICA, as well as the spatial pattern of activation within the cerebellum. The z-scores were used as a measure of resting state connectivity, with higher z-scores indicating stronger resting-state connectivity within a network.
A non-biased comparison of the two different ICA approaches required creation of separate cerebellar ROI masks for the crbl-ICA and the whbr-ICA. For both the crbl-ICA and the whbr-ICA, the inter-group matching z-score maps were averaged and thresholded at z> 1.6 (p<0.05). Mean voxel intensity within the cerebellar masks was then computed for each of the networks and compared across the two ICA methods, Fig. 6. The whbr-ICA matches to networks (d) and (f) were not used in Fig. 6 as they failed to show inter-group consistency.
Fig. 6.
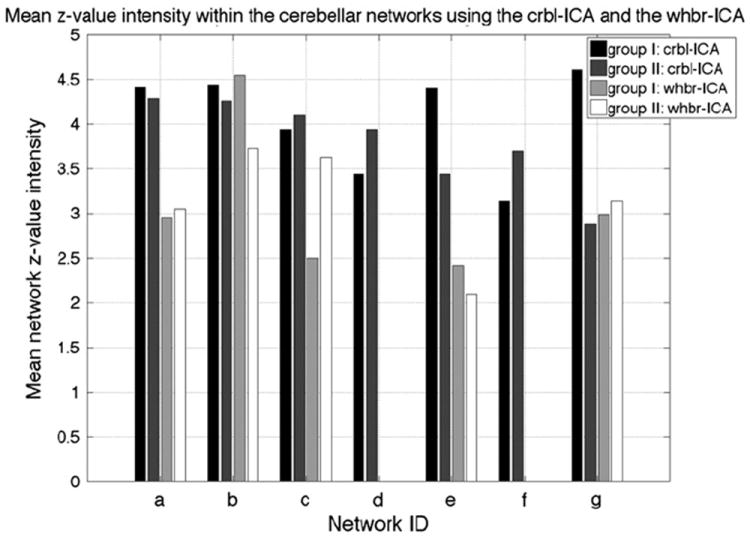
Mean z-value intensity within the cerebellar networks identified using the crbl-ICA and whbr-ICA. Networks a–g here, represent the same networks as shown in Fig. 3. The results from running the crbl-ICA are shown in dark colors, while the whbr-ICA results are shown in lighter colors.
We used the spatially unbiased atlas template of the cerebellum and brainstem (SUIT) (Diedrichsen et al., 2009) to divide the active voxels into region specific bins (see Table 2). This step required an additional linear registration from the MNI space to the SUIT.
Although the cerebellar networks showed regional overlap, there were differences in the number of supra-threshold voxels between the crbl-ICA and whbr-ICA. For example, Fig. 7, Network (a) shows that in the most consistent cRSN, which encompassed primarily Crus I and II, the crbl-ICA detected approximately 3000 more voxels in the left cerebellar hemisphere than did the whbr-ICA. These voxels were in SUIT space and had a spatial resolution of 1.0×1.0×1.0 mm, resulting from up-sampling the original fMRI data to match the SUIT template. In other networks, for example Fig. 7, Network (c) and Fig. 7, Network (g), the whbr-ICA detected more active voxels than the crbl-ICA, suggesting that, overall, the whbr-ICA networks had greater activation compared to crbl-ICA networks but were also more diffuse and less regionally specific. In the two of the seven networks, (d) and (f), whbr-ICA failed to consistently detect any cerebellar counterpart to crbl-ICA identified networks.
Fig. 7.
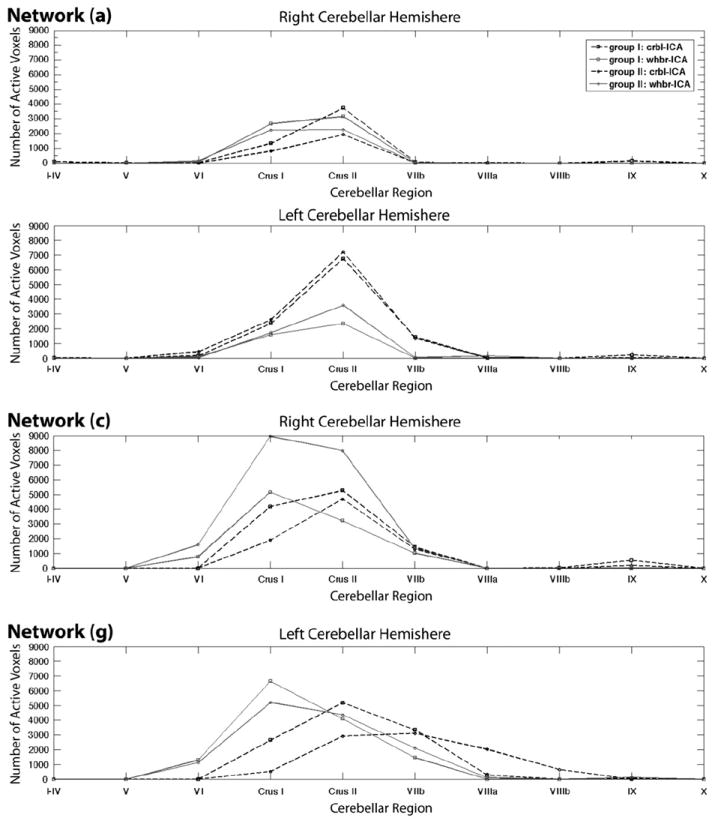
Mean number of active voxels detected within the cerebellar networks differed between the crbl-ICA and the whbr-ICA approaches. Networks (a), (c) and (g) show varying region specific cerebellar activity as detected by the crbl-ICA and the whbr-ICA.
In summary, both crbl-ICA and whbr-ICA produced varying number of active voxels within the matching networks. With a threshold of z>3 (p<0.001), the seven cRSNs identified in the current study with the crbl-ICA accounted for 43.9% of the cerebellar gray matter and 30.2% of the cerebellar white matter. A less conservative threshold of z>1.6 (p<0.05) dilated areas covered by the cerebellar networks to 64.7% of gray matter and 52.7% of white matter.
Using a threshold of z>3 (p<0.001), the five cerebellar networks identified with the whbr-ICA accounted for 34.0% of the cerebellar gray matter and 12.4% of the cerebellar white matter. Decreasing the threshold to z>1.6 (p<0.05), resulted in accounting for the 57.3% of gray matter voxels and 28.5% of white matter voxels in the cerebellum.
Comparison of cerebellar-cortical networks derived from crbl-and whbr-ICA
In Fig. 8 we compare the cortical connectivity derived by the crbl-ICA and whbr-ICA approaches to show the spatial similarity between the two methods and to demonstrate the reproducibility across the two replication groups. However, due to the different techniques employed, the apparent differences in activation magnitude may not reflect true differences. We further investigated cortical involvement with the cRSNs by averaging the projected cRSNs and performing cortical segmentation with the cortical labels supplied with FreeSurfer, Table 3. As an intermediate step, the functional data had to be re-sampled into the FreeSurfer average template space. We only included regions spatially exceeding 216 mm3, or a cube of tissue 2×2×2 functional voxels in size. The within network connectivity could roughly be characterized by the volume of each region as well as its mean z-value displayed in Table 3. For example, regions with higher mean z-values could be interpreted as stronger sources of the observed functional connectivity.
Fig. 8.
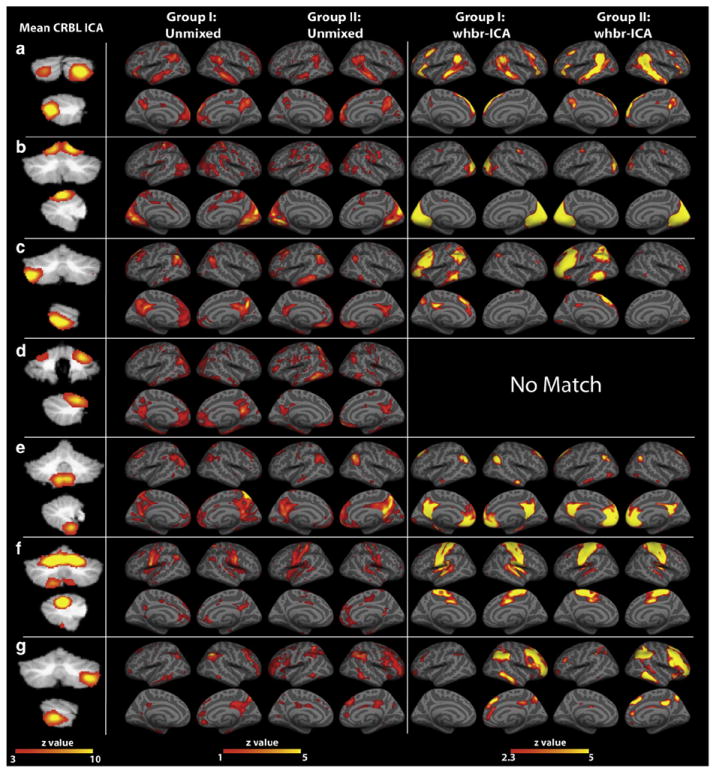
Comparison of the unmixing results from crbl-ICA to the whbr-ICA. Each cerebellar map shown in the first column represents a thresholded mean of the matching networks from Group 1 and Group 2. The second and third columns show the projected components of the crbl-ICA in Group 1. Similarly, columns 4–5 show the projected components of the crbl-ICA in Group 2. Activation maps in the columns 6–9 correspond to the results of running the whbr-ICA on both Group 1 and Group 2, and were matched to the crbl-ICA results. There was not a suitable cortical match for the crbl-ICA component (d) from the whbr-ICA analysis, suggesting that this network may be uniquely visible using the crbl-only ICA approach. Whole brain activations are shown on the inflated average surface of multiple brains co-registered in standard space, available as part of the FreeSurfer data processing suite (http://surfer.nmr.mgh.harvard.edu).
Table 3.
Cortical areas involved in the cRSNs and identified by projecting the crbl-ICA time series onto the whole brain BOLD data.
| Left cortical hemisphere
|
Right cortical hemisphere
|
|||||
|---|---|---|---|---|---|---|
| Anatomical label | Active volume mm3 | Mean z-value | Anatomical label | Active volume mm3 | Mean z-value | |
| Network (a) | Inf. parietal | 562 | 2.21 | Inf. parietal | 400 | 2.22 |
| Isthmus cingulate | 331 | 2.22 | Isthmus cingulate | 569 | 2.54 | |
| Med. orbitofrontal | 299 | 1.94 | Med. orbitofrontal | 861 | 2.08 | |
| Mid. temporal | 1104 | 1.91 | Mid. temporal | 2407 | 2.45 | |
| Parsorbitalis | 317 | 2.28 | Parsorbitalis | 328 | 2.19 | |
| Precuneus | 518 | 2.15 | Precuneus | 1300 | 2.39 | |
| Ros. ant. cingulate | 327 | 2.09 | Lat. obitofrontal | 439 | 1.94 | |
| Ros. mid. frontal | 418 | 2.05 | Ros. mid. frontal | 910 | 2.45 | |
| Sup. frontal | 4109 | 2.23 | Sup. frontal | 7788 | 2.67 | |
| Sup. temporal | 267 | 2.15 | Sup. temporal | 731 | 2.21 | |
| Supramarginal | 1215 | 2.93 | ||||
| Network (b) | Cuneus | 1517 | 2.63 | Cuneus | 1785 | 3.45 |
| Fusiform | 387 | 2.12 | Fusiform | 680 | 2.47 | |
| Inf. parietal | 445 | 1.98 | Inf. parietal | 491 | 1.80 | |
| Lat. occipital | 675 | 1.91 | Precuneus | 650 | 2.22 | |
| Lingual | 3412 | 3.06 | Lingual | 3434 | 3.28 | |
| Pericalcarine | 1288 | 2.98 | Pericalcarine | 1192 | 2.67 | |
| Postcentral | 515 | 2.23 | Postcentral | 706 | 2.47 | |
| Precentral | 216 | 1.96 | Precentral | 590 | 2.04 | |
| Sup. parietal | 1590 | 2.72 | Sup. parietal | 2136 | 2.89 | |
| Supramarginal | 545 | 2.14 | ||||
| Network (c) | Cau. mid. frontal | 1441 | 2.35 | Left-hippocampus | 257 | 1.77 |
| Inf. parietal | 2576 | 3.03 | Inf. parietal | 629 | 2.45 | |
| Inf. temporal | 519 | 1.89 | Pos. cingulate cortex | 244 | 2.08 | |
| Isthmus cingulate | 1231 | 2.87 | Isthmus cingulate | 1229 | 2.44 | |
| Med. orbitofrontal | 2409 | 2.32 | Med. orbitofrontal | 934 | 2.02 | |
| Mid. temporal | 764 | 1.90 | Lateraloccipital | 291 | 2.03 | |
| Precuneus | 1573 | 2.44 | Precuneus | 1472 | 2.32 | |
| Ros. ant. cingulate | 268 | 1.87 | ||||
| Ros. mid. frontal | 2534 | 2.32 | ||||
| Sup. frontal | 5970 | 2.70 | Sup. frontal | 894 | 2.04 | |
| Frontalpole | 450 | 2.23 | ||||
| Network (d) | Hippocampus | 508 | 1.93 | Hippocampus | 522 | 1.94 |
| Amygdala | 523 | 2.25 | Amygdala | 423 | 2.14 | |
| Cuneus | 267 | 2.11 | ||||
| Entorhinal | 459 | 2.05 | Entorhinal | 347 | 1.92 | |
| Fusiform | 3031 | 2.54 | Fusiform | 1174 | 2.24 | |
| Inf. parietal | 1449 | 2.49 | Inf. parietal | 697 | 1.89 | |
| Inf. temporal | 1129 | 2.10 | Inf. temporal | 841 | 1.99 | |
| Isthmus cingulate | 482 | 2.15 | Isthmus cingulate | 528 | 2.38 | |
| Lat. occipital | 1098 | 2.03 | Lat. occipital | 314 | 1.84 | |
| Lat. orbitofrontal | 246 | 1.74 | ||||
| Med. orbitofrontal | 1864 | 2.14 | Med. orbitofrontal | 1071 | 2.01 | |
| Mid. temporal | 340 | 1.89 | ||||
| Parahippocampal | 337 | 1.95 | Parahippocampal | 331 | 1.96 | |
| Postcentral | 357 | 1.99 | Postcentral | 217 | 1.80 | |
| Precuneus | 1162 | 2.17 | Precuneus | 954 | 2.22 | |
| Sup. frontal | 1224 | 2.14 | Precentral | 234 | 1.90 | |
| Sup. parietal | 1459 | 2.47 | Temporalpole | 456 | 2.02 | |
| Frontalpole | 433 | 2.07 | ||||
| Network (e) | Inf. parietal | 606 | 2.06 | Inf. parietal | 410 | 1.83 |
| Lingual | 817 | 2.04 | Lingual | 843 | 2.03 | |
| Pericalcarine | 251 | 1.84 | Pericalcarine | 547 | 1.91 | |
| Precuneus | 759 | 2.56 | Precuneus | 1382 | 2.67 | |
| Ros. mid. frontal | 637 | 1.90 | Ros. mid. frontal | 261 | 1.93 | |
| Sup. frontal | 977 | 1.97 | Sup. frontal | 1101 | 1.85 | |
| Sup. parietal | 1345 | 2.52 | Sup. parietal | 2197 | 2.64 | |
| Cuneus | 383 | 1.80 | ||||
| Isthmus cingulate | 230 | 1.83 | ||||
| Paracentral | 242 | 2.35 | ||||
| Network (f) | Postcentral | 3573 | 2.24 | Postcentral | 3041 | 2.25 |
| Precentral | 2879 | 2.32 | Precentral | 3626 | 2.45 | |
| Sup. frontal | 1693 | 2.23 | Sup. frontal | 1023 | 1.92 | |
| Sup. temporal | 611 | 1.79 | Sup. temporal | 785 | 2.26 | |
| Supramarginal | 349 | 1.82 | Sup. parietal | 342 | 2.40 | |
| Insula | 573 | 1.87 | ||||
| Network (g) | Inf. parietal | 1022 | 1.98 | Inf. parietal | 1804 | 3.29 |
| Ros. mid. frontal | 606 | 1.99 | Ros. mid. frontal | 3520 | 2.27 | |
| Pos. cingulate cortex | 266 | 2.07 | ||||
| Cau. mid. frontal | 1212 | 2.07 | ||||
| Inf. temporal | 287 | 2.09 | ||||
| Isthmus cingulate | 382 | 1.90 | ||||
| Parsorbitalis | 312 | 2.73 | ||||
| Pos. cingulate | 399 | 1.96 | ||||
| Sup. frontal | 902 | 1.92 | ||||
| Supramarginal | 1686 | 2.70 | ||||
Overall, we found matching whbr-ICA networks for six of the seven crblr-ICA projected networks. However, in the case of network (d) as identified with the crbl-ICA projected methodology, we did not observe a corresponding cortical network using the whbr-ICA approach with a threshold of z>3.
It is also evident in Fig. 8 that using the whbr-ICA approach we identified a cortical network (f) that does not appear to have a cerebellar component, as we did not find a match for crbl-ICA network (f). This did not appear to be simply due to a threshold limitation because, as shown in Fig. 9, neither Group 1 nor Group 2 showed clear evidence of a matching whbr-ICA network (f).
Fig. 9.
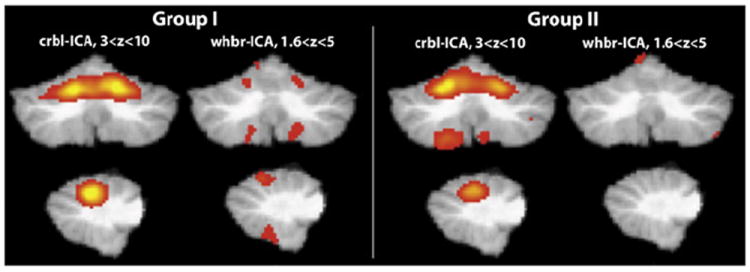
Crbl-ICA and whbr-ICA were performed and the projected cortical network for the crbl-ICA was matched to the corresponding whbr-ICA. In Group 1, the whbr-ICA cerebellar activations could only be detected when decreasing the threshold of the network to a low value. The whbr-ICA failed to detect any matching cerebellar activity in Group 2. With the crbl-ICA the network described above was identified in both Group 1 and Group 2.
We examined connectivity of the cRSNs with pontine and red nuclei by visually inspecting the mean of the matching cortical projections from the two groups. Out of the seven cRSNs only network (b) appeared to have activation in the red nucleus. The involvement of the red nucleus as the relay for transferring cerebellar output suggests that network (b) plays a role in the feedback loop.
Temporal profiles of the cRSNs
The seven cRSNs identified in the current analysis showed varying degree of correlation as seen in Table 4. While none of the cRSNs showed strong temporal correlation, networks (a) and (b) were each weakly correlated to several networks. Network (a) positively correlated with networks (c) and (g), and negatively with network (b). On the other hand network (b) positively correlated with network (d) and negatively correlated with network (c).
Table 4.
Time course correlation coefficients for the seven crbl-ICA networks. Five strongest correlation coefficients are shown in gray.
| a | 1.00 | ||||||
| b | −0.25 | 1.00 | |||||
| c | 0.32 | −0.31 | 1.00 | ||||
| d | −0.06 | 0.30 | −0.11 | 1.00 | |||
| e | 0.01 | 0.03 | −0.12 | 0.14 | 1.00 | ||
| f | −0.08 | 0.17 | −0.10 | 0.21 | −0.01 | 1.00 | |
| g | 0.28 | −0.14 | 0.07 | −0.08 | 0.17 | −0.03 | 1.00 |
| a | b | c | d | e | f | g |
Discussion
The current study applied independent component analysis procedures to MRI resting state functional data derived exclusively from the cerebellum to identify consistent resting-state cerebellar networks and their functional connectivity with the rest of the brain. In addition, we investigated, the extent to which sensitivity in detecting cerebellum functional connectivity was increased using a cerebellum only ICA approach. The existence of resting state cerebro-cerebellar connectivity was confirmed by finding similar networks across the two independent samples, both with regard to activity within cerebellum as well as to the remainder of the brain. The cerebellum-only procedure produced seven resting state networks within cerebellum that were reliable across the two independent groups. Five of the seven networks were apparent using the whole-brain analysis (networks a, b, c, e, and g). These findings suggest that the novel procedure may be an important step towards understanding the functional neuroanatomy of the cerebellum and its contribution to behavior and cognition in health and disease.
Consistent resting state-cerebellar networks in the current study
This study identified seven distinct resting-state cerebellar networks using cerebellum-only ICA shown in Fig. 3. The identified networks were spatially localized to a small set of cerebellar regions, as confirmed by the probabilistic cerebellar atlas (Table 2).
Network (a)
Network (a) encompassed primarily Crus I and Crus II, bilaterally, with greater activation in left cerebellum hemisphere that extended to VI and VIIb. In a previous study, Fransson (2005) observed right cerebellar involvement in the default mode network (Figure 4 in his paper). His finding is somewhat consistent with the network (a) in the present study. One of the key differences is the bilateral cerebellar involvement in the default mode network identified in the present study and in Buckner et al. (2011) but not in the Fransson (2005) study.
Krienen and Buckner (2009) have identified prefrontal cortex (PFC) connectivity with the Crus I cerebellar region by placing the seed in the cerebellum and computing the correlation map with the rest of the brain. Their approach is limited by the size and shape of the seed, as well as its placement. In the comparison of the default-mode network (DMN) connectivity identified by performing seed-based correlation analysis at different seed voxel locations proposed in the literature, Cole et al. (2010) observed large non-overlapping activation regions varying based on the placement of the seed. In their Figure 2, Cole et al. (2010) showed that the ICA-derived DMN had highest mean spatial correlation with the other three estimates of the DMN, and thus benefited from the lack of bias inherent in the seed based analyses. However, recent whole brain seed analysis of the cortex may reduce such limitations (Buckner et al., 2011).
To the best of our knowledge, the exact cerebro-cerebellar connectivity revealed as network (a) here has not been reported before in the functional neuroimaging literature.
Network (b)
Network (b) covered cerebellar lobules V and VI bilaterally, left cerebellar lobules I–IV, as well as vermis region VI.
On the cerebellar level, the network (b) shared similar spatial features with the sensorimotor network in Habas et al. (2009; their Fig. 2). The similarity did not extend to the cerebral regions, as the network (b) involved primarily occipital cortex, superior parietal and to a lesser degree precentral and postcentral cortices. The sensorimotor network discussed in Habas et al. (2009) covered mostly sensorimotor cortex, premotor cortex, supplementary motor area, anterior cingulate cortex, temporal cortex, insula, and to a lesser degree the occipital cortex.
Cerebellar bilateral activation in regions V and VI corresponded to part of the visual network identified by O’Reilly et al. (2009). Activity in the lower part of the cerebellar visual network identified in O’Reilly et al. was not replicated in the present study. Krienen and Buckner (2009) and Buckner et al. (2011) did not detect cerebellar connectivity with primary auditory and visual cortices. Also of note, although network (b) in the current study shows strong overall connectivity with regions within occipital cortex, it is highly likely that these associated regions are, to some degree, the overlapping signal from the immediately adjacent occipital cortex, as described by Buckner et al. (2011). Future high resolution studies of the cerebellum will be necessary to tease apart these effects.
The spatial distribution of network (b) on the cortical level somewhat resembled the networks previously identified by Beckmann et al. (2005), Damoiseaux et al. (2006; their Figure 2E), and Zuo et al. (2010; their Figure 1E). Comparison on the cerebellar level with the above mentioned studies could not be performed as they did not discuss any cerebellar activation for the network of interest.
Network (c) and network (g)
The cerebellar areas identified as network (c) were limited to the right cerebellar hemisphere, and consisted primarily of Crus I–II, and to a lesser degree, lobules VIIb and IX. The cerebellar areas identified as network (g) were mostly limited to the left cerebellar hemisphere, and consisted of Crus I–II, and lobules VI and VIIB.
Cerebro-cerebellar connectivity reported as networks (c) and (g) here was previously identified in Krienen and Buckner (2009) by placing a seed in the right dorsolateral prefrontal cortex and left dorsolateral prefrontal cortex respectively. Parts of these two networks were identified in Beckmann et al. (2005) as dorsal visual stream. Damoiseaux et al. (2006) identified similar networks (their Figure 2C and Figure 2D) using tensor probabilistic ICA. Networks (c) and (g) reported in the present paper strongly resembled the right executive control network (ECN) and left ECN respectively, reported in Habas et al. (2009). Network (g) reported in the present paper matched the parietal network involved in cognition and language identified in Zuo et al. (2010; their IC 07, Figure 2). Importantly, as described by Krienen and Buckner (2009), these networks were lateralized and projected to the contra-lateral associated cortical regions.
Network (d)
The spatial distribution of network (d) encompassed bilateral cerebellar lobules V and VI.
Network (d) links bilateral cerebellar regions V and IV, as well as vermis region VI to parietal, frontal, temporal, and occipital lobes. Judging by the spatial extent and mean z-value, the following regions appear to drive the cerebro-cerebellar connectivity of the network (d): bilateral fusiform gyri, inferior parietal cortices, inferior temporal cortices, medial orbitofrontal cortices, precuneus, and left lateral occipital cortex, superior frontal cortex, and left superior parietal cortex. To the best of our knowledge, cerebro-cerebellar connectivity identified by network (d) has not been reported in the fMRI literature. If this connectivity proves to be neurologically relevant then it would further support cerebellar involvement in higher order cognitive function.
Network (e)
Cerebellar areas covered by network (e) consisted of bilateral lobules VIIIb and IX in addition to a minor activation of the right lobule VIIIa.
The connectivity between the cerebellar lobule IX bilaterally with the dorsomedial prefrontal cortex and the posterior cingulate cortex was previously reported by Habas et al. (2009) and Damoiseaux et al. (2006) as part of the default mode network. In the current study, the cerebellar component of network (e) also included lobule VIIIb bilaterally and a minor activation in the right hemisphere of lobule VIIIa. On the other hand, we did not find any cerebellar lobule VIIb activity reported in Habas et al. (2009).
The cortical part of network (e) overlapped significantly with the cortical part of network (a). The similarity between the two networks points to the possibility of separate cerebellar networks projecting to the same cortical regions involved in the “default mode” system, yet performing different tasks. While cerebellum may participate in several “default mode” subsystems, it is likely that it has a varying strength of participation in each. The current approach intrinsically focuses on detecting the most consistent cerebellar networks and therefore is more likely to detect the strongest cerebellar contribution to the relevant “default mode” subsystem.
Network (f)
Network (f) consisted of bilateral cerebellar lobules V and VI, and included left lobules I–VI.
Habas et al. (2009) reported connectivity of the cerebellar region VI with the sensorimotor areas in the brain. In the current study, we identified that left and right cerebellar region V, as well as vermis region VI were part of the sensorimotor network. We speculate that this type of increased sensitivity may represent an advantage of the crbl-ICA over the whbr-ICA. However, the utility of these procedures for defining functional and anatomical principles of the cerebellum is yet to be elucidated and the use of these procedures to understand diseases that affect the cerebellum such as alcoholism is ongoing.
The combined networks occupied 43.9–64.7% of the cerebellar gray matter and 30.2–52.7% of the cerebellar white matter, depending on setting the threshold either to z<3 (p<0.001) or to 1.6<z (p<0.05), respectively. Topography of the cerebellar networks followed a previously observed separation into medial and lateral areas and a portion of these networks showed laterality. Four of the seven networks, (b), (d), (e) and (f), mainly consisted of the medial regions and the other three networks, (a), (c), and (g), were mainly distributed in the lateral cerebellar regions. With the exception of the left ECN and right ECN, the rest of the cRSNs were bilateral.
Confirmation of previously identified functional connectivity networks
The cerebro-cerebellar connectivity identified by network (a) supports previous findings by O’Reilly et al. (2009) that the Crus I and the Crus II cerebellar regions projected to the prefrontal and parietal areas of the brain. However, the exact pattern of cerebro-cerebellar connectivity in network (a), reminiscent of the “default mode”, has not been reported previously.
Networks (b) and (f) in the current study support the previously reported connectivity between the cerebellar regions V and VI, with the visual and the sensorimotor cortices (O’Reilly et al., 2009). While the template matching algorithm found a whbr-ICA match to the projection of the network shown in Fig. 8f, the matching whbr-IC did not have any voxels in the cerebellum surviving 3<z<10. The effect of lowering the threshold is discussed shortly.
We visually inspected the output of the crbl-ICA for any networks matching the five cRSNs (sensorimotor network, default mode network, left ECN, right ECN, and the salience network) mentioned by Habas et al. (2009). Four of the five networks that they reported were identified in the current study: (c) right ECN, (e) default mode network (f) sensorimotor network, and (g) left ECN, Fig. 8. To confirm the whbr-ICA match to the crbl-ICA network (e), we lowered the threshold from z>3 (p<0.001) to z>1.6 (p<0.05). With the whbr-ICA, the sensorimotor cerebellar network was identified in Group 1 after lowering the threshold to 1.6<z<5, as seen in Fig. 9. No sensorimotor cerebellar network was identified in Group 2 using the whbr-ICA. Possible factors that may account for the difference in findings include the following procedures performed by Habas et al. and not performed in the present study: low-pass filtering at 2.8 s, fixing the number of group-level ICs to 30, and including only right handed subjects. Also, in the present study we focused on the identification of the consistent cRSNs between the two age and sex matched subject groups, without considering the subject level ICA results.
Cerebellum-only ICA vs. whole-brain ICA
One of the key features of the current study was that the analysis centered on the cerebellum. Overall, whole brain and cerebellar ICA produced similar networks. When compared with the whole brain procedure, the cerebellum only procedure generally demonstrated stronger connectivity within the cerebellum. In addition, a portion of the cerebellar only networks were not apparent in the whole brain analysis.
We compared this technique to whole brain procedures applied in prior work and found an obvious trade-off between the cerebellum and the cortex. While the cerebellar networks identified with the crbl-ICA were in general visually similar to the results of the whbr-ICA, a closer analysis revealed some detectable and quantifiable differences as seen in Figs. 6 and 7. The most accurate replication of the crbl-ICA with the whbr-ICA was observed in network (a), Fig. 7. The mean z-value intensity within the cerebellar networks indicated the relative connectivity strength of the detected networks. In most cases, the connectivity within the networks detected by the crbl-ICA exceeded that of the networks detected by the whbr-ICA, Fig. 6. Two of the networks, (d) and (f), detected by the crbl-ICA failed to be consistently identified by the whbr-ICA.
Of particular interest are the two networks (a) and (c) where the crbl-ICA detected more voxels than the whole-brain ICA, Fig. 7, Network (a), bottom panel, and vice versa, Fig. 7, Network (c). In the Crus II region of the left cerebellar hemisphere of network (a), crbl-ICA detected more than 3000 active voxels than the whbr-ICA. Considering the 1.0×1.0×1.0 mm spatial resolution of the SUIT template, this difference translates into a cube of cerebellar tissue with a side greater than 14 mm. Even more puzzling evidence comes from the difference of more than 6000 active voxels detected by the whbr-ICA in the right Crus I region of network (c) in Group 2, and not detected by the crbl-ICA. This difference translates into a cube of cerebellar tissue with ~18 mm side. The fact that in one case crbl-ICA detected more cerebellar activity than the whbr-ICA and in the other case less, excludes the possibility of threshold bias accounting for such a different result. The correspondence of the cerebellar networks detected by the two methods is also confirmed by the noticeably similar region-specific pattern of cerebellar activity seen in Figs. 5a and c. When projected to the rest of the brain, these two cerebellar networks also match the results from the whbr-ICA as seen in Figs. 8a and c, further ruling out the possibility that the cerebellum-only ICs were not properly matched to the whole-brain ICs. The basic interpretation here is that the two procedures produce different results, and further work will need to expand on the differential benefits of each technique.
Neuroanatomic significance
Most of the cerebro-cerebellar connectivity described in the current study is in agreement with earlier neuroanatomical literature. Connectivity of the cerebellar lobules IV and VI with motor cortex and the cerebellar Crus II with dorsolateral prefrontal cortex has been previously reported using transneural transport of neurotropic viruses by Kelly and Strick (2003). While this doesn’t necessarily imply the exact topographic correspondence with networks (f), (c), and (g) in the current study, it nevertheless provides potential neuroanatomic basis for such connections. Our findings only partially overlap with previous report from Schmahmann (1991). Their approach involved injecting tritiated amino acids into lateral, medial, and ventral prefrontal cortices of 15 rhesus monkeys and thus tracing the cerebro-ponto-cerebellar neuronal pathway. Networks (c) and (g) in the current study correspond well with the dorsolateral and medial prefrontal cortex connectivity with the pons reported by Schmahmann (1991). However we found cerebellar connectivity with orbitofrontal cortex and the adjacent ventral prefrontal cortex identified in the current study as networks (d) and (e) and not reported by Schmahmann (1991). Projections to the basis pontis from the superior temporal region identified by Schmahmann (1991) support temporal lobe counterparts of the crbl-ICA networks (a), (c), (d), (f) and (g) in the current study. Earlier neuroanatomical studies have also identified cerebellar connectivity with various regions of the parietal cortex (May and Andersen, 1986). In the current study we confirmed parietal region contributions to whole brain projections of all seven crbl-ICA networks. The existence of such extensive inter-connectivity emphasizes the variety of functions the cerebellum may participate in, ranging from motor planning to higher order cognitive tasks. Additional evidence for the connectivity of the cerebellar flocculonodular lobe with the cingulate and insular cortices comes from the virus tracing studies in rodents (Kaufman et al., 1996). Similar connectivity was identified as network (e) in the current study, spanning large areas of the posterior cingulate cortex and a small patch of the insular cortex. Unlike Kaufman et al. (1996) the connectivity of network (e) also implicates dorsomedial prefrontal cortex. These results further hint at cerebellar involvement with the limbic system of the brain.
The vermis has been previously reported to be involved in saccades and pursuit initiation (Kheradmand and Zee, 2011). Networks (b) and (f) in the current study showed functional connectivity in the lobule (VI) of the vermis, with a limitation that network (b) was likely due to partial volume effects from the occipital cortex. These two networks projected primarily to the occipital lobe and the sensorimotor cortex respectively, possibly implicating them in ocular motor control. Both network (b) and (f) also spanned small subregions of the cingulate cortex thus providing further evidence for the cerebellar vermial involvement in limbic functions.
Projecting cerebellar networks onto the rest of the brain vs. whole-brain ICA
Performing the unmixing on the whole-brain fMRI data using the time course information from the distinct cerebellar networks identified with cerebellum-only ICA achieved three goals: 1) tracing cerebro-cerebellar connectivity, and, 2) showing the uniqueness of the cerebellar networks 3) confirmed previously published findings regarding cerebro-cerebellar connectivity.
The absence of strong correlation between the cRSNs provided further evidence that they were functionally distinct from each other. This finding supports the notion that while the cortical projections of some cRSNs overlap spatially (i.e., networks (c), (d), and (e)), they potentially serve a different purpose.
Conclusions
Our primary objective in this study was to explore cerebro-cerebellar resting state functional connectivity using a novel method focused on functional coherence limited to the cerebellum. The results show that the consistent cerebellar networks identified in the present study provide more unique information than the cerebellar networks identified with the more traditional whbr-ICA and seed based analyses. We speculate that the proposed crbl-ICA provides a gain in temporal and spatial sensitivity leading to a better detection of functional connectivity across the brain that could be useful in detecting conditions that preferentially affect the cerebellum such as alcoholism.
Acknowledgments
This work was supported by grants from the National Institutes of Health, including National Institute of Alcoholism and Alcohol Abuse (R01 14205 to RM); National Institute of Nursing Research (R01 NR 010827 to DS); National Institute of Neurological Disease and Stroke (K23NS062148 to EL) and the National Institute on Aging (K23AG034258 to CF). Additionally, this work was supported by the Veterans Administration Merit Service Award to RM and by the VA Rehabilitation Research and Development Service TBI Center of Excellence to RM and WM.
References
- 1000 Functional Connectomes Project. http://www.nitrc.org/projects/fcon_1000/
- Allen G, Courchesne E. The cerebellum and non-motor function: clinical implications. Mol Psychiatry. 1998;3:207–210. doi: 10.1038/sj.mp.4000395. [DOI] [PubMed] [Google Scholar]
- Beckmann CF, Smith SM. Probabilistic independent component analysis for functional magnetic resonance imaging. IEEE Trans on Medical Imaging. 2004;23(2):137–152. doi: 10.1109/TMI.2003.822821. [DOI] [PubMed] [Google Scholar]
- Beckmann CF, Smith SM. Tensorial extensions of independent component analysis for multisubject FMRI analysis. NeuroImage. 2005;25:294–311. doi: 10.1016/j.neuroimage.2004.10.043. [DOI] [PubMed] [Google Scholar]
- Beckmann CF, DeLuca M, Devlin JT, Smith SM. Investigations into resting-state connectivity using independent component analysis. Philos Trans R Soc Lond B Biol Sci. 2005;360:1001–1013. doi: 10.1098/rstb.2005.1634. [DOI] [PMC free article] [PubMed] [Google Scholar]
- Biswal B, Yetkin FZ, Haughton VM, Hyde JS. Functional connectivity in the motor cortex of resting human brain using echo-planar MRI. Magn Reson Med. 1995;34:537–541. doi: 10.1002/mrm.1910340409. [DOI] [PubMed] [Google Scholar]
- Brodal P. The pontocerebellar projection in the rhesus monkey: an experimental study with retrograde axonal transport of horseradish peroxidase. Neuroscience. 1979;4:193–208. doi: 10.1016/0306-4522(79)90082-4. [DOI] [PubMed] [Google Scholar]
- Buckner RL, Andrews-Hanna JR, Schacter DL. The brain’s default network: anatomy, function, and relevance to disease. Ann N Y Acad Sci. 2008;1124:1–38. doi: 10.1196/annals.1440.011. [DOI] [PubMed] [Google Scholar]
- Buckner RL, Krienen FM, Castellanos A, Diaz JC, Yeo BT. The organization of the human cerebellum estimated by intrinsic functional connectivity. J Neurophysiol. 2011;106:2322–2345. doi: 10.1152/jn.00339.2011. [DOI] [PMC free article] [PubMed] [Google Scholar]
- Clower DM, West RA, Lynch JC, Strick PL. The inferior parietal lobule is the target of output from the superior colliculus, hippocampus, and cerebellum. J Neurosci. 2001;21:6283–6291. doi: 10.1523/JNEUROSCI.21-16-06283.2001. [DOI] [PMC free article] [PubMed] [Google Scholar]
- Cole DM, Smith SM, Beckmann CF. Advances and pitfalls in the analysis and interpretation of resting-state FMRI data. Front Syst Neurosci. 2010;4:8. doi: 10.3389/fnsys.2010.00008. [DOI] [PMC free article] [PubMed] [Google Scholar]
- Damoiseaux JS, Rombouts SA, Barkhof F, Scheltens P, Stam CJ, Smith SM, Beckmann CF. Consistent resting-state networks across healthy subjects. Proc Natl Acad Sci U S A. 2006;103:13848–13853. doi: 10.1073/pnas.0601417103. [DOI] [PMC free article] [PubMed] [Google Scholar]
- De Luca M, Beckmann CF, De Stefano N, Matthews PM, Smith SM. fMRI resting state networks define distinct modes of long-distance interactions in the human brain. NeuroImage. 2006;29:1359–1367. doi: 10.1016/j.neuroimage.2005.08.035. [DOI] [PubMed] [Google Scholar]
- Diedrichsen J, Balsters JH, Flavell J, Cussans E, Ramnani N. A probabilistic MR atlas of the human cerebellum. NeuroImage. 2009;46:39–46. doi: 10.1016/j.neuroimage.2009.01.045. [DOI] [PubMed] [Google Scholar]
- Fischl B, Salat DH, Busa E, Albert M, Dieterich M, Haselgrove C, van der Kouwe A, Killiany R, Kennedy D, Klaveness S, Montillo A, Makris N, Rosen B, Dale AM. Whole brain segmentation: automated labeling of neuroanatomical structures in the human brain. Neuron. 2002;33:341–355. doi: 10.1016/s0896-6273(02)00569-x. [DOI] [PubMed] [Google Scholar]
- Fortier CB, Disterhoft JF, McGlinchey-Berroth R. Cerebellar cortical degeneration disrupts discrimination learning but not delay or trace classical eyeblink conditioning. Neuropsychology. 2000;14:537–550. doi: 10.1037//0894-4105.14.4.537. [DOI] [PubMed] [Google Scholar]
- Fransson P. Spontaneous low-frequency BOLD signal fluctuations: an fMRI investigation of the resting-state default mode of brain function hypothesis. Hum Brain Mapp. 2005;26:15–29. doi: 10.1002/hbm.20113. [DOI] [PMC free article] [PubMed] [Google Scholar]
- Habas C, Kamdar N, Nguyen D, Prater K, Beckmann CF, Menon V, Greicius MD. Distinct cerebellar contributions to intrinsic connectivity networks. J Neurosci. 2009;29:8586–8594. doi: 10.1523/JNEUROSCI.1868-09.2009. [DOI] [PMC free article] [PubMed] [Google Scholar]
- Ito M. The modifiable neuronal network of the cerebellum. Jpn J Physiol. 1984;34:781–792. doi: 10.2170/jjphysiol.34.781. [DOI] [PubMed] [Google Scholar]
- Ivry RB, Spencer RM, Zelaznik HN, Diedrichsen J. The cerebellum and event timing. Ann N Y Acad Sci. 2002;978:302–317. doi: 10.1111/j.1749-6632.2002.tb07576.x. [DOI] [PubMed] [Google Scholar]
- Jenkinson M, Smith S. A global optimisation method for robust affine registration of brain images. Med Image Anal. 2001;5:143–156. doi: 10.1016/s1361-8415(01)00036-6. [DOI] [PubMed] [Google Scholar]
- Kaufman GD, Mustari MJ, Miselis RR, Perachio AA. Transneuronal pathways to the vestibulocerebellum. J Comp Neurol. 1996;370(4):501–523. doi: 10.1002/(SICI)1096-9861(19960708)370:4<501::AID-CNE7>3.0.CO;2-8. [DOI] [PubMed] [Google Scholar]
- Kelly RM, Strick PL. Cerebellar loops with motor cortex and prefrontal cortex of a nonhuman primate. J Neurosci. 2003;23:8432–8444. doi: 10.1523/JNEUROSCI.23-23-08432.2003. [DOI] [PMC free article] [PubMed] [Google Scholar]
- Kheradmand A, Zee DS. Cerebellum and ocular motor control. Front Neurol. 2011;2:53. doi: 10.3389/fneur.2011.00053. [DOI] [PMC free article] [PubMed] [Google Scholar]
- Krienen FM, Buckner RL. Segregated fronto-cerebellar circuits revealed by intrinsic functional connectivity. Cereb Cortex. 2009;19:2485–2497. doi: 10.1093/cercor/bhp135. [DOI] [PMC free article] [PubMed] [Google Scholar]
- Leiner HC, Leiner AL, Dow RS. Cognitive and language functions of the human cerebellum. Trends Neurosci. 1993;16:444–447. doi: 10.1016/0166-2236(93)90072-t. [DOI] [PubMed] [Google Scholar]
- Llinas RR, Walton KD, Lang EJ. Cerebellum. In: Shepherd GM, editor. The Synaptic Organization of the Brain. Oxford University Press; New York: 2003. [Google Scholar]
- Lowe MJ, Mock BJ, Sorenson JA. Functional connectivity in single and multi-slice echoplanar imaging using resting-state fluctuations. NeuroImage. 1998;7:119–132. doi: 10.1006/nimg.1997.0315. [DOI] [PubMed] [Google Scholar]
- May JG, Andersen RA. Different patterns of corticopontine projections from separate cortical fields within the inferior parietal lobule and dorsal prelunate gyrus of the macaque. Exp Brain Res. 1986;63(2):265–278. doi: 10.1007/BF00236844. [DOI] [PubMed] [Google Scholar]
- Middleton FA, Strick PL. Anatomical evidence for cerebellar and basal ganglia involvement in higher cognitive function. Science. 1994;266:458–461. doi: 10.1126/science.7939688. [DOI] [PubMed] [Google Scholar]
- Middleton FA, Strick PL. Cerebellar projections to the prefrontal cortex of the primate. J Neurosci. 2001;21:700–712. doi: 10.1523/JNEUROSCI.21-02-00700.2001. [DOI] [PMC free article] [PubMed] [Google Scholar]
- Murdoch BE. The cerebellum and language: historical perspective and review. Cortex. 2010;46:858–868. doi: 10.1016/j.cortex.2009.07.018. [DOI] [PubMed] [Google Scholar]
- O’Reilly JX, Beckmann CF, Tomassini V, Ramnani N, Johansen-Berg H. Distinct and overlapping functional zones in the cerebellum defined by resting state functional connectivity. Cereb Cortex. 2009;20:953–965. doi: 10.1093/cercor/bhp157. [DOI] [PMC free article] [PubMed] [Google Scholar]
- Paulus KS, Magnano I, Conti M, Galistu P, D’Onofrio M, Satta W, Aiello I. Pure post-stroke cerebellar cognitive affective syndrome: a case report. Neurol Sci. 2004;25:220–224. doi: 10.1007/s10072-004-0325-1. [DOI] [PubMed] [Google Scholar]
- Ramnani N, Behrens TE, Johansen-Berg H, Richter MC, Pinsk MA, Andersson JL, Rudebeck P, Ciccarelli O, Richter W, Thompson AJ, Gross CG, Robson MD, Kastner S, Matthews PM. The evolution of prefrontal inputs to the cortico-pontine system: diffusion imaging evidence from Macaque monkeys and humans. Cereb Cortex. 2006;16:811–818. doi: 10.1093/cercor/bhj024. [DOI] [PubMed] [Google Scholar]
- Schmahmann JD. An emerging concept. The cerebellar contribution to higher function. Arch Neurol. 1991;48:1178–1187. doi: 10.1001/archneur.1991.00530230086029. [DOI] [PubMed] [Google Scholar]
- Schmahmann JD, Pandya DN. The cerebrocerebellar system. Int Rev Neurobiol. 1997;41:31–60. doi: 10.1016/s0074-7742(08)60346-3. [DOI] [PubMed] [Google Scholar]
- Schmahmann JD, Sherman JC. The cerebellar cognitive affective syndrome. Brain. 1998;121(Pt 4):561–579. doi: 10.1093/brain/121.4.561. [DOI] [PubMed] [Google Scholar]
- Smith SM. Fast robust automated brain extraction. Hum Brain Mapp. 2002;17:143–155. doi: 10.1002/hbm.10062. [DOI] [PMC free article] [PubMed] [Google Scholar]
- Smith SM, Jenkinson M, Woolrich MW, Beckmann CF, Behrens TE, Johansen-Berg H, Bannister PR, De Luca M, Drobnjak I, Flitney DE, Niazy RK, Saunders J, Vickers J, Zhang Y, De Stefano N, Brady JM, Matthews PM. Advances in functional and structural MR image analysis and implementation as FSL. NeuroImage. 2004;23(Suppl 1):S208–S219. doi: 10.1016/j.neuroimage.2004.07.051. [DOI] [PubMed] [Google Scholar]
- Smith SM, Fox PT, Miller KL, Glahn DC, Fox PM, Mackay CE, Filippini N, Watkins KE, Toro R, Laird AR, Beckmann CF. Correspondence of the brain’s functional architecture during activation and rest. Proc Natl Acad Sci U S A. 2009;106:13040–13045. doi: 10.1073/pnas.0905267106. [DOI] [PMC free article] [PubMed] [Google Scholar]
- Sporns O, Tononi G, Edelman GM. Theoretical neuroanatomy and the connectivity of the cerebral cortex. Behav Brain Res. 2002;135:69–74. doi: 10.1016/s0166-4328(02)00157-2. [DOI] [PubMed] [Google Scholar]
- Stoodley CJ, Schmahmann JD. Functional topography in the human cerebellum: a meta-analysis of neuroimaging studies. NeuroImage. 2009;44:489–501. doi: 10.1016/j.neuroimage.2008.08.039. [DOI] [PubMed] [Google Scholar]
- Vincent JL, Kahn I, Snyder AZ, Raichle ME, Buckner RL. Evidence for a frontoparietal control system revealed by intrinsic functional connectivity. J Neurophysiol. 2008;100:3328–3342. doi: 10.1152/jn.90355.2008. [DOI] [PMC free article] [PubMed] [Google Scholar]
- Zuo XN, Kelly C, Adelstein JS, Klein DF, Castellanos FX, Milham MP. Reliable intrinsic connectivity networks: test–retest evaluation using ICA and dual regression approach. Neuroimage. 2010;49:2163–2177. doi: 10.1016/j.neuroimage.2009.10.080. [DOI] [PMC free article] [PubMed] [Google Scholar]