Abstract
Computationally efficient modeling of complex neuromuscular systems for dynamics and control simulations often requires accurate analytical expressions for moment arms over the entire range of motion. Conventionally, polynomial expressions are regressed from experimental data. But these polynomial regressions can fail to extrapolate, may require large datasets to train, are not robust to noise, and often have numerous free parameters. We present a novel method that simultaneously estimates both the form and parameter values of arbitrary analytical expressions for tendon excursions and moment arms over the entire range of motion from sparse datasets. This symbolic regression method based on genetic programming has been shown to find the appropriate form of mathematical expressions that capture the physics of mechanical systems. We demonstrate this method by applying it to (i) experimental data from a physical tendon-driven robotic system with arbitrarily routed multiarticular tendons and (ii) synthetic data from musculoskeletal models. We show it outperforms polynomial regressions in the amount of training data, ability to extrapolate, robustness to noise, and representation containing fewer parameters – all critical to realistic and efficient computational modeling of complex musculoskeletal systems.
Index Terms: moment arm, tendon excursions, symbolic regression, polynomial regression, extrapolation
I. Introduction
Computational modeling of complex musculoskeletal systems is sensitive to accurate representation of tendon routing, insertion points, and moment arm values [1], [2]. The most commonly used technique to obtain moment arm variations over the range of motion of a joint is the tendon and joint displacement method [3]. Implementation of this method generally involves fitting explicit analytical expressions for tendon excursions as functions of joint angles. Tendon excursions arise from changes in length of a musculotendon either due to active contraction or passive stretching. Hence they are directly related to muscle length changes and the maximal force a muscle can generate, as determined by the force-length properties [4]. Moment arms over the range of motion can then be obtained by taking partial derivatives of these tendon excursion expressions with respect to the corresponding joint angle changes. This standard approach has been used extensively in the literature to understand the contribution of different muscles towards the production of joint torque and limb motion (Eg. [5], [6], [7], [8]). It has also been used to validate musculoskeletal models representing bone geometry and musculotendon pathways [9], [10]. Simulation of musculoskeletal dynamics for the development and testing of theories of motor control also specifically require analytical expressions for tendon excursions and moment arms as functions of joint angles [11], [2]. Very often, dynamic equations of the system (which include the moment arm functions) need to be evaluated iteratively (perhaps tens of thousands of times) to solve for an optimal control law for each cost function and task goal [12]. Such algorithms require accurate, computationally-efficient analytical expressions for moment arms for the entire range of motion.
Analytical expressions for moment arms and tendon excursions are of two kinds: (i) Idealized geometric models, or (ii) Empirical models. The coefficients of the analytical expressions in both these approaches are regressed from experimental data. These data consist of joint angles and tendon excursion measurements, often obtained from cadaveric specimens [5], [3], [6], [13], [14], [8]. In the first case, idealized geometric models, tendon routings are approximated by simple geometric shapes and the mathematical forms of the expressions are derived using trigonometry (Eg. [15], [16], [17]). While this might be sufficient to obtain approximate values of moment arms and tendon excursions in some simple cases, it may not necessarily be accurate for all muscles and is heavily dependent on assumptions about the anatomy. It is likely not appropriate for the complex routing of many tendons around joints, as well as non-uniform bone geometry, deformity, surgical modification and injury. Therefore, most studies in biomechanics use the second approach: empirical models. These almost always consist of polynomial expressions (including splines, which are piecewise polynomials stitched together) mapping joint angles to tendon excursions, and are regressed from experimental measurements, such as using cadaveric specimens [6], [13], [14], [8], [18], [19]. But these polynomial regressions have several inherent mathematical pitfalls; they can fail to extrapolate, may require large datasets to train, are not robust to noise, and often have numerous free parameters [20]. Hence they may not be the best choice to model multiple degree-of-freedom biomechanical systems where (i) obtaining a rich dataset from the entire range of motion can be difficult [21], (ii) data are generally sparse and contain noise from measurement errors and skin deformations [22], [23], and (iii) are susceptible to common errors in the estimation of axes of joint rotation and accurate joint angles [24]. In addition, polynomial functions are inherently a type of mathematical expression that is likely not reflective of the geometry and physics of tendon routing which even in the ideal case often contain trigonometric functions [15].
Here we present a novel method to find analytical functions for tendon excursions and moment arms as functions of joint angles that does not assume a specific mathematical form apriori. Rather, it simultaneously estimates directly from experimental data both appropriate mathematical forms of the analytical expressions for moment arms and tendon excursions, and their best-fit parameter values. Previously we have called attention to the need for biomechanical modeling to go beyond parameter estimation and engage in the search for appropriate model forms [25]. Here we show an example of how to perform this simultaneous search of mathematical form, i.e. the structure consisting of mathematical building blocks; and parameter values, i.e. the coefficients and other constants accompanying each building block of the mathematical expression, using a software package called Eureqa (http://creativemachines.cornell.edu/eureqa). Eureqa implements symbolic regression using genetic programming [26]. While symbolic regression and genetic programming have been used for over 15 years [27] in the field of machine learning, Eureqa is a recent improvement that ensures faster convergence and more accurate solutions [28], [29]. Unlike other machine learning techniques that use a ‘black box’ approach to model input-output relationships, Eureqa has been shown to obtain computationally efficient, analytical expressions that can capture the physics of the system being modeled. In this paper, we compare polynomial regression (the state-of-the-art used by the musculoskeletal modeling community to represent these systems) to our method. We apply the traditional polynomial regression approach and our novel machine learning method to both experimental data from a multi-articular tendon-driven robotic system, and computer-generated synthetic data from many simulated musculoskeletal systems with experimentally realistic noise added.
II. Methods
A. Symbolic regression using genetic programming
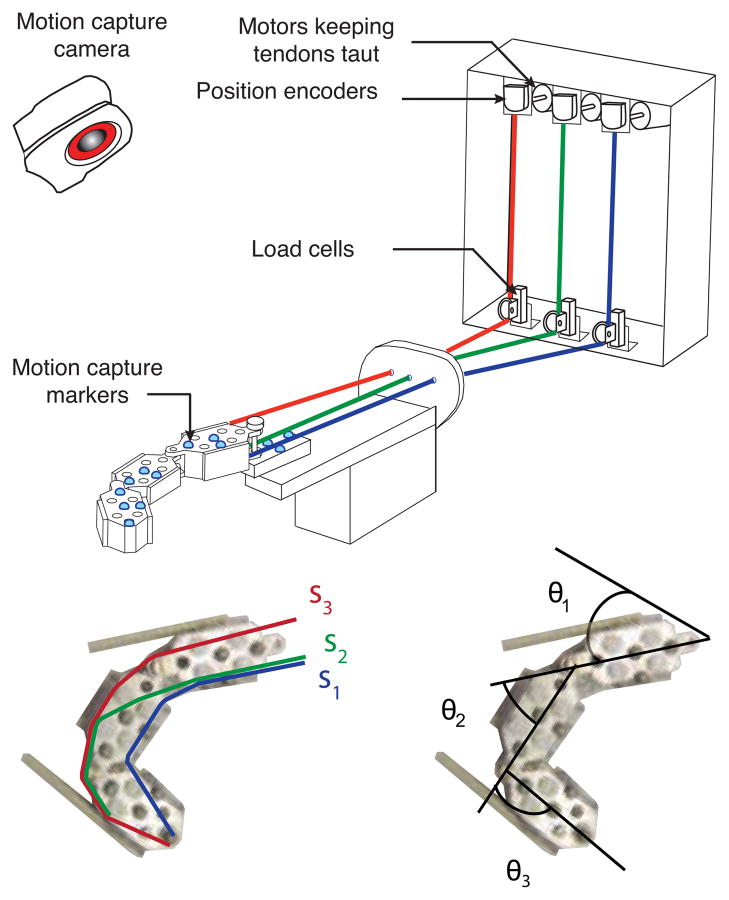
Symbolic regression is a machine learning technique that searches the space of mathematical operators, functions and parameter values to obtain analytical expressions that model available data based on a fitness criterion [27]. Evolutionary algorithms are generally used to guide this search in what is an infinite dimensional space. Here we use a software package called Eureqa that performs symbolic regression using genetic programming to infer implicit and explicit analytical functions to model input-output data [26]. In our case, Eureqa searches for explicit analytical expressions of the form s = f (θ) mapping joint angles, θ to each tendon’s excursion s (Fig. 1). The three joint angles and the excursion of the tendon of interest at any time step constitute a data point. Many such data points from the entire time series of the experiment form a dataset. We use sum of deviations of inferred analytical function predictions for the tendon excursions from true measurements (coming from experimental testing or computer simulation) over an entire dataset as the fitness criterion, i.e. the fitness-error to be minimized. In addition to this, Eureqa also penalizes the equation-complexity, defined as the sum of the number of parameters and terms in the analytical expressions being inferred. The search space consists of analytical expressions formed by parameter values and combinations of mathematical operations performed on the input variables (θ). In our case, we restricted the mathematical operations to addition, subtraction, multiplication, division, sine, cosine, tangent and square root1. Polynomial expressions are automatically generated by repeated multiplication of the input variables. In addition, Eureqa uses the concept of coevolution of fitness predictors, described in detail in [28], for faster and improved convergence of solutions. Instead of using the entire time history of the training dataset to calculate the fitness of evolving analytical expressions, it finds and uses a small set of data points (called fitness predictors) that can best distinguish between analytical expressions of otherwise equal fitness. Fitness predictors are chosen in every generation of evolution in parallel with the search for analytical expressions modeling the experimental data.
Fig. 1.
A three-joint planar robotic system with three arbitrarily routed tendons was moved manually to span a range of joint angles. The tendon excursions were recorded and joint angles calculated from motion capture data.
Unlike conventional optimization that would minimize fitness-error in a ‘single line search’ and find either the global minimum or one of the local minima of the fitness landscape, Eureqa uses multi-objective optimization to produce a family of multiple ‘optimal’ analytical expressions (15–20 expressions) that map joint angles to the tendon excursions. Each analytical expression has different levels of fitness-error and equation-complexity (defined above). This family of analytical expressions constitutes a Pareto front of fitness-error vs. equation-complexity. In this multi-objective optimization, the tradeoffs between the fitness criteria are made explicit to the user. The advantage of this approach is that it provides multiple analytical expressions that may be more or less sparse, accurate, computationally efficient, or revealing of the physics of the problem – either of which may be given more weight as ‘optimal’ by the user as desired. We chose to define as the optimal solution the one analytical expression that had the lowest extrapolation error (root mean squared error when tested with data points outside the range of training datasets). However, the user is free to weigh other aspects more heavily. Our choice was driven by the need for analytical functions to have the ability to extrapolate as it ensures that they are capturing the physics of the system and not simply overfitting to the training data points. Each search in Eureqa starts with an initial set of multiple, random analytical functions, and terms are added/subtracted in discrete steps as the search progresses. Eureqa provides the support to run a search very easily on parallel computers that are connected in a network without requiring any special network architecture or hardware. On average, we ran each search in parallel for 12 hours on 20 computers (Dual Dualcore AMD Opteron 2.0 GHz ) at the USC High-Performance Computing and Communications (www.usc.edu/hpcc) computer cluster. As is necessary in most machine learning problems without closed-form solutions, a stopping/convergence criterion needs to be defined. We defined the search to have converged if the fitness of the solution with the lowest fitness error remained unchanged for more than two hours. We repeated the entire search five times to test for consistency of results. The family of ‘optimal’ solutions was not necessarily of identical form in every repeat but of different representations of functions that modeled the data best with consistent RMS errors.
B. Comparison against polynomial regression
The state-of-the-art technique is to regress tendon excursions as polynomial functions of joint angles (Eg. [6], [13], [14], [8], [18]). We regressed the coefficients of multivariable linear, quadratic, cubic and quartic polynomials (all cross terms considered) using MATLAB © (Version R2009b, Math-Works, Natwick, MA). Polynomials of order greater than four overfit to the training data and performed worse than polynomial regressions of lower orders, and hence were not considered in this paper. This is also the case with spline functions, which are piecewise polynomials stitched together [9]. Moreover, to evaluate dynamic equations of the system, for example to solve for an optimal controller, simple analytical functions modeling the behavior of the system throughout the range of motion are required. Splines or other piecewise surface fits would not be not suitable for this purpose and hence were not considered in this paper. We compared the performance of analytical expressions from the multivariable linear, quadratic, cubic and quartic regressions against those from symbolic regression by testing with a cross-validation dataset (data points not selected for training, but within the range of training) and an extrapolation dataset (data points outside the range of training). We used root mean squared (RMS) error between the true tendon excursions (experimentally measured or simulated) and the analytical function predictions (coming from symbolic or polynomial regressions), normalized by the range of movement for that tendon and expressed as a percentage, as the fitness error criterion for the comparison. RMS errors were determined for cross-validation and extrapolation datasets.
C. Experimental data from a tendon-driven robotic system
We used a planar robotic finger with three links, three joints and three tendons to produce the motion capture data (Fig. 1). The three tendons were routed such that the first tendon flexed all joints (similar in action to the flexor digitorum profundus in the human finger), the second tendon, extended one joint and flexed the remaining two joints (similar to an intrinsic tendon) and the third tendon, extended all joints (similar to the extensor digitorum communis). We moved the robotic finger manually to span the full three-dimensional joint configuration space of flexion-extension in a human finger. Servo dc motors maintained a constant tension of 1.5 N in every tendon to prevent tendons from going slack. As we moved the robotic finger, optical encoders measured tendon excursions at a sampling frequency of 10 Hz. A 6-camera optical motion capture system, manufactured by Vicon (Lake Forest, CA), tracked reflective markers adhered to each segment of the robotic finger at a frequency of 30 Hz. The mean calibration residual error of the marker position reconstruction was less than 0.2 mm. We processed the 3D coordinates of the markers generated by the Vicon Nexus software to obtain joint angle changes for the entire duration of movement and then downsampled them to 10 Hz.
We then partitioned the datasets to test for robustness of the inferred analytical expressions to (1) size of the training dataset and (2) range of extrapolation.
Reducing the size of the training dataset: We divided the experimental data into training, cross-validation and extrapolation datasets (training and cross-validation datasets coming from the same range of data and the extrapolation dataset consisting of data points outside the range of training). Then, we created nine independent training datasets by systematically reducing the number of training data points keeping the range fixed (n, n/2, n/3, etc. in Fig. 3). We performed symbolic and polynomial regressions using these nine different training datasets and tested the resulting analytical expressions with the fixed cross-validation and extrapolation datasets. This was repeated five times for each training dataset, for each tendon (S1, S2 and S3), by re-sampling the training data points with replacement (Eureqa picked multiple random initial analytical functions at the beginning of each search). This was done to ensure that the observed results were consistent and not simply due to chance.
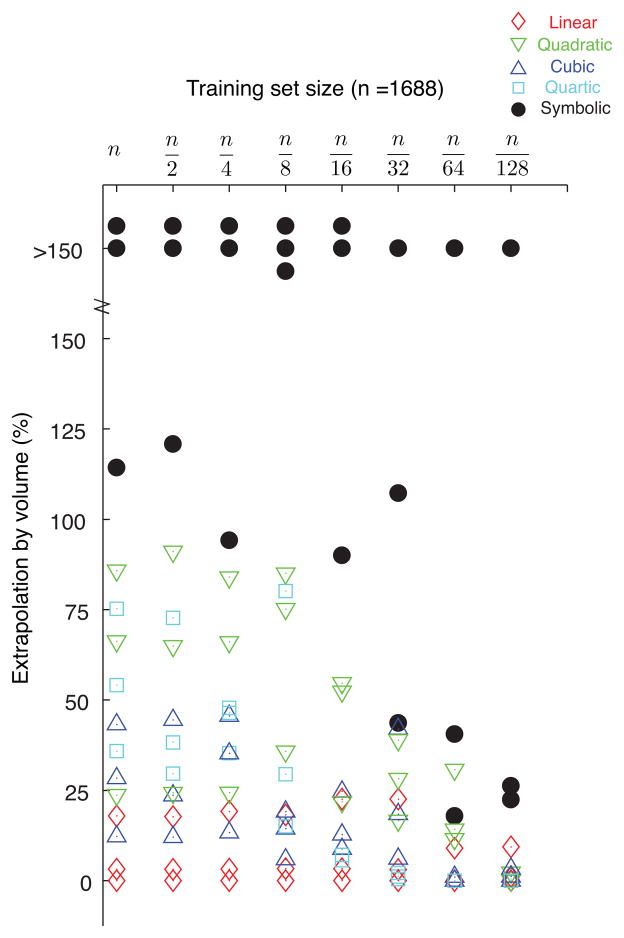
Increasing the range of extrapolation: We compared the regressions against one another in their ability to extrapolate, by performing regressions on training datasets and then testing with data points from six different ranges of extrapolation (25%, 50%, etc. in Fig. 4). We expressed each extrapolation range as percentage by volume of the training dataset (in joint angle space) where 0% means no extrapolation and 150% extrapolation refers to the situation where the volume of extrapolation is 150% of the volume of the training dataset range (in joint angle space).2 This was also repeated five times by re-sampling of training data points with replacement for each tendon (S1, S2 and S3).
Fig. 3.
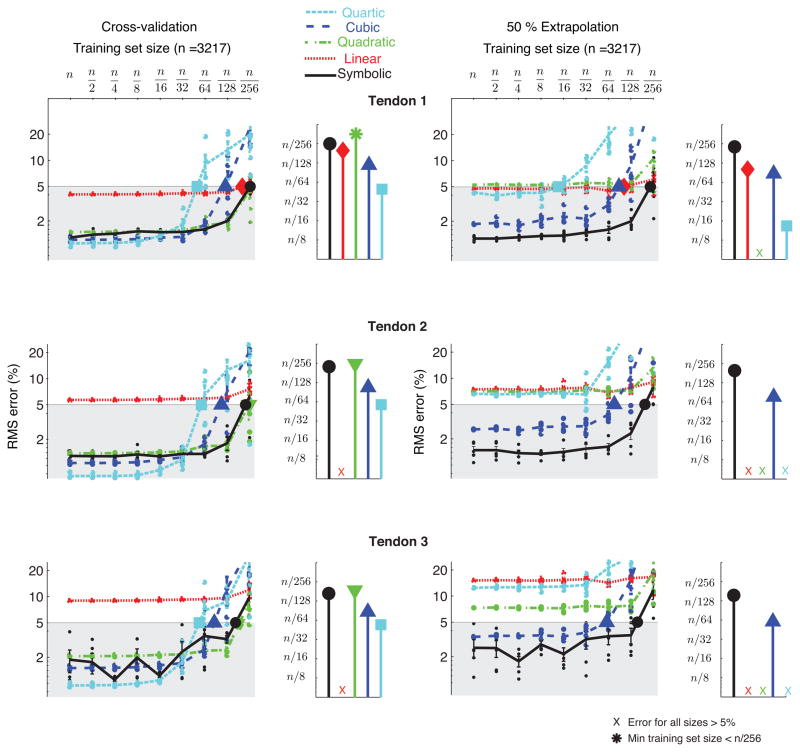
Effect of reducing the size of the training dataset: Comparison of RMS errors of symbolic and polynomial regressions with reduction in the number of training data points. The plots show mean and standard errors calculated across five runs for each regression type and training dataset size for the three tendons of the experimental robotic finger. When tested with the cross-validation dataset (interpolated from the same range as the training dataset), cubic and quartic regression had lower RMS errors compared to symbolic regression for large training datasets and quadratic regression had errors comparable to symbolic regression for small training datasets. But when tested with the extrapolation dataset (data points outside the range of training upto 50% of the volume of the training dataset), symbolic regression had lower errors than all polynomial regressions for all the different training dataset sizes. The stem plots show the training dataset size required to obtain a 5% RMS error using each of the regression techniques. Symbolic regression requires the fewest training data points compared to the different polynomial regressions for 5% cross-validation and extrapolation errors.
Fig. 4.
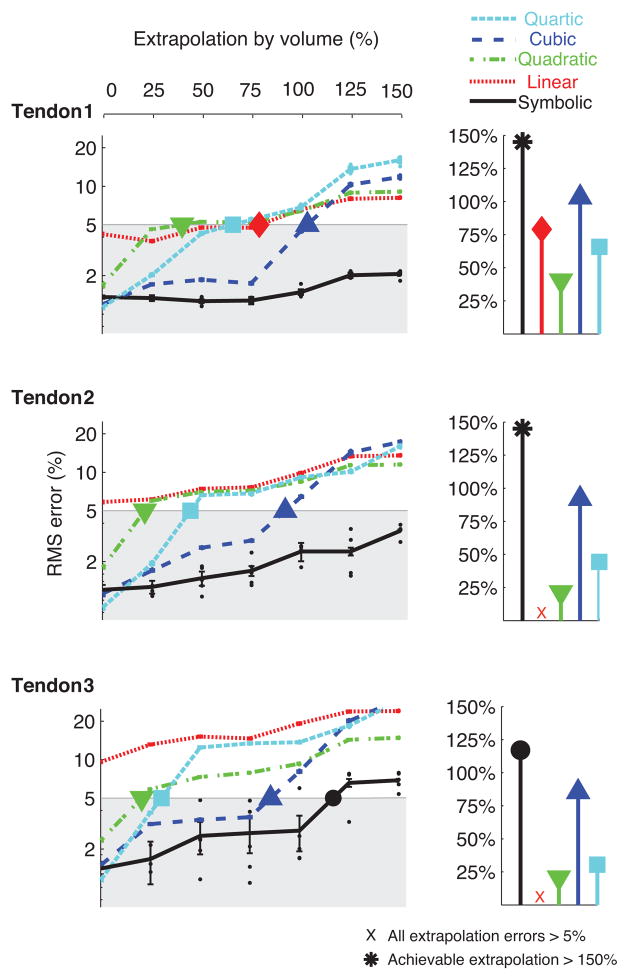
Effect of increasing the range of extrapolation: Comparison of RMS errors of symbolic and polynomial regressions across increasing ranges of extrapolation, expressed as a percentage by volume of the region in θ – θ – θ space enclosed by the training dataset. The plots show mean and standard errors calculated across five runs for each regression type and training dataset size for the three tendons of the experimental robotic finger. While cubic and quartic regressions have lower RMS errors for data points within the range of training (0% extrapolation), symbolic regression outperforms polynomial regressions for all ranges of extrapolation. The stem plots show the percentage of extrapolation achievable with each regression type to maintain the RMS error below 5%. Symbolic regression can extrapolate to much larger ranges of data compared to the different polynomial regressions for the same RMS prediction error.
D. Computer-generated synthetic data
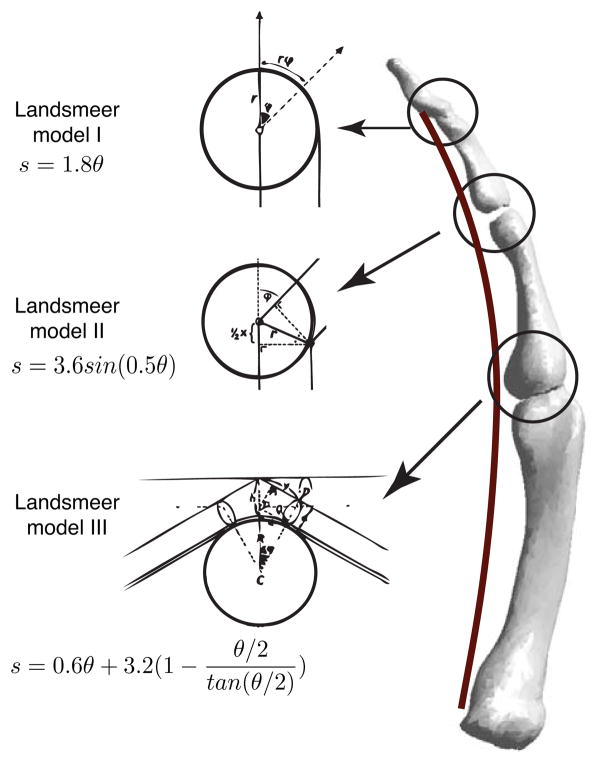
For validation purposes, we also tested our inference algorithm using synthetic (i.e., computer-generated) data because in this case, we would have access to the ground truth, and also be able to corrupt the datasets with noise in a systematic manner. Landsmeer’s models I, II and III [15] are well-accepted analytical expressions mapping joint angles to tendon excursions describing three different kinds of tendon routings for limbs and fingers [5], [30], [31]. Landsmeer obtained these expressions using trigonometry assuming simplified geometry for anatomical systems [15]. We generated synthetic datasets consisting of joint angles and tendon excursions from the 27 possible combinations (with repetition, 3×3×3) of the three Landsmeer models (Fig. 2). We then tested how well symbolic (i.e., Eureqa) and polynomial regressions could infer these hidden target expressions from input-output datasets. This allowed us to test whether or not the results obtained using the tendon-driven robotic finger also generalized to arbitrary combinations of anatomical tendon routing. We are not, however, suggesting that these Landsmeer’s models are particularly accurate or realistic representations of real musculoskeletal systems.
Fig. 2.
Synthetic data consisting of tendon excursions and joint angles were generated using models formed by combinations of Landsmeer’s models I, II and III ([I I I],[I I II],…[III III III]).
We then compared the robustness of symbolic and polynomial regressions to (1) noise in the data and also (2) the number of free parameters in the analytical expressions obtained by the two regression techniques.
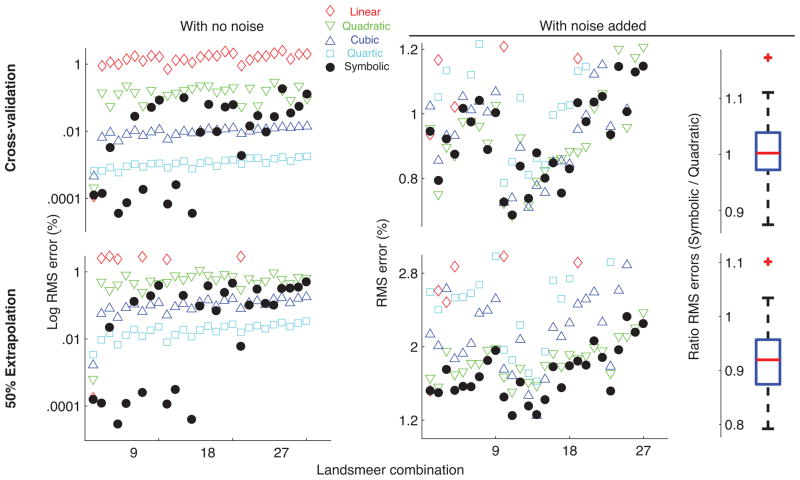
Robustness to noise: We added experimentally realistic noise of ±5% in joint angles and ±1% in tendon excursions to the synthetic data generated by the 27 combinations of the three Landsmeer models (Tendon excursions are generally measured directly using a ruler or position encoders whereas joint angles are inferred from motion capture marker positions or measured using a goniometer. The latter are subject to larger variations due to errors in marker/segment positions, joint axes estimations, skin deformations, etc [24], [22]). We then performed symbolic and polynomial regressions on the noisy datasets and compared how well they model the noisy data by testing with the cross-validation and extrapolation datasets.
Number of free parameters: We compared the number of free parameters in the expressions inferred by symbolic regression against the number of coefficients in each form of polynomial regression. Expressions with fewer parameters are preferable not only because they are more computationally parsimonious and compatible with Occam’s Razor, but also because expressions with a large number of parameters/coefficients tend to overfit to the training data, and naturally require larger training datasets.
III. Results
A. Results for the experimental tendon-driven robotic system
Symbolic regression could infer analytical expressions that had cross-validation and extrapolation RMS errors below 10% for each of the tendons of the experimental tendon-driven robotic system for all training dataset sizes and ranges of extrapolation. Table I shows examples of expressions obtained using the different regressions for one of the tendons of the robotic system in one of the cases. Below are the comparisons against polynomial regression:
TABLE I.
Examples of analytical expressions obtained using symbolic and the different polynomial regressions for one of the tendons of the robotic system.
| Regression | Expressions | |
|---|---|---|
| Symbolic | 13.7sin(θ1 − 0.78) + 12.3θ2 + 8.48θ3 + 4.02θ3sin (θ3) + 14.5 | |
| Linear | 9.26θ1 + 12.6θ2 + 11.8θ3 + 7.26 | |
| Quadratic |
|
|
| Cubic |
|
|
| Quartic |
|
Effect of reducing the size of the training dataset: We saw that symbolic regression was much more robust to reduction in the size of the training dataset (range being fixed) as compared to the polynomial regressions. As described above, this robustness was tested for cross-validation and extrapolation datasets. In general, symbolic regression required fewer training data points than polynomial regressions to obtain RMS errors of 5% in tendon excursion predictions (Fig. 3). When tested with the cross-validation dataset, cubic and quartic regressions had lower RMS errors than symbolic regression for large training dataset sizes, but had much larger errors when the number of training data points was small. However, when tested with the extrapolation dataset, all polynomial regressions had much larger errors compared to symbolic regression, independent of the size of the training dataset (Fig. 3). These observations were consistent across all three tendons (S1, S2 and S3 in Fig. 1).
Effect of increasing the range of extrapolation: Symbolic regression could extrapolate further away from the training datasets compared to polynomial regressions for the same RMS error in tendon excursion predictions. It could extrapolate to ranges beyond 150% of the range of the training dataset (by volume) for tendons one and two and up to 125% for tendon three and still maintain RMS errors below 5%. In comparison, linear, quadratic and quartic regressions could not extrapolate beyond 50–75% in most cases, and cubic regression up to 100% for the same RMS error of 5% in tendon excursion predictions (Fig. 4).
Figure 5 summarizes the comparison between symbolic and polynomial regressions for the experimental data from the tendon-driven robotic finger. It shows the achievable percentage extrapolation for the different regression techniques with reduction in training dataset size to obtain 5% RMS error in tendon excursion predictions. Symbolic regression could extrapolate to much larger ranges of data, compared to the polynomial regressions, for all the training dataset sizes.
Fig. 5.
Summary of the comparison between symbolic and polynomial regressions in their ability to extrapolate and their performance with training dataset reduction. The achievable percentage extrapolation for models trained over different training dataset sizes to maintain RMS errors below 5% is shown for each regression technique for the three tendons of the planar robotic system. For each training dataset size, symbolic regression can extrapolate to larger ranges beyond the training dataset compared to polynomial regressions.
B. Results for the computer-generated synthetic data
All regressions produced very low errors for the computer-generated synthetic data when no noise or extrapolation was involved. We observed that of the 27 possible combinations of the three Landsmeer’s models, symbolic regression tended to infer the exact target ground-truth expressions for joints with models I and II, and found expressions equivalent or closely related to the original expression (e.g., Taylor series terms or alternative trigonometric forms) for joints with model III (Table II). The training, cross-validation and extrapolation RMS errors were below 0.4% for all 27 combinations.
TABLE II.
Target and inferred expressions with training, cross-validation and extrapolation RMS errors (%) for some combinations of Landsmeer’s models I, II, III
| Landsmeer combination | Expressions | RMS errors (%)
|
|||
|---|---|---|---|---|---|
| Train. | Cross valid. | Extrap. | |||
|
| |||||
| I, I, I | Target | 1.8θ1 + 1.8θ2 + 1.8θ3 | |||
| Evolved | 1.8θ1 + 1.8θ2 + 1.8θ3 | 0.001 | 0 | 0 | |
|
| |||||
| I, II, III | Target | 1.8θ1 + 3.6sin(0.5θ2) + 0.6θ3 − (1.6θ3)/tan(0.5θ3) + 3.2 | |||
| Evolved | 1.8θ1 + 3.61sin(0.5θ2) + 1.54θ3 − 0.778sin(θ 3) | 0.102 | 0.084 | 0.124 | |
|
| |||||
| I, III, III | Target | 1.8θ1+ 0.6θ3 − (1.6θ3)/tan(0.5θ3) + 0.6θ2 − (1.6θ2)/tan(0.5θ2) + 6.4 | |||
| Evolved |
|
0.007 | 0.008 | 0.026 | |
|
| |||||
| II, II, I | Target | 3.6sin(0.5θ1) + 3.6sin(0.5θ2) + 1.8θ3 | |||
| Evolved | 3.6sin(0.5θ1) + 3.6sin(0.5θ2) + 1.8θ3 | 0.001 | 0 | 0 | |
|
| |||||
| II, II, II | Target | 3.6sin(0.5θ2) + 3.6sin(0.5θ1) + 3.6sin (0.5θ3) | |||
| Evolved | 3.6sin(0.5θ2) + 1.01(θ1 +sin (0.8θ1)) + 1.01(θ3 + sin(0.8θ3)) − 0.015 | 0.043 | 0.041 | 0.318 | |
|
| |||||
| III, II, I | Target | 1.8θ3 + 0.6θ1 − (1.6θ1)/tan(0.5θ1) + 3.6sin(0.5θ2) + 3.2 | |||
| Evolved |
|
0.031 | 0.034 | 0.165 | |
|
| |||||
| III, III, III | Target | 0.6θ1+ 0.6θ2+ 0.6θ3 − (1.6θ1)/tan(0.5θ1) − (1.6θ2)/tan(0.5θ2) − (1.6θ3)/tan(0.5θ3) + 9.6 | |||
| Evolved |
|
0.059 | 0.066 | 0.345 | |
Robustness to noise: When experimentally realistic noise was added to the training datasets, cubic and quartic regressions overfit to the noise and performed poorly when tested for cross-validation and extrapolation (Fig. 6). In contrast, symbolic regression outperformed the polynomial regressions for all tendons when tested with extrapolation datasets and matched quadratic regression when tested with cross-validation datasets. The box plot in Fig 6 shows that for the 27 combinations of Landsmeer’s models with noise added, on average symbolic and quadratic regressions had equivalent cross-validation errors, whereas symbolic was 8% better than quadratic regression when tested with the extrapolation dataset. Hence, symbolic regression would be the regression of choice to model tendon excursions in physiological systems from experimental data, where measurement noise cannot be avoided.
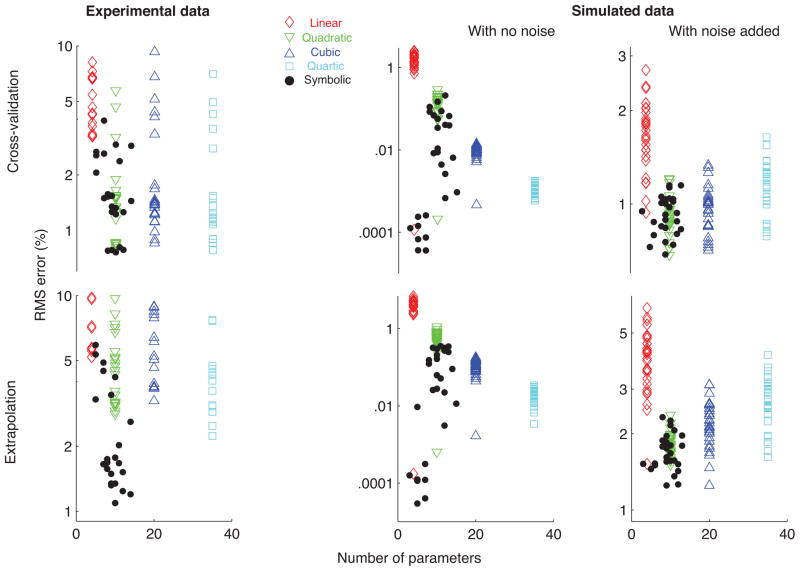
Number of free parameters as a practical measure of the complexity of the analytical expression: Analytical expressions obtained using symbolic regression had fewer free parameters and lower cross-validation, extrapolation errors compared to polynomial regressions for experimental data from the tendon-driven robotic system as well as for the synthetic data with no noise and with noise added (Fig. 7).
Fig. 6.
Comparison of root mean squared errors between symbolic and polynomial regressions for the 27 combinations of Landsmeers models with no noise and with ±5% noise added to joint angles and ±1% to tendon excursions. While cubic and quartic regressions have lower errors than symbolic regression for data with no noise, when experimentally realistic noise is added, symbolic regression has much lower errors than these polynomial regressions. The box plot on the right shows the ratio of RMS errors of symbolic to quadratic regression (best among polynomial regressions) for the data with noise. The median ratio is close to one for cross-validation testing demonstrating that symbolic and quadratic regressions are equivalent with respect to RMS errors in this case whereas for extrapolation testing, the median ratio is 0.92 indicating that on average, symbolic regression has 8% lower RMS errors than quadratic regression across the 27 models.
Fig. 7.
Comparison of RMS errors and number of parameters across symbolic and polynomial regression models for experimental data from the three tendons of the planar robotic system and synthetic data generated using the 27 combinations of Landsmeers models with no noise and with experimentally realistic noise added. In all cases, symbolic regression models have fewer parameters and lower RMS errors compared to the polynomial regressions.
IV. Discussion
We have presented a novel method based on symbolic regression that can infer accurate analytical expressions mapping joint angles to tendon excursions from sparse datasets. Symbolic regression outperforms polynomial regression, the state-of-the-art technique used in musculoskeletal modeling, in that it requires smaller training datasets, can extrapolate to ranges outside that of the training dataset, and does not contain an arbitrary number of free parameters that can lead to overfitting the training datasets and/or their noise. We have demonstrated these advantages of symbolic regression using both experimental and synthetic data and strongly suggest that this approach may be a more suitable choice to model tendon mechanics for neuromuscular systems.
Obtaining the necessary experimental data to create valid analytical expressions to represent the musculoskeletal system is invariably difficult and costly. This is true for both cadaveric specimens and human subjects. Hence it is critical to be able to extract functionally accurate analytical expressions from as sparse a dataset as possible. Moreover, because the ground truth is not usually known, it is important to have confidence that the expressions found are unaffected by unavoidable measurement noise, that enough data are available/used, that the form of the analytical expressions is appropriate and parsimonious, and that the analytical functions are valid for the entire natural workspace of the limb. We have demonstrated here that symbolic regression, as implemented in Eureqa [26], outperforms polynomial regression, the state-of-the-art in musculoskeletal modeling, with respect to these performance criteria.
For the physical system of tendons traveling over joints with smoothly varying mechanical behavior, it is critical that the tendon excursion expressions model data even outside the range of the experimentally obtained data points on which they are trained to ensure they capture the true behavior of the system, and not just overfit to the training data points. Moreover, obtaining data spanning the entire range of motion of a multiple degree-of-freedom biomechanical system is very difficult. It would also necessitate a larger training dataset. Polynomial models do not extrapolate well again due to their overfitting behavior whereas symbolic regression avoids this problem and can model points well beyond the range of training data.
Experimental data from biomechanical specimens is unavoidably polluted by measurement noise and/or uncertainty. These can arise from skin deformation, motion capture errors and/or estimation of axes of joint rotation, measurement errors and/or noise, etc. Small errors in these measurements lead to large errors in the inferred joint angle kinematics [24], [22], [23]. While experimental data are often filtered, filtering introduces artifacts and reduces the resolution of the measurements. Hence it is important that the regression technique employed be robust to noise and capture the true underlying system behavior with the highest resolution possible. We show that polynomial regression models, especially higher order polynomials, overfit to the noise and can be poor representations of the real underlying behavior of the system. In contrast, symbolic regression is seen to be robust to noise and is more accurate than polynomial regressions in modeling noisy data.
The form of the analytical function must also strike a balance between parsimony and accuracy. Functions with a large number of free parameters require a large training dataset for the estimation of the values of those parameters. They also have a greater tendency to overfit to the training dataset when compared to models with fewer parameters. On the other hand, analytical functions with too few parameters will fail to accurately represent the functional nonlinearities of the system. The symbolic regression algorithm in Eureqa explores multiple potential forms for the analytical function while also penalizing the number of parameters; and prioritizes low fitness error solutions with fewer parameters over those with more parameters. In many of the cases we present, polynomial functions of higher orders have a large number of free parameters compared to the more parsimonious analytical functions found by symbolic regression.
The ability of symbolic regression to infer the nonlinear target expressions of the Landsmeer models shows that our method can capture the underlying physics of the system directly from input-output data. This is particularly the case here because the target expressions were derived by Landsmeer by hand using principles of geometry and anatomy. As argued elsewhere [26], the fact that symbolic regression did not only infer adequate mathematical expressions but those target expressions is worth noting. At the very least, this says that those target expressions are parsimonious and that Eureqa is able to favor parsimonious expressions. In addition, this demonstrates how the analytical expressions for tendon excursions or moment arm variations generated by symbolic regression may contain insight on the geometry of the tendon routing – and therefore capture the physics of the system.
Unlike conventional optimization that is based on a ‘single line search’ and finds the global optimum or one of the local optima of the fitness landscape, Eureqa converges on a family of optimal solutions that lie on the Pareto front of the fitness error-complexity plane. The user is then free to choose the solution they want based on the features of the analytical expressions most important to them such as (i) Observation and knowledge of the system being modeled, (ii) Fitness error alone, (iii) Cross-validation or extrapolation error (as we chose to in this paper), etc. Polynomial regressions or other functional regressions do not offer this choice. Currently, selection of suitable functions is mostly driven by the properties and pitfalls of polynomial fitting as opposed to giving the freedom to the investigator to choose functions for scientific or computational reasons.
Until recently, measuring tendon excursions accurately was only possible in cadaveric specimens. But with advances in the field of magnetic resonance and ultrasound imaging, it has become possible to record moment arms in live subjects [32], [33], [34]. While in this paper we have demonstrated the use of symbolic regression to extract analytical functions mapping joint angles to tendon excursions assuming direct measurements in cadaveric systems, it will soon be possible to measure tendon excursions and moment arms non-invasively in vivo –and our techniques will be applicable to those measurements. This would enable estimation of accurate, subject-specific models of moment arm variation that are critical, for example, in the cases of deformity, surgical modification, injury, or the development of functional electrical stimulation controllers [35] and for patient-specific diagnosis and rehabilitation.
The analytical functions obtained are selected to be computationally efficient for iterative or real-time use, but they can be costly to find off-line. One of the major limitations of symbolic regression is computational cost, since it uses genetic programming that involves searching a high dimensional space for optimal or near-optimal solutions. Eureqa was designed to execute on a cluster of parallel computers by automatically parallelizing the search process, where the computation time is reduced linearly with the number of processors available. Also, while it might be computationally expensive to infer these analytical expressions, it needs to be done only once. The resulting analytical expressions can then be used as part of the model in the research of interest. In fact, once inferred, the computational cost of implementing the expressions is lower given that parsimony (and therefore computational efficiency) is an explicit fitness criterion. Eureqa’s graphical user interface allows the user to continuously monitor the fitness error as well as the family of optimal analytical functions throughout a search. The user can pause and continue, or terminate the search at any point. In addition, the user has the flexibility to select the set of mathematical operations that are to be the possible options defining the space of feasible functions to be generated. While choosing more operations would make the search more generic and thus could increase computational cost for function inference (exponential increase in the worst case), restricting the solution space too much can also lead to inappropriate or inaccurate analytical functions3. Hence an informed choice needs to be made based on knowledge of the system being modeled, the purpose of the analytical functions, and availability of computational power.
State-of-the-art biomechanical modeling involves assuming a fixed topology/form for the system being modeled and estimating the parameter values from experimental data. In our previous work [25], we have demonstrated that modeling of certain complex biomechanical systems requires simultaneous inference of both model topology and parameter values directly from experimental data. Here, as a continuation of that work, we have demonstrated that the conventional method of assuming a fixed polynomial form and regressing coefficients from experimental data, suffers from certain drawbacks which can be overcome by using symbolic regression that simultaneously infers both the form and the parameter values of the analytical expressions directly from experimental data.
We have demonstrated the advantages of using this method in a tendon-driven robotic system. We are currently applying it to infer analytical expressions modeling tendon excursions in the human fingers from cadaveric data.
Acknowledgments
The authors would like to thank Michael Schmidt for help with setting up Eureqa. Computation for the work described in this paper was supported by the University of Southern California Center for High-Performance Computing and Communications (www.usc.edu/hpcc). Demelza Gutierrez designed and built the robotic finger. This material is based upon work supported by NSF Grants EFRI-COPN 0836042 and NIH Grants AR050520 and AR052345 to FVC.
Biographies
 Manish U. Kurse received his B.Tech. degree in mechanical engineering from the Indian Institute of Technology Madras, India in 2006, and an M.S in biomedical engineering from the University of Southern California, Los Angeles in 2009. Currently, he is a Ph.D. candidate in biomedical engineering at the University of Southern California and is a graduate research assistant in the Brain-Body Dynamics Lab. His research interests include using principles of mechanics, computational modeling and machine learning to understand complex biological systems. He is a member of the American Society of Mechanical Engineers and the American Society of Biomechanics.
 Hod Lipson Hod Lipson (M’98) received the B.Sc. degree in mechanical engineering and the Ph.D. degree in mechanical engineering in computer-aided design and articial intelligence in design from the TechnionIsrael Institute of Technology, Haifa, Israel, in 1989 and 1998, respectively. He is currently an Associate Professor with the Mechanical and Aerospace Engineering and Computing and Information Science Schools, Cornell University, Ithaca, NY. He was a Postdoctoral Researcher with the Department of Computer Science, Brandeis University, Waltham, MA. He was a Lecturer with the Department of Mechanical Engineering, Massachusetts Institute of Technology, Cambridge, where he was engaged in conducting research in design automation. His current research interests include computational methods to synthesize complex systems out of elementary building blocks and the application of such methods to design automation and their implication toward understanding the evolution of complexity in nature and in engineering.
 Francisco J. Valero-Cuevas (M’99) earned a B.S. in engineering from Swarthmore College (1988), and an M.S. and Ph.D. in mechanical engineering from Queen’s University in Kingston, Ontario, Canada (1991) and Stanford University (1997), respectively. He is currently Professor of Biomedical Engineering, and of Biokinesiology & Physical Therapy at the University of Southern California. His research interests focus on combining engineering, computational methods, robotics, applied mathematics and neuroscience to understand organismal and robotic systems for basic science, engineering and clinical applications. Prof. Valero-Cuevas is member of the ASME, IEEE Engineering in Medicine and Biology Society, the American and International Societies of Biomechanics, the American Society of Mechanical Engineers, the Society for Neuroscience, and the Society for the Neural Control of Movement. He has received a Research Fellowships from the Alexander von Humboldt (2005) Foundation, the PostDoctoral Young Scientist Award from the American Society of Biomechanics (2003), the Faculty Early Career Development Program CAREER Award from the National Science Foundation (2003), the Innovation Prize from the State of Tyrol in Austria (1999), a Fellowship from the Thomas J. Watson Foundation (1988), and was elected Associate Member of the Scientific Research Society Sigma-Xi (1988). He served as Associate Editor for the IEEE Transactions on Biomedical Engineering from 2003–08, and as a regular member of the Motor Function, Speech and Rehabilitation Study Section of the National Institutes of Health from 2004–2009.
Footnotes
Eureqa allows several mathematical building blocks including trigonometric functions, logarithmic functions, boolean operations, etc. Please see the entire list in the Eureqa documentation: http://creativemachines.cornell.edu/eureqa.
For example consider a one-joint one-tendon system where the complete range of motion is 0–100 degrees. If we use 0–80 degrees as the range of training dataset for the regressions and test with joint angles between 80–100 degrees, it would be considered 25% extrapolation since we are extrapolating to a range that is 25% larger than the training range.
In practice, including appropriate mathematical operations that fit the data well would accelerate the search.
Contributor Information
Manish U. Kurse, Email: kurse@usc.edu, Department of Biomedical Engineering, University of Southern California, Los Angeles, CA 90089 USA
Hod Lipson, Email: hod.lipson@cornell.edu, Cornell Creative Machines Lab, Cornell University Ithaca, NY 14853 USA.
Francisco J. Valero-Cuevas, Email: valero@usc.edu, Department of Biomedical Engineering and the Division of Biokinesiology and Physical Therapy, University of Southern California, Los Angeles, CA 90089 USA.
References
- 1.Hoy MG, Zajac FE, Gordon ME. A musculoskeletal model of the human lower extremity: the effect of muscle, tendon, and moment arm on the moment-angle relationship of musculotendon actuators at the hip, knee, and ankle. Journal of Biomechanics. 1990;23(2):157–169. doi: 10.1016/0021-9290(90)90349-8. [DOI] [PubMed] [Google Scholar]
- 2.Valero-Cuevas FJ, Hoffmann H, Kurse MU, Kutch JJ, Theodorou EA. Computational models for neuromuscular function. IEEE Reviews in Biomedical Engineering. 2009 doi: 10.1109/RBME.2009.2034981. [DOI] [PMC free article] [PubMed] [Google Scholar]
- 3.An KN, Takahashi K, Harrigan TP, Chao EY. Determination of muscle orientations and moment arms. Journal of biomechanical engineering. 1984;106:280. doi: 10.1115/1.3138494. [DOI] [PubMed] [Google Scholar]
- 4.Zajac FE, Biosci J, Physiol JC, Biol JE, Physiol ZV, Lond JZ, Physiol ZJ, Soc JGE, Acta BB, Biochem A. Muscle and tendon: properties, models, scaling, and application to biomechanics and motor control. Crit Rev Biomed Eng. 1989;17:359–411. [PubMed] [Google Scholar]
- 5.An KN, Ueba Y, Chao EY, Cooney WP, Linscheid RL. Tendon excursion and moment arm of index finger muscles. J Biomech. 1983;16(6):419–25. doi: 10.1016/0021-9290(83)90074-x. [DOI] [PubMed] [Google Scholar]
- 6.Spoor CW, Van Leeuwen JL, Meskers CGM, Titulaer AF, Huson A. Estimation of instantaneous moment arms of lower-leg muscles. Journal of Biomechanics. 1990;23(12):1247–1259. doi: 10.1016/0021-9290(90)90382-d. [DOI] [PubMed] [Google Scholar]
- 7.Herzog W, Read LJ. Lines of action and moment arms of the major force-carrying structures crossing the human knee joint. Journal of Anatomy. 1993;182(Pt 2):213. [PMC free article] [PubMed] [Google Scholar]
- 8.Liu J, Hughes RE, Smutz WP, Niebur G, Nan-An K. Roles of deltoid and rotator cuff muscles in shoulder elevation. Clinical Biomechanics. 1997;12(1):32–38. doi: 10.1016/s0268-0033(96)00047-2. [DOI] [PubMed] [Google Scholar]
- 9.Murray WM, Delp SL, Buchanan TS. Variation of muscle moment arms with elbow and forearm position. Journal of Biomechanics. 1995;28(5):513–525. doi: 10.1016/0021-9290(94)00114-j. [DOI] [PubMed] [Google Scholar]
- 10.Buford WL, Jr, Ivey FM, Jr, Malone JD, Patterson RM, Pearce GL, Nguyen DK, Stewart AA. Muscle balance at the knee-moment arms for the normal knee and the acl-minus knee. Rehabilitation Engineering, IEEE Transactions on. 1997;5(4):367–379. doi: 10.1109/86.650292. [DOI] [PubMed] [Google Scholar]
- 11.Scott SH. Optimal feedback control and the neural basis of volitional motor control. Nature Reviews Neuroscience. 2004;5(7):532–546. doi: 10.1038/nrn1427. [DOI] [PubMed] [Google Scholar]
- 12.Theodorou E, Todorov E, Valero-Cuevas FJ. Neuromuscular stochastic optimal control of a tendon driven index finger model. American Control Conference (ACC); 2011; San Francisco, California, USA. 2011. pp. 348–355. [Google Scholar]
- 13.Visser JJ, Hoogkamer JE, Bobbert MF, Huijing PA. Length and moment arm of human leg muscles as a function of knee and hip-joint angles. European journal of applied physiology and occupational physiology. 1990;61(5):453–460. doi: 10.1007/BF00236067. [DOI] [PubMed] [Google Scholar]
- 14.Pigeon P, Yahia LH, Feldman AG. Moment arms and lengths of human upper limb muscles as functions of joint angles. Journal of Biomechanics. 1996;29(10):1365–1370. doi: 10.1016/0021-9290(96)00031-0. [DOI] [PubMed] [Google Scholar]
- 15.Landsmeer JM. Studies in the anatomy of articulation. i. the equilibrium of the” intercalated” bone. Acta morphologica Neerlando-Scandinavica. 1961;3:287. [PubMed] [Google Scholar]
- 16.Stern JT., Jr Investigations concerning the theory of ‘spurt’ and ‘shunt’ muscles. Journal of Biomechanics. 1971;4(5):437–453. doi: 10.1016/0021-9290(71)90063-7. [DOI] [PubMed] [Google Scholar]
- 17.Van Zuylen EJ, Van Velzen A, van der Gon JJ. A biomechanical model for flexion torques of human arm muscles as a function of elbow angle. Journal of Biomechanics. 1988;21(3):183–190. doi: 10.1016/0021-9290(88)90168-6. [DOI] [PubMed] [Google Scholar]
- 18.Menegaldo LL, de Toledo Fleury A, Weber HI. Moment arms and musculotendon lengths estimation for a three-dimensional lower-limb model. Journal of Biomechanics. 2004;37(9):1447–1453. doi: 10.1016/j.jbiomech.2003.12.017. [DOI] [PubMed] [Google Scholar]
- 19.Franko OI, Winters TM, Tirrell TF, Hentzen ER, Lieber RL. Moment arms of the human digital flexors. Journal of Biomechanics. 2011 doi: 10.1016/j.jbiomech.2011.04.025. [DOI] [PMC free article] [PubMed] [Google Scholar]
- 20.Green PJ, Silverman BW. Nonparametric regression and generalized linear models: a roughness penalty approach. Vol. 58 Chapman and Hall/CRC; 1994. [Google Scholar]
- 21.Clewley RH, Guckenheimer JM, Valero-Cuevas FJ. Estimating effective degrees of freedom in motor systems. IEEE Trans Biomed Eng. 2008;55(2 Pt 1):430–42. doi: 10.1109/TBME.2007.903712. [DOI] [PubMed] [Google Scholar]
- 22.Cappozzo A, Catani F, Leardini A, Benedetti MG, Della Croce U. Position and orientation in space of bones during movement: experimental artefacts. Clinical Biomechanics. 1996;11(2):90–100. doi: 10.1016/0268-0033(95)00046-1. [DOI] [PubMed] [Google Scholar]
- 23.Holden JP, Orsini JA, Siegel KL, Kepple TM, Gerber LH, Stanhope SJ. Surface movement errors in shank kinematics and knee kinetics during gait. Gait & Posture. 1997;5(3):217–227. [Google Scholar]
- 24.Woltring HJ, Huiskes R, de Lange A. Measurement error influence on helical axis accuracy in the description of 3d finite joint movement in biomechanics. Proceedings of the American Society of Mechanical Engineers Biomechanics Symposium; Houston, TX. 1983. pp. 19–22. [Google Scholar]
- 25.Valero-Cuevas FJ, Anand VV, Saxena A, Lipson H. Beyond parameter estimation: extending biomechanical modeling by the explicit exploration of model topology. IEEE Trans Biomed Eng. 2007;54(11):1951–64. doi: 10.1109/TBME.2007.906494. [DOI] [PubMed] [Google Scholar]
- 26.Schmidt M, Lipson H. Distilling free-form natural laws from experimental data. science. 2009;324(5923):81. doi: 10.1126/science.1165893. [DOI] [PubMed] [Google Scholar]
- 27.Koza J, Poli R. Genetic programming. Search Methodologies. 1992:127–164. [Google Scholar]
- 28.Schmidt M, Lipson H. Coevolution of fitness maximizers and fitness predictors. GECCO Late Breaking Paper. 2005 [Google Scholar]
- 29.Schmidt MD, Lipson H. Co-evolving fitness predictors for accelerating and reducing evaluations. Genetic Programming Theory and Practice IV. 2006;5 [Google Scholar]
- 30.Chao EYS, An KN, Cooney WP, III, Linscheid RL. Biomechanics of the hand: a basic research study. Singapore: World Scientific; 1989. [Google Scholar]
- 31.Brook N, Mizrahi J, Shoham M, Dayan J. A biomechanical model of index finger dynamics. Medical Engineering and Physics. 1995;17(1):54–63. doi: 10.1016/1350-4533(95)90378-o. [DOI] [PubMed] [Google Scholar]
- 32.Rugg SG, Gregor RJ, Mandelbaum BR, Chiu L. In vivo moment arm calculations at the ankle using magnetic resonance imaging (mri) Journal of Biomechanics. 1990;23(5):495–497. 499–501. doi: 10.1016/0021-9290(90)90305-m. [DOI] [PubMed] [Google Scholar]
- 33.Maganaris CN. Imaging-based estimates of moment arm length in intact human muscle-tendons. European journal of applied physiology. 2004;91(2):130–139. doi: 10.1007/s00421-003-1033-x. [DOI] [PubMed] [Google Scholar]
- 34.Blemker SS, Asakawa DS, Gold GE, Delp SL. Image-based musculoskeletal modeling: applications, advances, and future opportunities. Journal of Magnetic Resonance Imaging. 2007;25(2):441451. doi: 10.1002/jmri.20805. [DOI] [PubMed] [Google Scholar]
- 35.Khang G, Zajac FE. Paraplegic standing controlled by functional neuromuscular stimulation. i. computer model and control-system design. Biomedical Engineering, IEEE Transactions on. 1989;36(9):873–884. doi: 10.1109/10.35296. [DOI] [PubMed] [Google Scholar]


