

Abstract
Purpose
To examine the association of red meat and whole-grain bread consumption with plasma levels of biomarkers related to glucose metabolism, oxidative stress, inflammation and obesity.
Methods
Our cross-sectional study was based on 2,198 men and women who were selected as a sub-cohort for an investigation of biological predictors of diabetes and cardiovascular diseases from the European Prospective Investigation into Cancer and Nutrition-Potsdam study. Circulating levels of glycated hemoglobin, adiponectin, hs-CRP, gamma-glutamyltransferase, alanine-aminotransferase, fetuin-A, HDL-cholesterol and triglycerides were measured from random blood samples. Diet and lifestyle data were assessed by questionnaires, and anthropometric data were measured.
Results
After multivariable adjustment, higher consumption of whole-grain bread was significantly (P trend <0.05) associated with lower levels of GGT, ALT and hs-CRP, whereas higher consumption of red meat was significantly associated with higher levels of GGT and hs-CRP when adjusted for potential confounding factors related to lifestyle and diet. Further adjustment for body mass index and waist circumference attenuated the association between red meat and hs-CRP (P = 0.19).
Conclusions
The results of this study suggest that high consumption of whole-grain bread is related to lower levels of GGT, ALT and hs-CRP, whereas high consumption of red meat is associated with higher circulating levels of GGT and hs-CRP.
Keywords: Red meat, Whole grain, Biomarkers, Glucose metabolism
Introduction
Results from epidemiological studies suggest that high consumption of red meat is associated with increased risk of cancers of colon and rectum, cardiovascular disease and type 2 diabetes [1–4], whereas high intake of whole grains is related to a reduced risk of these diseases [5–8]. The biological mechanisms explaining these associations are not completely understood. High consumption of red meat may increase insulin resistance, oxidative stress and inflammation [9–11], whereas high intake of whole grains may provide protection by improving insulin sensitivity, lowering insulin and glucose levels, and by inhibiting inflammation and oxidative stress [12]. Thus, oxidative stress measured as circulating levels of gamma-glutamyl transferase (GGT) was positively associated with red meat intake and inversely associated with whole-grain intake in a prospective analysis of the Coronary Artery Risk Development in Young Adults (CARDIA) Study [13]. In addition, cross-sectional studies have suggested an inverse association between whole-grain consumption and systemic inflammation [14–16], but recent trials on substitution of refined grain products with whole-grain wheat or oat have been inconclusive [17, 18]. A few recent cross-sectional analyses have shown positive associations between whole-grain consumption and circulating levels of adiponectin [19, 20] and negative associations with concentrations of triglycerides and LDL-cholesterol [21–25] but not for circulating HbA1c levels [16]. The existing literature relating consumptions of red meat with biomarkers of insulin resistance and inflammation is still scarce. In one recent analysis consumption of red meat was related with plasma CRP levels in ~500 women [26].
Since red meat and whole grains potentially have opposite effects on common pathways of chronic diseases, it is possible that their associations with disease risk may be modified by each other. However, to date no data exists on potential interactions between red meat and whole grains on circulating concentrations of biomarkers of inflammation, oxidative stress, disturbed glucose metabolism or dyslipidemia.
In the present study, we examined the association of red meat and whole-grain bread consumption with plasma levels of biomarkers related to glucose metabolism (glycated hemoglobin, HbA1c), insulin sensitivity (adiponectin), inflammation (C-reactive protein, CRP), oxidative stress (gamma-glutamyltransferase, GGT), hepatic fat accumulation (GGT; alanine-aminotransferase, ALT, and fetuin-A) and dyslipidemia (high density lipoprotein cholesterol, HDL-C, and triglycerides) and whether their associations with biomarker levels may be modified by each other.
Subjects and methods
The European Prospective Investigation into Cancer and Nutrition (EPIC) Potsdam Study is part of the multicenter prospective cohort study EPIC, which was designed to investigate the association between nutrition, cancer and other chronic diseases [27, 28]. In Potsdam, Germany, 27,548 subjects (16,644 women aged 35–65 years and 10,904 men aged 40–65 years) from the general population were recruited between 1994 and 1998 [29]. The baseline examination included anthropometric measurements, a personal health interview including questions about prevalent diseases, a health questionnaire and blood sampling. Informed consent was obtained from participants; approval was given by the Ethical Committee of the State of Brandenburg, Germany.
The present study was based on a sub-cohort of 2, 500 individuals who were selected at random from all participants with blood sample available at baseline of the EPIC-Potsdam study population as part of a separate case-cohort studies on biomarkers and risk of type 2 diabetes and cardiovascular diseases [30, 31]. After exclusion of subjects with missing data for biomarkers or covariates or with implausible data on energy intake (<800 or >6,000 kcal/day), the analytical sample comprised 2,198 individuals (836 men and 1,362 women).
Usual food intake of the preceding year was assessed by a self-administered 148-item food frequency questionnaire. For each item, the frequency of consumption was asked in 10 categories, ranging from ‘never’ to ‘five times a day or more’. Pictures and portion sizes were given to estimate the quantities that were consumed. The consumed amount of each food item was calculated in grams per day. High reproducibility (r = 0.77) 6 months apart was observed for meat consumption and moderate reproducibility (r = 0.49) for bread consumption. In addition, high agreements with repeated 24 h dietary recalls were observed [32].
Plasma levels of ALT, GGT, HDL-C and hs-CRP were determined using the automatic ADVIA 1650 analyzer (Siemens Medical Solutions, Erlangen, Germany). Total adiponectin concentration was measured by ELISA (Linco Research, St. Charles, MI, USA) [33]. For determination of fetuin-A, an immunoturbidimetric method was used with specific polyclonal goat anti-human fetuin-A antibodies to human fetuin-A (BioVendor Laboratory Medicine, Modreci, Czech Republic) [34]. All assay procedures were performed as described by the manufacturer. Red blood cell levels of HbA1c were measured using HPLC according to the manufacturer’s instructions (Tosoh, Stuttgart, Germany). Observed HbA1c levels were slightly higher than what would be expected for this population. Using a prediction equation based on sex, age and waist circumference derived from the Tuebingen Family Study for type 2 diabetes [35], we observed a mean difference of 1.04 %-points between the observed and predicted levels. Because we speculate that this difference is due to the long-term storage condition, we subtracted the difference as a constant from the individual HbA1c levels.
Lifestyle characteristics, including regular physical exercise, smoking history and educational attainment as well as occupational activity level were assessed with a self-administered questionnaire and a computer-guided personal interview. Sports activity was defined as the mean time spent on leisure time physical activities during the summer and winter seasons (hours per week). Body weight, height and waist circumference were measured by trained staff according to standard procedures with participants wearing light underwear [36]. Body mass index was calculated by dividing weight (kg) by height (m) squared. The prevalence of diabetes mellitus at baseline was evaluated by a physician using information on self-reported medical diagnosis, medication records and dietary therapy.
The association between red meat and whole-grain bread consumptions with plasma biomarker levels was investigated using general linear models. Since the distributions of plasma biomarkers concentrations were right-skewed, log-transformed values were used in all analyses, and the strength of the associations was expressed as multivariable adjusted geometric means with 95 % confidence intervals of plasma biomarker levels in quintiles of red meat and whole-grain bread consumptions. We tested for effect modification by sex using cross-product terms. Since tests for the interaction were nonsignificant, we analyzed men and women combined. Analyses were adjusted for potential confounding factors including age, sex, education (in or no training, vocational training, technical school, or technical college or university degree), occupational activity (light, moderate or heavy), sports activity (0, 0.1–4, or 4 or more h/week), cycling (0, 0.1–2.4, 2.5–4.9 or 5 or more h/week), smoking (never, past or current ≤20 cigarettes/day or current >20 cigarettes/day), alcohol intake (0, 0.1–5, 5.1–10, 10.1–20, 20.1–40 or over 40 g/day) and energy intake. Potential confounding dietary variables in the models were chosen based on published dietary patterns related to consumptions of whole-grain bread and red meat in EPIC-Potsdam study population [37]. The dietary variables in whole-grain bread analyses were pasta, rice, pizza, vegetarian dishes, muesli, refined grain bread, wine and spirits and in red meat analyses the corresponding dietary variables were cabbages, cooked vegetables, legumes, cooked potatoes, mushrooms, sauce and poultry. A model including body mass index and waist circumference was also used to describe in which extent the associations observed are potentially mediated by obesity. Tests for a linear trend across quintiles were performed by modeling the median value of dietary variables in each quintile as a continuous variable. All statistical analyses were performed with SAS release 9.2 (SAS Institute, Cary, NC, USA). All statistical tests were two-sided, and P values <0.05 were considered statistically significant.
Results
Subjects in the highest quintile of whole-grain bread consumption were less likely to be men, and smokers and they reported more biking and sports activity than persons in the lowest quintile of whole-grain bread (Table 1). They also more often had university degree education. Of the food components of the dietary pattern related to whole-grain bread consumption, pizza, muesli, vegetarian dishes, wine were directly and bread other than whole-grain bread and spirits were inversely associated with whole-grain bread consumption. Of the food components of dietary pattern related to red meat consumption, whole-grain bread consumption was directly associated with cooked vegetables and inversely with cooked potatoes. Subjects with higher red meat consumption were more likely to be men, smokers and less active, and they reported higher alcohol and coffee consumptions and they more often had prevalent diabetes than subjects with lower meat consumption. Body mass index and waist circumference showed increasing trends across the quintiles of red meat consumption. The Pearson correlation coefficient for whole-grain bread consumption with red meat intake was −0.12.
Table 1.
Characteristics by quintiles of red meat and whole-grain consumption
| Quintiles of whole-grain bread | P trenda | Quintiles of red meat | P trenda | |||||
|---|---|---|---|---|---|---|---|---|
| Quintile 1 0–4.75 g/day |
Quintile 3 15.9–38.1 g/day |
Quintile 5 79.8–362 g/day |
Quintile 1 0–20.2 g/day |
Quintile 3 31.6–42.0 g/day |
Quintile 5 59.6–187 g/day |
|||
| Age, yearsb | 51.1 | 49.4 | 50.7 | 0.60 | 49.5 | 51.2 | 49.9 | 0.93 |
| Sex, % menc | 47.2 | 36.8 | 33.3 | <0.01 | 31.8 | 38.7 | 45.5 | <0.01 |
| Energy intake, kJ/dayd | 8,501 | 8,649 | 8,870 | <0.01 | 7,878 | 8,294 | 9,643 | <0.01 |
| Whole-grain bread, servings (50 g)/day | 0.02 | 0.52 | 2.68 | <0.01 | 1.17 | 0.90 | 0.69 | <0.01 |
| Red meat, servings (150 g/day) | 0.31 | 0.28 | 0.24 | < 0.01 | 0.08 | 0.25 | 0.58 | <0.01 |
| Sport activity, h/week | 0.75 | 0.96 | 1.30 | <0.01 | 1.30 | 1.00 | 0.85 | <0.01 |
| Biking, h/week | 1.44 | 1.78 | 2.27 | <0.01 | 2.19 | 2.02 | 1.47 | <0.01 |
| Body mass index, kg/m2 | 26.1 | 26.3 | 26.0 | 0.51 | 25.6 | 26.3 | 26.7 | <0.01 |
| Waist circumference, cm | 86.3 | 86.0 | 85.4 | 0.17 | 84.6 | 85.5 | 87.5 | <0.01 |
| Prevalent diabetes, % | 4.26 | 5.21 | 4.50 | 0.96 | 1.81 | 4.23 | 8.23 | <0.01 |
| Prevalent myocardial infarction, % | 2.58 | 1.40 | 1.53 | 0.29 | 2.20 | 2.01 | 2.88 | 0.45 |
| Prevalent stroke, % | 2.02 | 1.01 | 0.94 | 0.26 | 1.78 | 1.11 | 0.52 | 0.15 |
| Heavy work strain, % | 8.86 | 7.16 | 5.82 | 0.13 | 8.32 | 7.35 | 6.39 | 0.31 |
| University degree education, % | 27.2 | 42.3 | 40.6 | <0.01 | 35.8 | 36.7 | 38.6 | 0.25 |
| Current- or ex smoker, % | 60.3 | 53.9 | 51.3 | 0.02 | 51.3 | 49.5 | 60.4 | <0.01 |
| Coffee, cups/day | 2.96 | 2.83 | 2.61 | 0.02 | 2.58 | 2.72 | 3.12 | <0.01 |
| Alcohol consumption, g/day | 14.0 | 14.4 | 12.4 | 0.02 | 11.9 | 13.3 | 15.9 | <0.01 |
| Components of dietary pattern related to whole-grain bread intake, g/day | ||||||||
| Pizza | 5.57 | 8.01 | 7.78 | <0.01 | 7.10 | 7.38 | 6.91 | 0.89 |
| Pasta and rice | 14.7 | 16.9 | 16.5 | 0.12 | 14.8 | 16.2 | 18.6 | <0.01 |
| Muesli | 4.24 | 5.40 | 8.78 | <0.01 | 9.93 | 3.78 | 1.49 | <0.01 |
| Vegetarian dishes | 0.50 | 1.39 | 2.80 | <0.01 | 3.12 | 1.16 | 0.76 | <0.01 |
| Wine | 37.4 | 56.5 | 66.1 | <0.01 | 50.5 | 46.6 | 55.9 | 0.52 |
| Spirits | 4.45 | 2.47 | 1.68 | <0.01 | 1.76 | 2.53 | 3.80 | <0.01 |
| Bread other than whole-grain bread | 161 | 135 | 70.1 | <0.01 | 118 | 129 | 122 | 0.57 |
| Components of dietary pattern related to red meat intake, g/day | ||||||||
| Saucee | 12.3 | 13.1 | 11.6 | 0.26 | 8.24 | 11.6 | 18.4 | <0.01 |
| Cooked vegetables | 28.2 | 28.7 | 31.2 | 0.01 | 25.0 | 28.4 | 37.2 | <0.01 |
| Cooked potatoes | 89.9 | 77.1 | 79.3 | <0.01 | 61.6 | 81.5 | 109 | <0.01 |
| Cabbage family | 14.5 | 14.5 | 14.8 | 0.60 | 10.3 | 14.7 | 18.9 | <0.01 |
| Poultry | 12.2 | 13.1 | 12.6 | 0.87 | 7.39 | 12.2 | 20.6 | <0.01 |
| Mushrooms | 2.29 | 2.00 | 2.28 | 0.19 | 1.63 | 1.79 | 2.92 | <0.01 |
| Legumes | 22.5 | 22.3 | 22.4 | 0.59 | 17.7 | 22.0 | 27.6 | <0.01 |
Adjusted for age, sex and energy intake with an exception when as outcome variable
aCalculated by using the median values within quintiles as a continuous variable in linear model adjusting for age, sex and energy intake
bNot adjusted for age
cNot adjusted for sex
dNot adjusted for energy intake
eKetchup, brown and white sauce, salad dressing, sauce for vegetables
In our multivariable model, a modest but significant inverse association of whole-grain bread consumption was observed for circulating levels of GGT, ALT and hs-CRP (P trend across quintile medians (P) <0.05), but not for adiponectin, HDL-cholesterol, triglycerides or HbA1c (Table 2). Results remained virtually unchanged after additional adjustment for body mass index and waist circumference (data not shown). For example, geometric mean serum GGT levels across the quintiles of whole-grain bread consumption were 24.3 (CI 22.1–26.8), 22.2 (CI 20.1–24.5), 21.1 (CI 19.1–23.2), 22.5 (CI 20.4–24.8) and 19.8 (CI 17.9–21.9), with P = 0.003. Further adjustment for cooked potatoes and cooked vegetables did not notably alter the results (data not shown), neither did exclusion of subjects with history of diabetes, myocardial infarction or cerebrovascular stroke (data not shown).
Table 2.
Association of whole-grain bread and red meat consumption with biomarker levels
| Quintiles of whole-grain bread intake | P trenda | |||||
|---|---|---|---|---|---|---|
| 1 (0–4.75 g/day) |
2 (4.77–15.9 g/day) |
3 (15.9–38.0 g/day) |
4 (38.1–79.5 g/day) |
5 (79.8–362 g/day) |
||
| Adiponectin, ng/Lb | 7.03 (6.61–7.46) | 6.83 (6.41–7.27) | 7.09 (6.66–7.54) | 6.78 (6.36–7.21) | 6.93 (6.50–7.40) | 0.76 |
| GGT, U/L | 24.7 (22.3–27.2) | 22.5 (20.3–25.0) | 21.5 (19.4–23.8) | 22.9 (20.7–25.4) | 20.0 (18.0–22.3) | 0.004 |
| ALT, U/L | 22.5 (21.2–23.9) | 21.4 (20.1–22.8) | 20.7 (19.5–22.0) | 21.6 (20.3–23.0) | 20.2 (18.9–21.6) | 0.02 |
| hs-CRP, mg/L | 0.77 (0.65–0.92) | 0.86 (0.71–1.03) | 0.91 (0.76–1.09) | 0.79 (0.66–0.95) | 0.68 (0.56–0.82) | 0.02 |
| HDL-cholesterol, mmol/L | 1.31 (1.27–1.35) | 1.29 (1.25–1.34) | 1.29 (1.24–1.34) | 1.29 (1.24–1.33) | 1.28 (1.23–1.33) | 0.33 |
| Triglycerides, mmol/L | 1.25 (1.16–1.34) | 1.29 (1.19–1.39) | 1.24 (1.15–1.34) | 1.30 (1.21–1.40) | 1.23 (1.14–1.33) | 0.56 |
| HbA1c, % | 5.54 (5.44–5.64) | 5.54 (5.44–5.64) | 5.58 (5.48–5.69) | 5.65 (5.54–5.75) | 5.55 (5.45–5.66) | 0.72 |
| Fetuin, μg/mL | 247 (239–256) | 244 (236–253) | 236 (229–245) | 243 (234–251) | 239 (231–248) | 0.26 |
| Quintiles of red meat intake | ||||||
|---|---|---|---|---|---|---|
| 1 (0–20.2 g/day) |
2 (20.3–31.5 g/day) |
3 (31.6–42.0 g/day) |
4 (42.1–59.5 g/day) |
5 (59.6–187 g/day) |
||
| Adiponectin, ng/L | 7.09 (6.66–7.55) | 7.02 (6.59–7.48) | 7.11 (6.68–7.57) | 6.80 (6.39–7.24) | 6.99 (6.55–7.47) | 0.56 |
| GGT, U/L | 21.9 (19.7–24.3) | 21.5 (19.3–23.8) | 21.6 (19.5–23.9) | 22.2 (20.1–24.6) | 25.4 (22.8–28.3) | 0.007 |
| ALT, U/L | 21.1 (19.9–22.5) | 21.2 (19.9–22.6) | 20.8 (19.6–22.2) | 21.4 (20.1–22.7) | 22.4 (21.0–23.9) | 0.10 |
| hs-CRP, mg/L | 0.73 (0.61–0.88) | 0.74 (0.61–0.89) | 0.78 (0.65–0.94) | 0.87 (0.72–1.04) | 0.88 (0.73–1.07) | 0.05 |
| HDL-cholesterol, mmol/L | 1.31 (1.26–1.36) | 1.28 (1.24–1.33) | 1.29 (1.25–1.34) | 1.27 (1.23–1.32) | 1.32 (1.27–1.37) | 0.68 |
| Triglycerides, mmol/L | 1.26 (1.17–1.36) | 1.20 (1.11–1.29) | 1.23 (1.14–1.33) | 1.27 (1.18–1.37) | 1.31 (1.21–1.41) | 0.15 |
| HbA1c, % | 5.52 (5.41–5.62) | 5.57 (5.47–5.68) | 5.61 (5.50–5.71) | 5.61 (5.51–5.72) | 5.56 (5.45–5.67) | 0.52 |
| Fetuin, μg/mL | 243 (235–252) | 246 (238–255) | 241 (233–249) | 244 (236–253) | 237 (228–245) | 0.14 |
aCalculated by using the median values within quintiles as a continuous variable in linear model
bGeometric mean values with 95 % confidence interval, adjusted for age, sex, education, sport activity (0, 0.1–4, or >4 h/week), occupational activity (light, moderate, heavy), smoking (never, past or current <20, current 20 or more cigarettes/day), alcohol intake (0, 0.1–5, 5.1–10, 10.1–20, 20.1–40 or >40 g/day) and dietary variables (continuous): energy intake, consumptions of red meat, coffee and food items aggregating into same dietary pattern with whole-grain bread (pasta and rice, pizza, vegetarian dishes, muesli, other bread than whole-grain bread, wine and spirits) and food items aggregating into same dietary pattern with red meat (cabbages, cooked vegetables, legumes, cooked potatoes, mushrooms, sauce and poultry), respectively
A significant (P trend <0.05) positive association between red meat consumption and plasma levels of GGT and hs-CRP was observed (Table 2). After further adjustment for BMI and waist circumference, only the association with GGT remained significant. In that model, the adjusted geometric mean values of GGT (U/L) across quintiles of red meat consumption were 22.0 (CI 19.4–24.3), 21.2 (CI 19.2–23.5), 21.5 (CI 19.5–23.7), 21.7 (CI 19.7–24.0) and 24.6 (CI 22.2–27.3), with P = 0.03 (data not shown). We also included protein intake in the final model and observed no notable change in the strength of the association, although the P value for trend across quintiles was no longer significant at the 5 %-level (P = 0.08). Exclusion of subjects with history of diabetes, myocardial infarction or cerebrovascular stroke did not notably alter the result (data not shown).
To explore the joint association of red meat and whole-grain bread with plasma GGT and hs-CRP values, we cross-classified individuals on the basis of quintiles of consumption of red meat and whole-grain bread. In this analysis, the positive association between red meat consumption and plasma levels of hs-CRP and GGT was less pronounced in participants in the highest quintile of whole-grain bread consumption in comparison with individuals in the lowest quintile of whole-grain consumption (data not shown). We then combined the lower 4 quintiles of whole-grain bread consumption and compared the associations between red meat intake and circulating biomarker levels in persons with whole-grain bread consumption in the highest quintile and in persons in the lower quintiles. While no significant interaction was observed for GGT (P = 0.48), a significant interaction was found for CRP (P = 0.02). Figure 1 therefore displays the geometric mean values (mg/L) of hs-CRP across quintiles of red meat intake in categories of whole-grain intake (highest quintile vs. lower quintiles). Generally, lower hs-CRP levels were observed among subjects in the highest quintile of whole-grain bread (with P = 0.44) than among subjects in the lower quintiles (with P = 0.049).
Fig. 1.
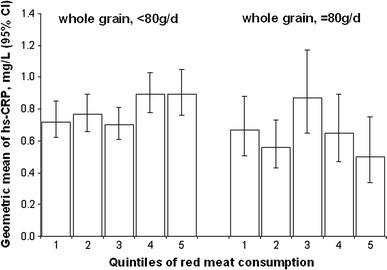
Geometric means (95 % CI) of plasma hs-CRP levels across quintiles of red meat according to categories of whole-grain bread consumption [adjusted for age, sex, education (sport activity (0, 0.1–4, or >4 h/week), occupational activity (light, moderate, heavy), smoking (never, past or current <20, current 20 or more cigarettes/day), alcohol intake (0, 0.1–5, 5.1–10, 10.1–20, 20.1–40 or >40 g/day) and dietary variables (continuous): energy intake, consumptions of coffee and food items aggregating into same dietary pattern with red meat such as cabbages, cooked vegetables, legumes, cooked potatoes, mushrooms, sauce and poultry and food items aggregating into same dietary pattern with whole-grain bread, such as pasta and rice, pizza, vegetarian dishes, muesli, other bread than whole-grain bread, wine and spirits. P for interaction = 0.02]
Discussion
In the present analyses, we found that high consumption of whole-grain bread was significantly associated with modestly lower levels of GGT, ALT and hs-CRP, whereas high consumption of red meat was significantly associated with higher levels of GGT and hs-CRP after adjustment for potential confounding factors related to lifestyle and diet. After further adjustment for body mass index and waist circumference, the association between red meat consumption and hs-CRP was no longer statistically significant, suggesting that the degree of adiposity may explain this association and obesity may thus be considered as a potential intermediate factor. The results of the present study also suggest that the relation of red meat consumption with higher hs-CRP levels may be modified by higher whole-grain bread consumption or factors closely related to it.
The observed inverse association between whole-grain bread consumption and plasma CRP levels is in line with a cross-sectional analysis among 902 diabetic women in the Nurses’ Health Study, which suggested that consumption of whole grains and cereal fiber was associated with lower inflammatory markers such as CRP and soluble TNF receptor 2 [14]. Another study in a multi-ethnic sample of 5,496 men and women suggested an inverse association between whole-grain consumption and CRP levels [15]. However, in an analysis based on a subset of men from the Health Professionals Follow-Up Study and women from the Nurses’ Health Study II, the significant association between whole-grain intake and serum CRP disappeared after adjustment for lifestyle factors, including alcohol intake, smoking, BMI, physical activity and hypercholesterolemia [16]. Furthermore, recent trials on the effect of substitution of refined grain products with whole-grain wheat or oat products have been inconclusive [17, 18]. In recent comprehensive intervention trials among 316 overweight participants [18] and among 206 participants with normal weight [17], neither three servings of whole-grain foods per day for 12 weeks nor 120 g/day for 16 weeks significantly affected plasma CRP levels. In both interventions, the authors discussed that diets of high whole-grain consumers in these intervention studies were different from that of high whole-grain consumers in observational studies, and whole-grain consumption may be a marker of an otherwise healthier diet. However, in the present study, the association was observable even after comprehensive adjustment for dietary factors. The null findings in intervention studies suggest that the observation may still be confounded.
Of the biomarkers of dyslipidemia, glucose metabolism and insulin sensitivity consumption of whole-grain foods were related to lower LDL-cholesterol but not to HDL-cholesterol or triglyceride or HbA1c concentrations after adjustment for lifestyle and dietary factors in Framingham Offspring Cohort Study [15, 16]. Consumption of whole-grain foods was also associated with lower triglyceride concentrations in 827 men and women from the Tehran Lipid and Glucose Study [25]. Among men and women with diabetes from the Health Professional Follow-up Study and Nurses’ Health Study cereal fiber intake was associated with higher plasma adiponectin levels [19, 20]. In the present study, no association was observed between consumption of whole-grain bread and HbA1c or plasma values of HDL, triglycerides or adiponectin.
In the present study, the positive association between red meat intake and plasma hs-CRP levels did not remain significant after adjustment for BMI and waist circumference. Since the adipose tissue, particularly from visceral fat depots, is capable of producing pro-inflammatory cytokines that induce hepatic production of CRP and other acute phase proteins, it is plausible that the association observed is mediated by obesity. Inflammation as well as oxidative stress has been suggested to be involved in the pathogenesis of diabetes, cardiovascular diseases and other obesity-related diseases [38, 39]. However, in a recent cross-sectional analysis among 482 Iranian women, the association between red meat consumption and CRP persisted adjustment for BMI [26]. The liver enzymes GGT and ALT have been proposed as markers of accumulation of hepatic fat, which is related to increased gluconeogenesis and decreased glycogen storage in the liver [40]. In the present study, a significant association observed between red meat consumption and GGT persisted after adjustment for measures of obesity, and no association was observed between ALT and red meat consumption. Since GGT is also a potential nonspecific marker of oxidative stress [41–44], it is plausible that increased oxidative stress plays an important role in the association between red meat consumption and development of chronic diseases. Also in line with these results, meat consumption was linearly associated with increased serum GGT levels measured after 10 years in CARDIA study [13] after adjustment for BMI and other lifestyle and dietary factors. Besides obesity, the high consumption of red meat may increase inflammation and oxidative stress because of the high intake of saturated fat, protein, heme-iron, nitrates and nitrite, heterocyclic amines and polycyclic aromatic hydrocarbons, or glycation end products that are usually contained in prepared red meat [45–51]. Nevertheless, in an intervention study, a daily intake of ~200 g red meat for 8 weeks among 60 healthy subjects did not elevate plasma levels of GGT or CRP compared to a control group [52].
Several prospective studies have suggested that high red meat consumption is associated with a modestly increased risk of colorectal, colon and rectal cancers, cardiovascular disease and type 2 diabetes [1–4], whereas high whole-grain intake has been related to reduced risks of colorectal, colon and rectal cancers, cardiovascular diseases and diabetes [5–8]. The association of type 2 diabetes risk with higher consumption of red meat and lower consumption of whole-grain bread has been observed in the study population of the present study [53]. Since circulating levels of GGT and hs-CRP have been related in development of diabetes and cardiovascular disease in several prospective studies [54–57], it seems possible that part of the association between red meat and disease risk may be modified by whole-grain intake. The finding in the present study suggests that the positive association between red meat consumption and circulating levels of hs-CRP depends on consumption of whole-grain bread. However, this finding needs to be verified.
The present study was conducted in a cross-sectional design, which complicates the drawing of causal inferences. In the present study, we had data available from a single blood drawing only, which might have introduced random measurement error in determining biomarkers. However, most of the markers presented here have been shown to have a suitable reliability for epidemiological studies [58, 59]. The dietary data were collected using a food frequency questionnaire (FFQ), which is a common tool in nutritional epidemiology to rank the participants according to their food consumption. FFQs tend to overestimate the amount of consumed foods when compared to dietary recalls and food diaries, therefore the absolute amount of food intake must be interpreted cautiously [60]. However, fair to good reliability and agreement with 24 h recall data of assessment of red meat and bread consumption have been observed in this study population [32]. In addition, we based our analysis of whole-grain bread and red meat and their interaction with biomarker levels on quintile distribution, therefore, nondifferential misclassification of food intake should not have affected the results.
In summary, the results of this study suggest that high red meat consumption is associated with modestly higher concentrations of plasma GGT and hs-CRP, whereas high whole-grain bread consumption is related to modestly lower concentrations of GGT, ALT and hs-CRP. The association observed between red meat and hs-CRP is dependent on obesity. This study also suggests that the cross-sectional association of red meat consumption with increased levels of hs-CRP could be modified by high whole-grain bread consumption. Although the strengths of these associations were modest, our observations highlight the hypothesis that dietary factors may modulate these biomarkers, which may be potential mediators related to risk of diabetes and CVD.
Acknowledgments
This study was partly supported by grants from the Federal Ministry of Education and Research, Germany (Bundesministerium für Bildung und Forschung, Förderkennzeichen 0315381A). The funding agency had no role in study design, data collection and analysis, decision to publish, or preparation of the manuscript. The responsibility for the content of this manuscript lies with the authors.
Conflict of interest
The authors declare that they have no conflict of interest.
Open Access
This article is distributed under the terms of the Creative Commons Attribution License which permits any use, distribution, and reproduction in any medium, provided the original author(s) and the source are credited.
References
- 1.Chan JM, Rimm EB, Colditz GA, Stampfer MJ, Willett WC. Obesity, fat distribution, and weight gain as risk factors for clinical diabetes in men. Diabetes Care. 1994;17(9):961–969. doi: 10.2337/diacare.17.9.961. [DOI] [PubMed] [Google Scholar]
- 2.Pan A, Sun Q, Bernstein AM, Schulze MB, Manson JE, Willett WC, Hu FB. Red meat consumption and risk of type 2 diabetes: 3 cohorts of US adults and an updated meta-analysis. Am J Clin Nutr. 2011;94(4):1088–1096. doi: 10.3945/ajcn.111.018978. [DOI] [PMC free article] [PubMed] [Google Scholar]
- 3.Aune D, Ursin G, Veierod MB. Meat consumption and the risk of type 2 diabetes: a systematic review and meta-analysis of cohort studies. Diabetologia. 2009;52(11):2277–2287. doi: 10.1007/s00125-009-1481-x. [DOI] [PubMed] [Google Scholar]
- 4.Micha R, Wallace SK, Mozaffarian D. Red and processed meat consumption and risk of incident coronary heart disease, stroke, and diabetes mellitus: a systematic review and meta-analysis. Circulation. 2010;121(21):2271–2283. doi: 10.1161/CIRCULATIONAHA.109.924977. [DOI] [PMC free article] [PubMed] [Google Scholar]
- 5.Jacobs DR, Marquart L, Slavin J, Kushi LH. Whole-grain intake and cancer: an expanded review and meta-analysis. Nutr Cancer. 1998;30(2):85–96. doi: 10.1080/01635589809514647. [DOI] [PubMed] [Google Scholar]
- 6.Mente A, de Koning L, Shannon HS, Anand SS. A systematic review of the evidence supporting a causal link between dietary factors and coronary heart disease. Arch Intern Med. 2009;169(7):659–669. doi: 10.1001/archinternmed.2009.38. [DOI] [PubMed] [Google Scholar]
- 7.Mellen PB, Walsh TF, Herrington DM. Whole grain intake and cardiovascular disease: a meta-analysis. Nutr Metab Cardiovasc Dis. 2008;18(4):283–290. doi: 10.1016/j.numecd.2006.12.008. [DOI] [PubMed] [Google Scholar]
- 8.de Munter JS, Hu FB, Spiegelman D, Franz M, van Dam RM. Whole grain, bran, and germ intake and risk of type 2 diabetes: a prospective cohort study and systematic review. PLoS Med. 2007;4(8):e261. doi: 10.1371/journal.pmed.0040261. [DOI] [PMC free article] [PubMed] [Google Scholar]
- 9.Hofmann SM, Dong HJ, Li Z, Cai W, Altomonte J, Thung SN, Zeng F, Fisher EA, Vlassara H. Improved insulin sensitivity is associated with restricted intake of dietary glycoxidation products in the db/db mouse. Diabetes. 2002;51(7):2082–2089. doi: 10.2337/diabetes.51.7.2082. [DOI] [PubMed] [Google Scholar]
- 10.Cai W, Gao QD, Zhu L, Peppa M, He C, Vlassara H. Oxidative stress-inducing carbonyl compounds from common foods: novel mediators of cellular dysfunction. Mol Med. 2002;8(7):337–346. [PMC free article] [PubMed] [Google Scholar]
- 11.Biondi-Zoccai GG, Abbate A, Liuzzo G, Biasucci LM. Atherothrombosis, inflammation, and diabetes. J Am Coll Cardiol. 2003;41(7):1071–1077. doi: 10.1016/S0735-1097(03)00088-3. [DOI] [PubMed] [Google Scholar]
- 12.Slavin J. Why whole grains are protective: biological mechanisms. Proc Nutr Soc. 2003;62(1):129–134. doi: 10.1079/PNS2002221. [DOI] [PubMed] [Google Scholar]
- 13.Lee DH, Steffen LM, Jacobs DR., Jr Association between serum gamma-glutamyltransferase and dietary factors: the Coronary Artery Risk Development in Young Adults (CARDIA) Study. Am J Clin Nutr. 2004;79(4):600–605. doi: 10.1093/ajcn/79.4.600. [DOI] [PubMed] [Google Scholar]
- 14.Qi L, van Dam RM, Liu S, Franz M, Mantzoros C, Hu FB. Whole-grain, bran, and cereal fiber intakes and markers of systemic inflammation in diabetic women. Diabetes Care. 2006;29(2):207–211. doi: 10.2337/diacare.29.02.06.dc05-1903. [DOI] [PubMed] [Google Scholar]
- 15.Lutsey PL, Jacobs DR, Jr, Kori S, Mayer-Davis E, Shea S, Steffen LM, Szklo M, Tracy R. Whole grain intake and its cross-sectional association with obesity, insulin resistance, inflammation, diabetes and subclinical CVD: the MESA study. Br J Nutr. 2007;98(2):397–405. doi: 10.1017/S0007114507700715. [DOI] [PubMed] [Google Scholar]
- 16.Jensen MK, Koh-Banerjee P, Franz M, Sampson L, Gronbaek M, Rimm EB. Whole grains, bran, and germ in relation to homocysteine and markers of glycemic control, lipids, and inflammation 1. Am J Clin Nutr. 2006;83(2):275–283. doi: 10.1093/ajcn/83.2.275. [DOI] [PubMed] [Google Scholar]
- 17.Tighe P, Duthie G, Vaughan N, Brittenden J, Simpson WG, Duthie S, Mutch W, Wahle K, Horgan G, Thies F. Effect of increased consumption of whole-grain foods on blood pressure and other cardiovascular risk markers in healthy middle-aged persons: a randomized controlled trial. Am J Clin Nutr. 2010;92(4):733–740. doi: 10.3945/ajcn.2010.29417. [DOI] [PubMed] [Google Scholar]
- 18.Brownlee IA, Moore C, Chatfield M, Richardson DP, Ashby P, Kuznesof SA, Jebb SA, Seal CJ. Markers of cardiovascular risk are not changed by increased whole-grain intake: the WHOLEheart study, a randomised, controlled dietary intervention. Br J Nutr. 2010;104(1):125–134. doi: 10.1017/S0007114510000644. [DOI] [PMC free article] [PubMed] [Google Scholar]
- 19.Qi L, Rimm E, Liu S, Rifai N, Hu FB. Dietary glycemic index, glycemic load, cereal fiber, and plasma adiponectin concentration in diabetic men. Diabetes Care. 2005;28(5):1022–1028. doi: 10.2337/diacare.28.5.1022. [DOI] [PubMed] [Google Scholar]
- 20.Qi L, Meigs JB, Liu S, Manson JE, Mantzoros C, Hu FB. Dietary fibers and glycemic load, obesity, and plasma adiponectin levels in women with type 2 diabetes. Diabetes Care. 2006;29(7):1501–1505. doi: 10.2337/dc06-0221. [DOI] [PubMed] [Google Scholar]
- 21.McKeown NM, Meigs JB, Liu S, Wilson PW, Jacques PF. Whole-grain intake is favorably associated with metabolic risk factors for type 2 diabetes and cardiovascular disease in the Framingham Offspring Study. Am J Clin Nutr. 2002;76(2):390–398. doi: 10.1093/ajcn/76.2.390. [DOI] [PubMed] [Google Scholar]
- 22.McKeown NM, Meigs JB, Liu S, Saltzman E, Wilson PW, Jacques PF. Carbohydrate nutrition, insulin resistance, and the prevalence of the metabolic syndrome in the Framingham Offspring Cohort. Diabetes Care. 2004;27(2):538–546. doi: 10.2337/diacare.27.2.538. [DOI] [PubMed] [Google Scholar]
- 23.Liese AD, Roach AK, Sparks KC, Marquart L, D’Agostino RB, Jr, Mayer-Davis EJ. Whole-grain intake and insulin sensitivity: the Insulin Resistance Atherosclerosis Study. Am J Clin Nutr. 2003;78(5):965–971. doi: 10.1093/ajcn/78.5.965. [DOI] [PubMed] [Google Scholar]
- 24.Steffen LM, Jacobs DR, Jr, Murtaugh MA, Moran A, Steinberger J, Hong CP, Sinaiko AR. Whole grain intake is associated with lower body mass and greater insulin sensitivity among adolescents. Am J Epidemiol. 2003;158(3):243–250. doi: 10.1093/aje/kwg146. [DOI] [PubMed] [Google Scholar]
- 25.Esmaillzadeh A, Mirmiran P, Azizi F. Whole-grain consumption and the metabolic syndrome: a favorable association in Tehranian adults. Eur J Clin Nutr. 2005;59(3):353–362. doi: 10.1038/sj.ejcn.1602080. [DOI] [PubMed] [Google Scholar]
- 26.Azadbakht L, Esmaillzadeh A. Red meat intake is associated with metabolic syndrome and the plasma C-reactive protein concentration in women. J Nutr. 2009;139(2):335–339. doi: 10.3945/jn.108.096297. [DOI] [PubMed] [Google Scholar]
- 27.Riboli E, Hunt KJ, Slimani N, Ferrari P, Norat T, Fahey M, Charrondiere UR, Hemon B, Casagrande C, Vignat J, Overvad K, Tjonneland A, Clavel-Chapelon F, Thiebaut A, Wahrendorf J, Boeing H, Trichopoulos D, Trichopoulou A, Vineis P, Palli D, Bueno-De-Mesquita HB, Peeters PH, Lund E, Engeset D, Gonzalez CA, Barricarte A, Berglund G, Hallmans G, Day NE, Key TJ, Kaaks R, Saracci R (2002) European Prospective Investigation into Cancer and Nutrition (EPIC): study populations and data collection. Public Health Nutr 5(6B):1113–1124 [DOI] [PubMed]
- 28.Boeing H, Wahrendorf J, Becker N. EPIC-Germany—a source for studies into diet and risk of chronic diseases. European Investigation into Cancer and Nutrition. Ann Nutr Metab. 1999;43(4):195–204. doi: 10.1159/000012786. [DOI] [PubMed] [Google Scholar]
- 29.Boeing H, Korfmann A, Bergmann MM. Recruitment procedures of EPIC-Germany. European Investigation into Cancer and Nutrition. Ann Nutr Metab. 1999;43(4):205–215. doi: 10.1159/000012787. [DOI] [PubMed] [Google Scholar]
- 30.Weikert C, Stefan N, Schulze MB, Pischon T, Berger K, Joost HG, Haring HU, Boeing H, Fritsche A. Plasma fetuin-A levels and the risk of myocardial infarction and ischemic stroke. Circulation. 2008;118(24):2555–2562. doi: 10.1161/CIRCULATIONAHA.108.814418. [DOI] [PubMed] [Google Scholar]
- 31.Ford ES, Schulze MB, Bergmann MM, Thamer C, Joost HG, Boeing H. Liver enzymes and incident diabetes: findings from the European Prospective Investigation into Cancer and Nutrition (EPIC)-Potsdam study. Diabetes Care. 2008;31(6):1138–1143. doi: 10.2337/dc07-2159. [DOI] [PubMed] [Google Scholar]
- 32.Bohlscheid-Thomas S, Hoting I, Boeing H, Wahrendorf J. Reproducibility and relative validity of food group intake in a food frequency questionnaire developed for the German part of the EPIC project. European Prospective Investigation into Cancer and Nutrition. Int J Epidemiol. 1997;26(Suppl 1):S59–S70. doi: 10.1093/ije/26.suppl_1.S59. [DOI] [PubMed] [Google Scholar]
- 33.Spranger J, Kroke A, Möhlig M, Bergmann MM, Ristow M, Boeing H, Pfeiffer AF. Adiponectin and protection against type 2 diabetes mellitus. Lancet. 2003;361(9353):226–228. doi: 10.1016/S0140-6736(03)12255-6. [DOI] [PubMed] [Google Scholar]
- 34.Stefan N, Haring H-U, Schulze MB. Association of Fetuin-A level and diabetes risk. JAMA. 2008;300(19):2247. doi: 10.1001/jama.2008.614. [DOI] [PubMed] [Google Scholar]
- 35.Heni M, Ketterer C, Thamer C, Herzberg-Schafer SA, Guthoff M, Stefan N, Machicao F, Staiger H, Fritsche A, Haring HU. Glycemia determines the effect of type 2 diabetes risk genes on insulin secretion. Diabetes. 2010;59(12):3247–3252. doi: 10.2337/db10-0674. [DOI] [PMC free article] [PubMed] [Google Scholar]
- 36.Klipstein-Grobusch K, Georg T, Boeing H. Interviewer variability in anthropometric measurements and estimates of body composition. Int J Epidemiol. 1997;26(Suppl 1):S174–S180. doi: 10.1093/ije/26.suppl_1.S174. [DOI] [PubMed] [Google Scholar]
- 37.Schulze MB, Hoffmann K, Kroke A, Boeing H. Dietary patterns and their association with food and nutrient intake in the European Prospective Investigation into Cancer and Nutrition (EPIC)-Potsdam study. Br J Nutr. 2001;85(3):363–373. doi: 10.1079/BJN2000254. [DOI] [PubMed] [Google Scholar]
- 38.Rösen P, Nawroth PP, King G, Moller W, Tritschler HJ, Packer L. The role of oxidative stress in the onset and progression of diabetes and its complications: a summary of a Congress Series sponsored by UNESCO-MCBN, the American Diabetes Association and the German Diabetes Society. Diabetes Metab Res Rev. 2001;17(3):189–212. doi: 10.1002/dmrr.196. [DOI] [PubMed] [Google Scholar]
- 39.Oberley LW. Free radicals and diabetes. Free Radic Biol Med. 1988;5(2):113–124. doi: 10.1016/0891-5849(88)90036-6. [DOI] [PubMed] [Google Scholar]
- 40.Samuel VT, Liu ZX, Qu X, Elder BD, Bilz S, Befroy D, Romanelli AJ, Shulman GI. Mechanism of hepatic insulin resistance in non-alcoholic fatty liver disease. J Biol Chem. 2004;279(31):32345–32353. doi: 10.1074/jbc.M313478200. [DOI] [PubMed] [Google Scholar]
- 41.Lee DH, Blomhoff R, Jacobs DR., Jr Is serum gamma glutamyltransferase a marker of oxidative stress? Free Radic Res. 2004;38(6):535–539. doi: 10.1080/10715760410001694026. [DOI] [PubMed] [Google Scholar]
- 42.Stark AA. Oxidative metabolism of glutathione by gamma-glutamyl transpeptidase and peroxisome proliferation: the relevance to hepatocarcinogenesis. A hypothesis. Mutagenesis. 1991;6(4):241–245. doi: 10.1093/mutage/6.4.241. [DOI] [PubMed] [Google Scholar]
- 43.Paolicchi A, Tongiani R, Tonarelli P, Comporti M, Pompella A. Gamma-glutamyl transpeptidase-dependent lipid peroxidation in isolated hepatocytes and HepG2 hepatoma cells. Free Radic Biol Med. 1997;22(5):853–860. doi: 10.1016/S0891-5849(96)00422-4. [DOI] [PubMed] [Google Scholar]
- 44.Drozdz R, Parmentier C, Hachad H, Leroy P, Siest G, Wellman M. Gamma-glutamyltransferase dependent generation of reactive oxygen species from a glutathione/transferrin system. Free Radic Biol Med. 1998;25(7):786–792. doi: 10.1016/S0891-5849(98)00127-0. [DOI] [PubMed] [Google Scholar]
- 45.Parillo M, Riccardi G. Diet composition and the risk of type 2 diabetes: epidemiological and clinical evidence. Br J Nutr. 2004;92(1):7–19. doi: 10.1079/BJN20041117. [DOI] [PubMed] [Google Scholar]
- 46.Song Y, Manson JE, Buring JE, Liu S. A prospective study of red meat consumption and type 2 diabetes in middle-aged and elderly women: the women’s health study. Diabetes Care. 2004;27(9):2108–2115. doi: 10.2337/diacare.27.9.2108. [DOI] [PubMed] [Google Scholar]
- 47.Portha B, Giroix MH, Cros JC, Picon L. Diabetogenic effect of N-nitrosomethylurea and N-nitrosomethylurethane in the adult rat. Ann Nutr Aliment. 1980;34(5–6):1143–1151. [PubMed] [Google Scholar]
- 48.Jiang R, Manson JE, Meigs JB, Ma J, Rifai N, Hu FB. Body iron stores in relation to risk of type 2 diabetes in apparently healthy women. JAMA. 2004;291(6):711–717. doi: 10.1001/jama.291.6.711. [DOI] [PubMed] [Google Scholar]
- 49.Peppa M, Goldberg T, Cai W, Rayfield E, Vlassara H. Glycotoxins: a missing link in the “relationship of dietary fat and meat intake in relation to risk of type 2 diabetes in men”. Diabetes Care. 2002;25(10):1898–1899. doi: 10.2337/diacare.25.10.1898. [DOI] [PubMed] [Google Scholar]
- 50.LeDoux SP, Woodley SE, Patton NJ, Wilson GL. Mechanisms of nitrosourea-induced beta-cell damage. Alterations in DNA. Diabetes. 1986;35(8):866–872. doi: 10.2337/diabetes.35.8.866. [DOI] [PubMed] [Google Scholar]
- 51.Lijinsky W. N-Nitroso compounds in the diet. Mutat Res. 1999;443(1–2):129–138. doi: 10.1016/s1383-5742(99)00015-0. [DOI] [PubMed] [Google Scholar]
- 52.Hodgson JM, Ward NC, Burke V, Beilin LJ, Puddey IB. Increased lean red meat intake does not elevate markers of oxidative stress and inflammation in humans. J Nutr. 2007;137(2):363–367. doi: 10.1093/jn/137.2.363. [DOI] [PubMed] [Google Scholar]
- 53.Schulze MB, Hoffmann K, Boeing H, Linseisen J, Rohrmann S, Mohlig M, Pfeiffer AF, Spranger J, Thamer C, Haring HU, Fritsche A, Joost HG. An accurate risk score based on anthropometric, dietary, and lifestyle factors to predict the development of type 2 diabetes. Diabetes Care. 2007;30(3):510–515. doi: 10.2337/dc06-2089. [DOI] [PubMed] [Google Scholar]
- 54.Fraser A, Harris R, Sattar N, Ebrahim S, Smith GD, Lawlor DA. Gamma-glutamyltransferase is associated with incident vascular events independently of alcohol intake: analysis of the British Women’s Heart and Health Study and meta-analysis. Arterioscler Thromb Vasc Biol. 2007;27(12):2729–2735. doi: 10.1161/ATVBAHA.107.152298. [DOI] [PubMed] [Google Scholar]
- 55.Fraser A, Harris R, Sattar N, Ebrahim S, Davey Smith G, Lawlor DA. Alanine aminotransferase, gamma-glutamyltransferase, and incident diabetes: the British Women’s Heart and Health Study and meta-analysis. Diabetes Care. 2009;32(4):741–750. doi: 10.2337/dc08-1870. [DOI] [PMC free article] [PubMed] [Google Scholar]
- 56.Lee C, Adler A, Sandhu M, Sharp S, Forouhi N, Erqou S, Luben R, Bingham S, Khaw K, Wareham N. Association of C-reactive protein with type 2 diabetes: prospective analysis and meta-analysis. Diabetologia. 2009;52(6):1040–1047. doi: 10.1007/s00125-009-1338-3. [DOI] [PubMed] [Google Scholar]
- 57.Kaptoge S, Di Angelantonio E, Lowe G, Pepys MB, Thompson SG, Collins R, Danesh J. C-Reactive protein concentration and risk of coronary heart disease, stroke, and mortality: an individual participant meta-analysis. Lancet. 2010;375(9709):132–140. doi: 10.1016/S0140-6736(09)61717-7. [DOI] [PMC free article] [PubMed] [Google Scholar]
- 58.Al-Delaimy WK, Jansen EH, Peeters PH, van der Laan JD, van Noord PA, Boshuizen HC, van der Schouw YT, Jenab M, Ferrari P, Bueno-de-Mesquita HB. Reliability of biomarkers of iron status, blood lipids, oxidative stress, vitamin D, C-reactive protein and fructosamine in two Dutch cohorts. Biomarkers. 2006;11(4):370–382. doi: 10.1080/13547500600799748. [DOI] [PubMed] [Google Scholar]
- 59.Pischon T, Hotamisligil GS, Rimm EB. Adiponectin: stability in plasma over 36 hours and within-person variation over 1 year. Clin Chem. 2003;49(4):650–652. doi: 10.1373/49.4.650. [DOI] [PubMed] [Google Scholar]
- 60.Garrow JS. Validation of methods for estimating habitual diet: proposed guidelines. Eur J Clin Nutr. 1995;49(4):231–232. [PubMed] [Google Scholar]