

Abstract
PAPf39, a 39 residue peptide fragment from human prostatic acidic phosphatase, has been shown to form amyloid fibrils in semen (SEVI), which increase HIV infectivity by up to five orders of magnitude. The sequence of the PAPf39 fibrillar core was identified using HDXMS and protease protection assays. The central and C-terminal regions are highly protected from HDX and proteolytic cleavage and, thus, are part of the fibrillar core. Conversely, the N-terminal region is unprotected from HDX and proteolytic cleavage, suggesting that it is exposed and not part of the fibrillar core. This finding was tested using two N-terminal truncated variants, PAPf39Δ1-8 and PAPf39Δ1-13. Both variants formed amyloid fibrils at neutral pH. However, these variants showed a markedly different pH dependence of fibril formation than PAPf39. PAPf39 fibrils can form at pH 7.7, but not at pH 5.5 and pH 2.5, while both N-terminal truncated variants can form fibrils at these pH values. Thus, the N-terminal region is not necessary for fibril formation but modulates the pH dependence of PAPf39 fibril formation. PAPf39Δ1-8 and PAPf39Δ1-13 are capable of seeding PAPf39 fibril formation at neutral pH, suggesting that these variants are structurally compatible with PAPf39. Yet, no mixed fibril formation occurs between the truncated variants and PAPf39 at low pH. This suggests that pH affects the PAPf39 monomer conformational ensemble, which is supported by far-UV CD spectroscopy. A conceptual model describing the pH dependence of PAPf39 aggregation is proposed and provides potential biological implications.
Amyloid fibrils are a well-characterized protein aggregate involved in many human diseases. Fibrils can form under a variety of conditions from many sequences, suggesting that they represent a stable generic protein conformation (1, 2). The amyloid fibril structure is proposed to have a core of beta strands arranged perpendicular to the fibril axis and a hydrogen bonding network parallel to the fibril axis (1, 3). The fibrillar core sequence is typically composed of hydrophobic residues and is often flanked by polar or charged residues (1).
Amyloid fibrils are involved in neurodegenerative diseases, diabetes, amyloidosis (1), biofilm formation, melanin synthesis (4), and were more recently implicated in HIV infectivity (5–7). Sexual transmission of HIV accounts for over 80% of new HIV-1 infections, with the highest transmission rates occurring when the infected partner is male (8). Semen enhances HIV infectivity (9) and the source of the HIV infectivity enhancement appears to be due to a number of cationic peptides that form amyloid fibrils (5–7). PAPf39, or Prostatic Acidic Phosphatase fragment of 39 residues (corresponding to residues 248 to 286 in human prostatic acidic phosphatase), is a cationic peptide that forms amyloid fibrils in semen which increase HIV infectivity by up to five orders of magnitude (5). Thus, understanding the mechanism of PAPf39 fibril formation may provide insights regarding HIV transmission via semen and lay a foundation for the development of therapeutics against this effect.
It has been established that PAPf39 fibrils have a beta sheet structure, are Thioflavin T (ThT) positive, and form via a nucleation-dependent elongation mechanism (10). Ionizable residues appear to mediate PAPf39 fibril formation, since fibril formation is dependent on pH and salt concentration. PAPf39 fibrils readily form at neutral pH in the presence of salt, but not in the absence of salt and/or at acidic pH (10). Thus, ionizable residues appear to be important in modulating the pH dependence of PAPf39 fibril formation.
In this work, the residues involved in the PAPf39 fibrillar core were identified using hydrogen-deuterium exchange mass spectrometry (HDXMS) which was further supported by protease protection assays. It was found that the central and C-terminal regions are part of the PAPf39 fibrillar core, while the N-terminal region is not. Based on these experiments, two PAPf39 variants lacking sequences outside of the fibrillar core were characterized to determine the ability of these variants to form fibrillar structures at different pH values. It was found that the N-terminal region is not necessary for fibril formation, but is important in determining the pH dependence of fibril formation. Furthermore, intermolecular charge-charge repulsion between PAPf39 N-terminal regions is not responsible for the pH dependence of fibril formation. Rather, changes in pH alter the conformation of the PAPf39 monomer causing fibril formation to be inhibited at low pH.
Experimental Procedures
Buffer Preparation
Milli-Q water (Millipore, Billerica, MA) was used for all buffers. Phosphate buffered saline (PBS) pH 7.7 was prepared as a 10x concentrated stock solution containing 1.37 M NaCl, 27 mM KCl, 101.4 mM sodium phosphate dibasic, 17.6 mM potassium phosphate monobasic, and 0.3076 M sodium azide (0.2% w/v). The stock solution was then diluted ten-fold to a give working solution of PBS pH 7.7. In order to generate PBS pH 5.5 and pH 2.5, the 10x PBS pH 7.7 stock was diluted ten-fold and the pH was subsequently adjusted to either pH 5.5 or pH 2.5 using hydrochloric acid. Acetate buffered saline (ABS) pH 5.5 was prepared to mimic the salt concentration of the PBS solutions as closely as possible and contained 1.8 mM acetic acid, 10.1 mM sodium acetate anhydrous, 137 mM sodium chloride, 4.4 mM potassium chloride, and 30.76 mM sodium azide (0.02% w/v). Sodium phosphate buffer (PB) pH 7.7, 20 mM was prepared through the ten-fold dilution of a 10x concentrated stock solution of 200 mM PB pH 7.7 (78.85 mM sodium phosphate monobasic, 121.5 mM sodium phosphate dibasic, and 0.2% w/v sodium azide, pH 7.7).
Peptide
The PAPf39, PAPf39Δ1-8, and PAPf39Δ1-13 peptides were synthesized using standard Fmoc chemistry at the Penn State College of Medicine Macromolecular Core Facility. The PAPf39 peptides were purified on a C18 reverse-phase HPLC column (Discovery Bio Wide pore C18 10 μm, Supelco Sigma-Aldrich, Bellefonte, PA) using a methanol gradient in the presence of 0.05% trifluoroacetic acid (TFA). For each peptide, the fractions containing the purified peptide were pooled and subjected to three cycles of lyophilization and resuspension in Milli-Q water to remove residual TFA. The molecular masses of the peptides, as determined by ExPASy’s proteomics server (11) - 4551.4, 3645.4, and 3103.8 Da for PAPf39, PAPf39Δ1-8, and PAPf39Δ1-13, respectively - were confirmed by mass spectroscopy (Bruker Ultraflex III MALDI TOF/TOF, Bruker Daltonics, Billerica, MA). Peptide concentrations were determined using a molar extinction coefficient of 2,980 M−1 c−1 at 280 nm.
PAPf39 Peptide Fibril Preparation
PAPf39 fibrils for the pH-induced fibril dissociation assays, HDXMS, and protease protection assays were prepared by dissolving dry PAPf39 peptide (2 mg/ml) in PBS pH 7.7 on ice and incubating the sample for 48 hours at 37°C with agitation. Due to the limited solubility of the variants, fibrils used for the fibril formation kinetics and seeding assays were prepared by dissolving dry peptide monomer in 3.5 mM hydrochloric acid pH 2.5 at concentration 6 mg/ml. The samples were subsequently diluted three-fold in a dilution buffer to yield a 2 mg/ml (439.4 μM of full length PAPf39, 548.6 μM of PAPf39Δ1-8, and 644.4 μM of PAPf39Δ1-13) peptide solution. Dilution buffers used were 18 mM PBS pH 8.1, 18 mM PBS pH 5.88, 18 mM ABS pH 6.14, and 18 mM PBS pH 2.6, which upon dilution with one part 6 mg/mL peptide in 3.5 mM HCl and two parts dilution buffer, yielded final buffer compositions equivalent to PBS pH 7.7, PBS pH 5.5, ABS pH 5.5, and PBS pH 2.5, respectively. The samples were prepared on ice and fibril formation was initiated immediately after preparation. For seeding assays, 2% v/v of 2 mg/ml preformed fibril (formed by incubation for 48 hours with agitation at 37°C) was added to the sample immediately before incubation under the desired conditions.
Atomic Force Microscopy (AFM)
Atomic force microscopy (AFM) amplitude and height images were acquired using AC tapping mode in air at room temperature and humidity on a MFP-3D, AFM (Asylum Research, Santa Barbara, CA), using a silicon, Al reflex coated cantilever with a tip radius of 9 nm, resonant frequency of 70 kHz, and spring constant of 2 N/m (AC240TS, Olympus America Inc., Center Valley, PA). AFM images were analyzed in the Igor Pro MFP3D software (Wavemetrics Inc., Portland, OR). AFM plates were prepared by spotting 5 to 25 μL of 0 to 20 fold diluted samples on freshly cleaved mica and were incubated at room temperature for twenty minutes followed by a gentle wash with 4 ml of Milli-Q water to remove extra sample layers and buffer salts. The plates were allowed to dry overnight prior to imaging.
Thioflavin T Fluorescence Measurements
Thioflavin T (ThT) fluorescence assays were performed at 37°C on a Fluoromax-4 spectrofluorometer (Horiba Jobin Yvon, Kyoto, Japan) using FluorEssence software in a 10 mm cuvette. For the pH dependence of PAPf39 fibril dissociation, HDXMS, and protease protection experiments, ThT fluorescence assays were prepared by mixing 50 μL of sample, 60 μL of 100 μM ThT in 20 mM phosphate buffer pH 7.7, and 440 μL of PBS pH 7.7 (total volume of 550 μL). For all other ThT measurements, ThT fluorescence assays were prepared by mixing 25 μL of sample, 30 μL of 100 μM ThT in 20 mM phosphate buffer pH 7.7, and 495 μL of PBS pH 7.7 (total volume of 550 μL) to ensure that the fluorescence signal remained within the linear range of the instrument. The samples were excited at 440 nm and the fluorescence emission intensity was collected at 482 nm for 90 s and averaged. The fluorescence intensity was corrected for fluctuations in the lamp intensity by dividing the fluorescence signal by the lamp intensity. Error bars are the standard deviation of at least three independent experiments.
Hydrogen-Deuterium Exchange Assays
HDX was assayed using Electrospray Ionization Liquid Chromatography Mass Spectrometry (ESI-LC-MS) for three samples: exchanged fibrils, fully exchanged monomer, and in-exchange monomer. For each sample, five independent experiments were performed. PAPf39 fibrils were formed by agitating 2 mg/ml of PAPf39 dissolved directly in PBS, pH 7.7 for 48 hours at 37°C. The presence of fibrils prior to HDX was confirmed using ThT fluorescence assays and AFM imaging, as described above. PAPf39 fibrils were pelleted via centrifugation at 14,000 rpm (20,200 x g) for 20 min at 4°C. The supernatant was removed and the fibril pellet was resuspended in 20 mM PB pH 7.7, 98% D2O, 2% H2O, for the exchanged fibril sample. The fully exchanged monomer was prepared by dissolving dry PAPf39 monomer in the same buffer at a concentration of 2 mg/ml. Both the fibrils and monomer were allowed to exchange for one hour at 25°C to generate the exchanged fibril and fully exchanged monomer samples. Importantly, fibril formation does not occur in the exchange buffer (10), but preformed fibrils are stable (see Figure 2). HDX was quenched and the fibrils were dissociated by placing the samples on ice and diluting the sample ten-fold in 100% H2O based 20 mM PB pH 2.3. This lowered the pH to 2.5 and gave a final PAPf39 peptide concentration of 0.2 mg/ml. These quenching conditions (pH 2.5, on ice) were chosen since the HDX rate is reduced at lower temperatures (12, 13) and reaches a minimum at pH ~2.5 (12, 14). In addition, low pH inhibits fibril formation and dissociates PAPf39 fibrils rapidly (Figures 1–2) Pepsin (porcine gastric mucosa, 3,200–4,500 units/mg, Sigma-Aldrich, St. Louis, MO) was added to the samples to a final concentration of 0.2 mg/ml from a 10 mg/ml stock solution in H2O (~9.6% final D2O content) to induce PAPf39 peptide fragmentation. The in-exchange monomer samples were prepared by dissolving 0.2 mg/ml of dry PAPf39 monomer in 20 mM PB pH 2.5, 9.8% D2O, 4°C and adding pepsin to a final concentration of 0.2 mg/ml (~9.6% final D2O content). As a control, 0.2 mg/ml of unexchanged PAPf39 monomer in H2O based 20 mM PB pH 2.5 was cleaved with 0.2 mg/ml of pepsin and analyzed using LC-MS.
Figure 2.

Effect of pH on PAPf39 fibril dissociation. Panel A: ThT fluorescence intensity of preformed PAPf39 fibrils after 24 hours at room temperature in different buffers. Corresponding AFM images can be found in Figure S2. Panel B: Kinetics of pH-induced dissociation of preformed PAPf39 fibrils as monitored by light scattering at pH 2.8. The time point of HCl addition is indicated by an arrow.
Figure 1.

Sequence of the PAPf39, PAPf39Δ1-8, and PAPf39Δ1-13 peptides (panel A) and the effect of pH on fibril formation as monitored by ThT fluorescence (panels B–E) and AFM imaging (panels F–Q). Black, red, and green bars are for the PAPf39, PAPf39Δ1-8, and PAPf39Δ1-13 peptides, respectively. AFM images for each peptide were taken after incubation for 48 hours in different buffers (specified for each row on the figure). Scale bars on the AFM images are 500 nm.
The LC-MS analysis was performed as follows. Samples (4 μL) were loaded on to a C-18 reverse phase HPLC column (BioBasic-C18, Thermo Electron Corporation, Waltham, MA) using a NanoFlow auto-sampler (Agilent, Santa Clara, CA) and eluted at 200 μL/min in a 0% (0.2% formic acid in water) to 80% (0.2% formic acid in acetonitrile) organic phase gradient over 20 minutes. The eluent was directly injected into the electrospray mass spectrometer Thermo Scientific LTQ Orbitrap XL (Thermo Fisher Scientific Inc., Waltham, MA). Mass spectra were deconvoluted to a single charge state using the Xcalibur Xtract 2.0.7 software. Peptide fragments were identified in the unexchanged PAPf39 monomer controls using SEQUEST in the Proteome Discoverer software (Thermo Fisher Scientific Inc., Waltham, MA) and manually with ExPASy’s FindPept tool (11). Individual peptide fragment deuteration levels were determined using two different approaches to ensure the robustness of the analysis. Both methods correct for the effects of local sequence on HDX (12, 14) by comparing the HDX of the PAPf39 fibrils to the monomer, which has the same local sequence effects, but is random coil (10) and lacks the HDX protection observed in the fibrils.
In the first approach, the centroid of each peptide fragment isotopic envelope was extracted and used to calculate the percent HDX in the fibril for each peptide fragment as:
| (1) |
where H is the percent HDX for an individual peptide fragment, mF is the centroid mass from the exchanged fibril sample, mI is the centroid mass from the in-exchange monomer sample, and mM is the centroid mass from the fully exchanged monomer sample (15, 16).
In the second approach, the distribution of deuterium incorporation was calculated for each peptide fragment using the linear fit method described in Chik et al. (17). A weighted average of the deuterium incorporation distribution was used to calculate the average percent HDX for each fragment in the in-exchange monomer, exchanged fibril, and fully exchanged monomer samples, assuming that the maximum number of amide protons exchanged. The HDX of the fibrils was subsequently corrected for in-exchange and back-exchange using equation 1, where the centroid masses were substituted for the corresponding percent HDX for each sample.
The percent HDX of each peptide fragment was used to calculate the average percent HDX protection for each residue in the PAPf39 sequence. To test the robustness of the analysis, two averaging algorithms, weighted and unweighted, were used. In the weighted method, the calculated percent HDX of each peptide fragment, for which non-zero HDX was observed in the fully exchanged monomer, was used in a modified version of the equation described in Damo et al. (18):
| (2) |
where HXi is the average percent HDX protection for residue i, ni is the number of peptide fragments containing residue i, hj is the percent HDX for a peptide fragment j containing residue i, and mj is the number of exchangeable backbone amide sites in peptide fragment j. In the unweighted averaging algorithm, the average percent HDX protection is calculated as:
| (3) |
where HXi is the percent HDX protection for residue i, ni is the number of peptide fragments containing residue i, and hj is the percent HDX for a peptide fragment j containing residue i. Again, only peptide fragments for which exchange was observed in the fully exchanged monomer were used in the calculations because peptide fragments with no HDX in the fully exchanged monomer sample contain no protection information. Four combinations of the above calculations (the centroid or linear method in equation 1 with weighted or unweighted averaging in equations 2 or 3, respectively) were used to determine the PAPf39 fibril HDX protection profiles. Errors were calculated as the standard deviation between five independent experiments. All combinations yielded quantitatively similar results (Figure S1E), however, only the profile calculated from the centroid method with weighted averaging is shown in the main body of the paper.
Although an abundance of PAPf39 fragments were generated from cleavage between residues 16 and 17, many peptide fragments overlap this cleavage site, and no major changes are observed in the HDX protection profile near this cleavage site (Figures 3 and S1). This suggests that the observed HDX protection profile is not simply a result of the cleavage pattern of the PAPf39 peptide. Furthermore, to ensure that uneven sequence coverage between the N- and C-terminal regions of PAPf39 (Figure S1F) does not affect the HDX protection profile, values from random subsets of sequences were used to calculate the HDX protection profile. The subsets were chosen such that approximately equal numbers of sequences covered each residue. Importantly, the HDX protection profiles generated in this analysis were similar to the HDX protection profile when all sequences were used, confirming that the HDX protection profile is not a result of the sequence coverage. Furthermore, a jackknife analysis was used to confirm that the HDX protection of a single peptide fragment does not determine the HDX protection profile. These analyses demonstrated that the calculated HDX protection profile represents consensus HDX behavior and is not due to HDX fluctuations in a single peptide fragment or subset of fragments.
Figure 3.
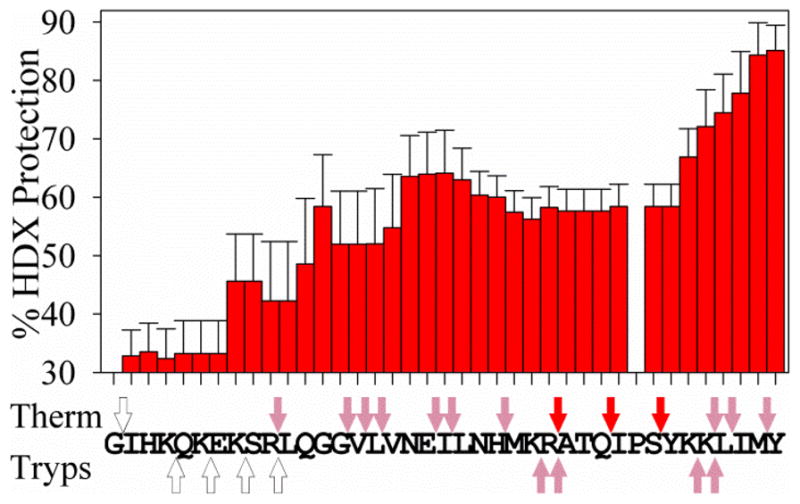
PAPf39 fibril core sequence determination by HDXMS and protease protection assays. The bar graph shows the sequence averaged percent protection of PAPf39 fibrils from HDX. Bars are the average protection calculated from five independent experiments and error bars are one standard deviation from the mean. The arrows above and below the PAPf39 sequence show the results of the protease protection assays using thermolysin (Therm) and trypsin (Tryps). White, pink, and red arrows indicate less than five-fold, between five and fifteen-fold, and greater than fifteen-fold protection, respectively, from proteolytic cleavage at the indicated cleavage site. The protease protection values are calculated from the average protection for both N- and C-terminal primary fragments from three independent experiments. See Experimental Procedures for more details on these experiments and Figure S5 for numerical values from the protease protection assays.
Protease Protection Assays
Protease protection assays were performed using two proteases with different sequence specificity: thermolysin (Bacillus thermoproteolyticus rokko, Type X, 50–100 units/mg, Sigma-Aldrich, St. Louis, MO) and trypsin (bovine pancreas, Type XI, ≥6,000 units/mg, Sigma-Aldrich, St. Louis, MO). The cleavage reaction was initiated by mixing PAPf39 monomer or fibrils with protease at a 1000 (PAPf39 monomer):1 (protease) mass ratio (in PBS pH 7.7, 0.8 mM CaCl2) followed by incubation at 37°C for ten minutes, at which time formic acid was added to a final concentration of 0.4% (v/v) to quench the reaction and dissociate the fibrils. Samples were flash frozen with liquid nitrogen and stored at −80°C until use. The cleaved samples were separated and analyzed by LC-MS, similar to the procedure described in the previous section.
Peptide proteolytic fragment peaks and retention times were identified manually using predicted peptide cleavage fragments generated by the Protein Prospector MS-Digest program (UCSF). Peptide cleavage fragments were identified in the Xcalibur software, using mass and retention time pairs and the area of the elution peak for a single peptide was calculated to determine the relative amount of peptide produced by proteolytic cleavage. The area of the peptide elution peak varied linearly with peptide concentration as determined by analyzing PAPf39 monomer controls at different concentrations, confirming that this method can be used to determine the relative amount of peptide in a sample. In this analysis, only primary peptide proteolytic fragment sequences (i.e. containing only one cleavage site) were used since it is not known if the fibrillar structure is altered as a result of the first cleavage event. A cleavage site was assigned to each primary sequence, and the elution peak area of the peptide proteolytic fragment in the monomer was divided by the elution peak area of the peptide proteolytic fragment in the fibril to determine the fold protection of a particular cleavage site in the fibrils, as compared to the monomer. Importantly, this calculation normalizes for the effect of the local sequence on the frequency of proteolytic cleavage. The average protection for a cleavage site was determined from the protection values calculated from both the N- and C-terminal primary sequence fragments in three independent sample replicates.
Far-UV Circular Dichroism
Far-UV CD spectra were recorded on a Jasco-715 spectropolarimeter at 10°C from 190 to 260 nm in a 1 mm light path length cylindrical quartz cuvette. PAPf39, PAPf39Δ1-8, and PAPf39Δ1-13 peptide samples were prepared at 10 mg/ml in 3.5 mM HCl pH 2.5 and then diluted to 0.2 mg/ml in CD buffer (1 mM sodium borate, 1 mM sodium citrate, 1 mM sodium phosphate, and 10 mM NaCl) with pH 7.7, pH 5.5, or pH 2.5. For each condition, spectra for three independent replicates were averaged and the reported errors are one standard deviation from the mean. For each replicate, four wavelength scans (three accumulations each) were averaged. The ellipticity of the peptide solution (θ) was corrected by subtracting the buffer baseline and converted to molar ellipticity using the equation Θ = θM/(10lc), where M is the peptide molecular mass, l is the light path length in centimeters, and c is the peptide concentration in mg/ml.
Results
pH Dependence of PAPf39 Fibril Formation and Dissociation
It is known that PAPf39 fibrils form in phosphate buffered saline (PBS) pH 7.7 in the presence of agitation, but not in the absence of agitation, at salt concentrations below ~100 mM, and/or at low pH (i.e. pH 2.5, 2% acetic acid) (10). Four residues in the PAPf39 sequence change ionization state between pH 7.7 and pH 2.5 and may be responsible for the pH dependence of PAPf39 fibril formation (Figure 1A). There are two histidine residues (unperturbed side chain pKa ~6.5 (19)) in positions 3 and 23 that change from neutral to positively charged and two glutamic acid residues (unperturbed side chain pKa ~4.3 (19)) in positions 7 and 19 that change from negatively charged to neutral between pH 7.7 and 2.5. To determine which of these residues are responsible for the pH dependence of fibril formation, PAPf39 fibril formation was tested at pH 5.5. Assuming no pKa shifts, at pH 5.5 histidine residues are positively charged while glutamic acid residues remain neutral, thus allowing the possible effects of histidine residues versus glutamic acid residues to be separated. In these experiments, 2 mg/ml of the PAPf39 peptide in PBS pH 7.7, PBS pH 5.5, ABS (acetate buffered saline) pH 5.5, or PBS pH 2.5 were incubated with agitation at 37°C. Both PBS pH 5.5 and ABS pH 5.5 were used for incubation since phosphate does not buffer well at this pH and there may be differences in fibril formation in acetate versus phosphate buffer.
PAPf39 fibril formation occurred in PBS pH 7.7, as previously observed (10), but did not occur in PBS pH 5.5, ABS pH 5.5, or PBS pH 2.5. This was shown by increases in ThT fluorescence intensity and the observation of fibrils in AFM images for the PBS pH 7.7 incubations as a function of time, but not for the PBS pH 5.5, ABS pH 5.5, or PBS pH 2.5 samples (Figure 1B–I).
Fibril formation at pH 5.5 and pH 2.5 may be limited if acidic pH disfavors conformations in the monomer capable of nucleation or elongation, or if the fibrillar structure of PAPf39 is not stable under acidic conditions. In order to determine if PAPf39 fibrils are stable at low pH, the dissociation of PAPf39 fibrils formed in PBS pH 7.7 was monitored using ThT fluorescence assays and AFM imaging. Dissociation assays were performed at room temperature both in the presence and absence of agitation by collecting fibrils (via centrifugation) and resuspending them in PBS pH 7.7, PB pH 7.7, PBS pH 5.5, ABS pH 5.5, and PBS pH 2.5. No observable fibril dissociation occurred after the fibrils were incubated for 24 hours in PBS pH 7.7 or PB pH 7.7 (Figure 2A). This confirms that even though salt concentrations above ~100 mM are necessary for fibril formation (10), assembled fibrils remain stable at pH 7.7 in low salt buffer. Preformed fibrils appeared to completely dissociate after incubation in PBS pH 2.5 for 24 hours. Only partial dissociation was observed after 24 hours when the preformed fibrils were incubated in PBS pH 5.5 or ABS pH 5.5 (Figure 2A). Indeed, ThT assays of samples after 24 hours of incubation show only some decrease in fluorescence intensity for the pH 5.5 buffers, while there is no decrease in fluorescence intensity for pH 7.7 buffers and minimal ThT fluorescence intensity in the PBS pH 2.5 sample. At the same time, AFM images show the presence of fibrils in samples at pH 7.7 and 5.5 resuspension buffers, but not in PBS pH 2.5 (Figure S2). These results suggest that although fibril dissociation occurs at both pH 5.5 and 2.5, the dissociation process is much slower at pH 5.5. Furthermore, ThT fluorescence intensities and AFM images did not significantly differ between the agitated and stationary samples (Figure S2).
Since PAPf39 fibrils formed at pH 7.7 appear to rapidly dissociate at pH 2.5, the kinetics of PAPf39 fibril dissociation was probed at low pH (Figure 2B). In these assays, PAPf39 fibril dissociation was induced by adding hydrochloric acid to reduce the pH to 2.8 and the kinetics of dissociation was monitored by light scattering. The light scattering intensity of the PAPf39 fibrils remained high until acid was injected, after which the light scattering intensity rapidly decreased to the buffer baseline, indicating fibril dissociation (Figure 2B). Under these conditions, fibril dissociation was complete in ten seconds.
PAPf39 Fibril Core Sequence
In order to obtain insights into the location of ionizable residues within the PAPf39 fibrillar structure, two different experimental assays, Hydrogen-Deuterium Exchange Mass Spectrometry (HDXMS), and protease protection (PP), were used to identify the residues that form the PAPf39 fibrillar core.
Hydrogen-Deuterium Exchange Mass Spectrometry (HDXMS) was used to probe the fibrillar core of the PAPf39 fibrils (18, 20, 21). In these experiments, the deuterium incorporation in the in-exchanged monomer, exchanged monomer, and exchanged fibrils was measured by liquid chromatography-mass spectrometry (LC-MS) and used to determine the percent HDX protection over the sequence of the fibril. The monomer and fibril samples were exchanged in a deuterium based buffer (PB pH 7.7), where fibril formation does not occur (10), but preformed fibrils are stable (Figure 2A). Following HDX, the samples were rapidly quenched by placing the samples on ice and diluting the sample ten-fold in 100% H2O based 20 mM PB pH 2.3 (12–14), which leads to rapid dissociation of the fibrils (Figure 2B). The in-exchange sample was prepared by dissolving lyophilized monomer directly into ice cold buffer to match the final composition of the quenching conditions. All samples were cleaved with pepsin and immediately loaded for analysis by LC-MS. Figure S1 shows the mass spectra of a fragment with a monoisotopic mass of 2790.5 Da covering residues 17 to 39. Importantly, the exchanged monomer sample contains significantly more deuterium than the exchanged fibril sample, and the in-exchange monomer sample contains very little deuterium (Figure S1). The mass shifts due to deuterium incorporation are large enough to calculate the net percent HDX of the PAPf39 fibrils and determine the percent HDX protection (see Experimental Procedures for details). The percent HDX was calculated for each fragment using both the centroid and linear fit methods (see refs. (15–17) and equation 1). The percent HDX for all fragments with observable HDX in the fully exchanged monomer (for sequence coverage see Figure S1) were used in weighted and unweighted averaging algorithms (see equations 2 and 3, respectively) to calculate the average percent HDX protection over the PAPf39 sequence. Both the centroid and linear fit methods combined with the weighted and unweighted averaging algorithms yielded quantitatively similar results (for comparison see Figure S1). The results of the average percent HDX protection per residue calculated from the centroid method and the weighted averaging algorithm are shown in Figure 3.
The results of HDXMS experiments show that the HDX protection of residues 1 through 7, in the N-terminal region of PAPf39, is low (~33%). The HDX protection increases for residues 7 through 13, and levels off at approximately 60% for residues 14 through 33. In the C-terminal region, comprised of residues 34 through 39, the HDX protection further increases to approximately 85% (Figure 3). This suggests that the N-terminal region, from residues 1 through 7, is not part of the fibrillar core. Conversely, the increased HDX protection in the central region, between residues 14 and 33, suggests that it is involved in the PAPf39 fibrillar core. The high protection observed in the C-terminal region, between residues 34 and 39, indicates that this region may play an important role in the PAPf39 fibrillar core. This agrees with the previous observations that residues 13 through 18 in the central region of the peptide are able to form amyloid-like fibrils (22), that the removal of C-terminal residues 36 through 39 reduces fibril formation (5), and also with sequence based predictions of the amyloidogenic regions in the PAPf39 peptide (see Figure S1). The observed features in the HDX protection profile do not appear to be an experimental artifact because there is good sequence coverage, extensive sequence overlap between different peptide fragments, and each residue is present in multiple peptide fragments (Figure S1). The quantitatively similar results of the four methods used to calculate the HDX protection profile also demonstrate the robustness of the analysis of the experimental data (see Experimental Procedures and supplementary Figure S1).
A protease protection (PP) assay was used to support the HDX protection trends (23–25). In this assay, monomer and fibril samples were cleaved under limiting proteolysis conditions using thermolysin or trypsin. The primary fragments (peptides generated by one cleavage of PAPf39) were identified by LC-MS and their relative amounts were determined by integrating the elution peaks. The concentration of a cleavage product was assumed to correlate with the frequency of cleavage at a particular site and was used to calculate the protection of a cleavage site in the fibril versus the monomer (area of peptide fragment elution peak in the monomer divided by the area of the peptide fragment elution peak in the fibril). The proteolytic cleavage protection varies throughout the PAPf39 sequence (Figure 3) and appears to be independent of the protease used. There is less than five-fold protection in the N-terminal region (residues 1 through 9) and greater than five-fold protection for residues 14 through 39 (in the central and C-terminal regions). The validity of the PP results are supported by the presence of both N- and C-terminal fragments for each cleavage site and the agreement of the protection trend for both the N- and C-terminal fragments. The observed PP pattern is not a result of the protease specificity or cleavage site preference, since the frequency of cleavage in the monomer or fibril alone does not correlate with the protease protection. Finally, comparison of the fibril to the monomer normalizes for the effect of the local sequence on the frequency of proteolytic cleavage.
The PP profile can be compared to the HDXMS protection profile. These experiments provide two independent measures of the PAPf39 fibrillar core and appear to be in good qualitative agreement (Figure 3). Importantly, both the HDXMS and PP profiles suggest that the central and C-terminal regions are involved in the PAPf39 fibrillar core, while the N-terminal region is not.
Fibril Formation in PAPf39 Variants
The hydrogen-deuterium exchange and protease protection of the central and C-terminal regions of PAPf39 suggests that they are involved in the fibrillar core (Figure 3). Conversely, the lack of protection in the N-terminal region, suggests that it is not in the fibrillar core and is probably part of an unstructured region in the PAPf39 fibril. Thus, removing the N-terminal region should not affect fibril formation and may even enhance fibril formation since this unstructured region contains many ionizable residues. To test this hypothesis, two PAPf39 variants PAPf39Δ1-8 and PAPf39Δ1-13, corresponding to the PAPf39 peptide with the first eight and thirteen residues truncated, respectively (Figure 1A), were characterized. These variants were chosen because only the highly unprotected residues were removed in PAPf39Δ1-8, while PAPf39Δ1-13 has additional residues with intermediate protection removed.
Figure 1B compares the kinetics of fibril formation in PBS pH 7.7 of full length PAPf39 with PAPf39Δ1-8, and PAPf39Δ1-13 as monitored by ThT fluorescence assays. The kinetics of fibril formation for the variants followed sigmoidal curves, suggesting that the fibrils form via a nucleation-dependent elongation mechanism, similar to the fibril formation of full length PAPf39 (10). The PAPf39 truncated variants formed amyloid fibrils more readily than the full length PAPf39 peptide, as evidenced by shorter lag times (20 ± 3 hours, 1 ± 2 hours, and 1 ± 2 hours, for PAPf39, PAPf39Δ1-8, and PAPf39Δ1-13, respectively; see Table S1). Full length PAPf39 and variant fibrils were also observed using AFM imaging and the fibrils appear to be morphologically similar between all three peptides (Figure 1F, J, N and Table S1).
To further demonstrate that the variant fibrils are structurally similar to the PAPf39 fibrils, PAPf39Δ1-8 and PAPf39Δ1-13 fibrils formed in PBS pH 7.7 were used to seed PAPf39 fibril formation (10). Both variants were able to seed (induce) full length PAPf39 fibril formation, thus, suggesting that the variant fibrils are structurally similar to the full length PAPf39 fibrils (Figures 4 and S3). Furthermore, fibrils from the seeded incubations appear to have a similar morphology to the unseeded and seeded full length PAPf39 incubations, as shown by AFM images (Figure S3).
Figure 4.

Seeding of PAPf39 monomer with preformed PAPf39Δ1-8 fibrils at different pH values. ThT fluorescence intensity as a function of time for pH 5.5 no seed (black bars); pH 5.5 seed from pH 5.5 (red); pH 7.7 no seed (green); pH 7.7 seed from pH 7.7 (yellow); pH 7.7 seed from pH 5.5 (blue); and pH 7.7 seed from pH 2.5 (magenta). Seeding experiments where PAPf39 monomer is seeded with its own fibrils or PAPf39Δ1-13 fibrils, and corresponding AFM images are shown in Figure S3. See Experimental Procedures for more details on these experiments.
pH Dependence of PAPf39 Variant Fibril Formation
The results for the PAPf39 variants presented above demonstrate that that the N-terminal region is not necessary for fibril formation at neutral pH. PAPf39 does not appear to form fibrils at low pH and it is unclear which residues in the PAPf39 sequence are responsible for this effect. The PAPf39Δ1-8 and PAPf39Δ1-13 peptides lack two out of four possible residues that ionize between neutral and acidic pH (Figure 1A). Each of the variants does not contain histidine residue (H3) and glutamic acid residue (E7), allowing the contribution of changes in ionization state of these residues to the pH dependence of PAPf39 fibril formation to be determined.
The kinetics of PAPf39Δ1-8 and PAPf39Δ1-13 fibril formation was monitored in PBS pH 7.7, PBS pH 5.5, ABS pH 5.5, and PBS pH 2.5 by ThT fluorescence measurements (Figure 1B–E) and AFM imaging (Figure 1J–Q). Full length PAPf39 only formed fibrils at neutral pH, while both PAPf39 variants formed fibrils at all tested pH values (Figure 1). The most abundant fibril heights and lengths, as determined from the AFM data, were similar within one standard deviation between different incubation conditions and variants (Table S1), suggesting similarities in fibril morphology.
To test that PAPf39Δ1-8 fibrils formed at low pH are structurally similar to full length PAPf39, PAPf39 in PBS pH 7.7 was seeded with PAPf39Δ1-8 fibrils preformed in PBS pH 7.7, pH 5.5, or pH 2.5. PAPf39Δ1-8 was chosen for these experiments rather than PAPf39Δ1-13 because PAPf39Δ1-8 has fewer residues removed than PAPf39Δ1-13. PAPf39Δ1-8 fibrils preformed in PBS pH 7.7, pH 5.5, or pH 2.5 all seeded full length PAPf39 fibril formation at pH 7.7 with similar efficiency, as shown by shorter lag times in the seeded samples than in the unseeded sample (Figure 4) and the presence of fibrils in AFM images (Figure S3). Thus, PAPf39Δ1-8 fibrils preformed at all tested pH values are structurally compatible with full length PAPf39 fibrils. Although PAPf39Δ1-8 is capable of seeding PAPf39 fibril formation in PBS pH 7.7, PAPf39Δ1-8 fibrils do not seed PAPf39 fibril formation in PBS pH 5.5 or pH 2.5 (Figures 4, S3, and S4). This suggests that PAPf39 is incapable of forming fibrils at pH 5.5 or 2.5 and that the process is not limited by nucleation.
Mixed Peptide Fibril Characterization at pH 2.5
The N-terminal region of PAPf39 is necessary for the pH dependence of PAPf39 fibril formation and removal of the first eight residues (in PAPf39Δ1-8) eliminates the pH dependence of fibril formation. This region contains one negative and three positive charges at pH 7.7 and four positive charges at pH 2.5. Intermolecular charge-charge repulsion between positively charged residues in this region of PAPf39 may inhibit fibril formation at acidic pH and also cause preformed fibrils to dissociate at acidic pH. If this is the case, mixed fibrils between PAPf39 and PAPf39Δ1-8 should be observed at a certain molar excess of PAPf39Δ1-8. This will occur when the PAPf39 N-terminal region concentration is low relative to the core sequence (from both PAPf39 and PAPf39Δ1-8) concentration, thus weakening the intermolecular charge-charge repulsion between PAPf39 N-terminal regions and allowing fibrils to form. To test this hypothesis, PAPf39 and PAPf39Δ1-8 were incubated together in PBS pH 2.5 at 37°C with agitation in molar ratios of 75:25, 50:50, 25:75, and 0:100 of PAPf39 to PAPf39Δ1-8. Fibril formation was observed at these molar ratios, but there was no evidence that PAPf39 was incorporated into these fibrils as they all contained only PAPf39Δ1-8 (see Figure S4 and supplementary Experimental Procedures). These results show that at pH 2.5 PAPf39 and PAPf39Δ1-8 do not form mixed fibrils and suggests that charge-charge repulsion between PAPf39 N-terminal regions is not responsible for inhibiting fibril formation at pH 2.5. Rather, it appears that the PAPf39 monomer does not readily adopt a conformation amenable to elongation at pH 2.5.
Far-UV Circular Dichroism
The above results demonstrate that the N-terminal region is responsible for the pH dependence of fibril formation and that the pH dependence is not determined by intermolecular charge-charge repulsion of the N-terminal regions of PAPf39. Furthermore, since PAPf39 fibril formation can be seeded with PAPf39Δ1-8 at pH 7.7 but not at pH 5.5 or 2.5, it appears that fibril elongation is deficient at low pH in PAPf39. Thus, it is possible that pH alters the PAPf39 monomer conformation to inhibit fibril formation, while pH has little effect on PAPf39Δ1-8 or PAPf39Δ1-13. To test this hypothesis, far-UV CD spectra of PAPf39, PAPf39Δ1-8, and PAPf39Δ1-13 were obtained at pH 7.7, 5.5, and 2.5. Even though the spectra overall appear to have relatively small amplitudes around 220 nm, there are noticeable differences. The PAPf39 molar ellipticities at pH 5.5 and 2.5 are similar in this range, while the ellipticity at pH 7.7 has a lower signal, suggesting more secondary structure (Figure 5). Furthermore, the PAPf39Δ1-8 and PAPf39Δ1-13 molar ellipticities do not vary with pH, and have similar magnitudes, comparable yet somewhat larger than the molar ellipticity of PAPf39 at pH 7.7. These results suggest that truncated variants contain more secondary structure than PAPf39. This difference is particularly large at pH 5.5 and pH 2.5 where PAPf39 does not form fibrils while both PAPf39Δ1-8 and PAPf39Δ1-13 do.
Figure 5.

pH-dependence of far-UV CD ellipticity for PAPf39 (circles), PAPf39Δ1-8 (triangles), and PAPf39Δ1-13 (squares). Average values of the molar ellipticity between 215 and 225 nm are shown. See supplementary information for full CD spectra and the results of the secondary structure deconvolution analysis (Figure S6).
Discussion
This work aimed to determine which residues form the PAPf39 fibrillar core and to understand the pH dependence of PAPf39 fibril formation. The results of the HDXMS and protease protection assays suggest that the central and C-terminal regions of PAPf39 are part of the fibrillar core while the N-terminal region is not. The N-terminal region modulates the pH dependence of PAPf39 fibril formation since PAPf39 fibrils form at pH 7.7 but not at pH 5.5 or pH 2.5, while N-terminal truncation variants, PAPf39Δ1-8 and PAPf39Δ1-13, form fibrils at all tested pH values. From these experiments, it is evident that the PAPf39 N-terminal region is not necessary for fibril formation, but modulates the pH dependence of fibril formation.
There are two mechanisms which may account for the pH dependence of PAPf39 fibril formation. Modulating the pH to increase the net charge of the N-terminal region of PAPf39 may prevent monomer association through intermolecular charge-charge repulsion or alter the conformational ensemble of the monomer to inhibit fibrillation. The first mechanism can be ruled out for two main reasons. First, PAPf39 does not form fibrils when incubated with high concentrations of PAPf39Δ1-8 monomer or fibrils at pH 2.5. If charge-charge repulsion between PAPf39 N-terminal regions were responsible for the pH dependence of fibril formation, then decreasing the concentration of the N-terminal region while keeping the concentration of the core sequence constant should reduce this effect and allow fibril formation to occur. However, since PAPf39 and PAPf39Δ1-8 do not form mixed peptide fibrils when the monomers are incubated together (PAPf39Δ1-8 forms fibrils without incorporating PAPf39), charge-charge repulsion between PAPf39 N-terminal regions is not responsible for the pH dependence of fibril formation. Importantly, PAPf39Δ1-8 fibrils formed at all tested pH values seed PAPf39 fibril formation at neutral pH, verifying that PAPf39Δ1-8 fibrils are proficient at seeding and that the PAPf39 and PAPf39Δ1-8 fibril structures are compatible. Second, the ionic strength of the buffer does not appear to affect fibril formation at pH 2.5. If charge-charge repulsion was responsible for the pH dependence of fibril formation, then the salt concentration should affect fibril formation, since ions can shield charge-charge interactions. However, PAPf39 does not form fibrils in 2% acetic acid in the absence of salt (10) or in PBS pH 2.5 which has 137 mM NaCl. Furthermore, the fibril formation was tested in PBS for all pH values, eliminating ionic strength as a variable that may affect fibrillation. These results indicate that intermolecular charge-charge repulsion between PAPf39 N-terminal regions does not determine the pH dependence of PAPf39 fibrillation.
The pH dependence of PAPf39 fibril formation can be explained by conformational changes in the PAPf39 monomer (second mechanism), which is shown as a conceptual model in Figure 6. The model proposes that the PAPf39 monomer conformational ensemble changes between pH 7.7 and 5.5, making it capable of forming amyloid fibrils at pH 7.7 but not at pH 5.5 or pH 2.5. The conformational ensemble of the truncated variants, however, is not significantly altered by pH and is able to form fibrils at all tested pH values (Figure 6). These assertions are supported by the pH dependence of the far-UV CD spectra of the PAPf39, PAPf39Δ1-8, and PAPf39Δ1-13 monomers (Figure 5). The spectra suggest that the PAPf39 monomer contains more secondary structure at pH 7.7 than pH 5.5 or 2.5. The PAPf39Δ1-8 and PAPf39Δ1-13 monomer spectra, however, do not vary with pH and indicate that the truncation variants contain more secondary structure than PAPf39 particularly at pH 5.5 or pH 2.5. It also appears that the amount of monomer secondary structure is inversely correlated with the fibril formation lag time, since the PAPf39Δ1-8 and PAPf39Δ1-13 monomers contain more structure and have shorter lag times than PAPf39. Thus, alterations in the pH change the ionization state of residues in the N-terminal region, which alters the PAPf39 monomer conformational ensemble, causing pH dependent fibril formation. Similarly, the N-terminal region also appears to modulate PAPf39 fibril dissociation at low pH since PAPf39 fibrils formed at neutral pH dissociate at acidic pH (Figure 2), while PAPf39Δ1-8 and PAPf39Δ1-13 fibrils do not. Dissociation may occur due to conformational changes in the peptide subunits, which initiates the dissociation of monomeric units from the fibril ends.
Figure 6.

Conceptual model of the pH dependence of PAPf39 fibril formation and dissociation. Yellow, red, and blue regions represent the N-terminal, central, and C-terminal regions of the PAPf39 peptide, respectively. Peptides lacking the yellow N-terminal region represent the variant peptides. Background color indicates the pH conditions (green, orange, and red for pH 7.7, pH 5.5, and pH 2.5, respectively). The cartoon representation of the fibrils is inspired by the X-ray structure 3PPD (22). The depicted monomer structures intend to illustrate changes in the overall conformational ensemble.
Concluding Remarks
PAPf39 was first identified as a main component of semen-derived enhancer of viral infection (SEVI). It forms amyloid fibrils in semen which increase HIV infectivity by up to five orders of magnitude (5). The pH dependence of PAPf39 fibril formation and dissociation has interesting biological implications because the pH of semen (26) is markedly different than the pH of the vaginal tract (27). Since PAPf39 fibrils do not fully dissociate within 24 hours at pH 5.5, fibrils formed in semen (average pH of 7.7 (26)) may be stable enough to enhance HIV infectivity in the vaginal tract which has a pH of ~5.2, ranging between 3.6 and 7.7 (27), even if fibrils do not form at this pH. Furthermore, the HDX and protease protection assays suggest that the N-terminal region of PAPf39 is exposed (not part of the fibrillar core), and therefore may interact with HIV virus particles to facilitate transmission. Interestingly, it has been shown that cationic residues are essential to PAPf39 fibril mediated enhancement of HIV transmission (28) and it is possible that the cationic residues in the N-terminal region are responsible for enhancing HIV transmission.
Supplementary Material
Acknowledgments
Funding Source Statement
K.C.F. is supported by a National Science Foundation Graduate Research Fellowship. This work was supported by the National Institute of General Medical Science of the National Institutes of Health under award number 1R21GM101134 (to G.I.M.).
We thank Drs. Dmitri Zagorevski and Chris Bjornsson for their assistance in mass spectrometry and atomic force microscopy, and Mr. Morgan Jackson for help with the peptide purification.
Abbreviations
- ABS
Acetate buffered saline
- AFM
Atomic Force Microscopy
- CD
Circular Dichroism
- ESI-LC-MS
Electrospray Ionization-Liquid Chromatography-Mass Spectrometry
- HIV
Human Immunodeficiency Virus
- HDX
Hydrogen Deuterium Exchange
- HDXMS
HDX Mass Spectrometry
- HPLC
High Performance Liquid Chromatography
- LC-MS
Liquid Chromatography-Mass Spectrometry
- PAPf39
Prostatic Acidic Phosphatase fragment of 39 residues (residues 248–286 in human prostatic acidic phosphatase)
- PAPf39Δ1-8
N-terminally acetylated truncated variant of PAPf39 with the first eight residues removed
- PAPf39Δ1-13
N-terminally acetylated truncated variant of PAPf39 with the first thirteen residues removed
- PB
Phosphate buffer
- PBS
Phosphate buffered saline
- PP
Protease Protection
- SEVI
Semen-derived Enhancer of Viral Infection
- TFA
Trifluoroacetic Acid
- ThT
Thioflavin T
Footnotes
Supporting Information: Additional experimental procedures, one table reporting fibril morphology, and four figures providing additional details on ThT fluorescence and AFM experiments. This material is available free of charge via the Internet at http://pubs.acs.org.
References
- 1.Chiti F, Dobson CM. Protein Misfolding, Functional Amyloid, and Human Disease. Annu Rev Biochem. 2006;75:333–366. doi: 10.1146/annurev.biochem.75.101304.123901. [DOI] [PubMed] [Google Scholar]
- 2.Wetzel R. Ideas of Order for Amyloid Fibril Structure. Structure. 2002;10:1031–1036. doi: 10.1016/s0969-2126(02)00809-2. [DOI] [PubMed] [Google Scholar]
- 3.Eisenberg D, Jucker M. The Amyloid State of Proteins in Human Diseases. Cell. 2012;148:1188–1203. doi: 10.1016/j.cell.2012.02.022. [DOI] [PMC free article] [PubMed] [Google Scholar]
- 4.Fowler DM, Koulov AV, Balch WE, Kelly JW. Functional amyloid-from bacteria to humans. Trends Biochem Sci. 2007;32:217–224. doi: 10.1016/j.tibs.2007.03.003. [DOI] [PubMed] [Google Scholar]
- 5.Münch J, Rücker E, Ständker L, Adermann K, Goffinet C, Schindler M, Wildum S, Chinnadurai R, Rajan D, Specht A, Giménez-Gallego G, Sánchez PC, Fowler DM, Koulov A, Kelly JW, Mothes W, Grivel J-C, Margolis L, Keppler OT, Forssmann W-G, Kirchhoff F. Semen-derived amyloid fibrils drastically enhance HIV infection. Cell. 2007;131:1059–1071. doi: 10.1016/j.cell.2007.10.014. [DOI] [PubMed] [Google Scholar]
- 6.Roan NR, Müller Janis A, Liu H, Chu S, Arnold F, Stürzel CM, Walther P, Dong M, Witkowska HE, Kirchhoff F, Münch J, Greene Warner C. Peptides Released by Physiological Cleavage of Semen Coagulum Proteins Form Amyloids that Enhance HIV Infection. Cell Host Microbe. 2011;10:541–550. doi: 10.1016/j.chom.2011.10.010. [DOI] [PMC free article] [PubMed] [Google Scholar]
- 7.Arnold F, Schnell J, Zirafi O, Sturzel C, Meier C, Weil T, Ständker L, Forssmann W-G, Roan NR, Greene WC, Kirchhoff F, Münch J. Naturally Occurring Fragments from Two Distinct Regions of the Prostatic Acid Phosphatase Form Amyloidogenic Enhancers of HIV Infection. J Virol. 2012;86:1244–1249. doi: 10.1128/JVI.06121-11. [DOI] [PMC free article] [PubMed] [Google Scholar]
- 8.Shattock RJ, Moore JP. Inhibiting sexual transmission of HIV-1 infection. Nat Rev Micro. 2003;1:25–34. doi: 10.1038/nrmicro729. [DOI] [PubMed] [Google Scholar]
- 9.Kim K-A, Yolamanova M, Zirafi O, Roan N, Staendker L, Forssmann W-G, Burgener A, Dejucq-Rainsford N, Hahn B, Shaw G, Greene W, Kirchhoff F, Münch J. Semen-mediated enhancement of HIV infection is donor-dependent and correlates with the levels of SEVI. Retrovirology. 2010;7:55. doi: 10.1186/1742-4690-7-55. [DOI] [PMC free article] [PubMed] [Google Scholar]
- 10.Ye Z, French KC, Popova LA, Lednev IK, Lopez MM, Makhatadze GI. Mechanism of Fibril Formation by a 39-Residue Peptide (PAPf39) from Human Prostatic Acidic Phosphatase. Biochemistry. 2009;48:11582–11591. doi: 10.1021/bi901709j. [DOI] [PubMed] [Google Scholar]
- 11.Gasteiger E, Hoogland C, Gattiker A, Duvaud Se, Wilkins MR, Appel RD, Bairoch A, Walker JM. Protein Identification and Analysis Tools on the ExPASy Server. In: Walker JM, editor. The Proteomics Protocols Handbook. Humana Press; Totowa: 2005. pp. 571–607. [Google Scholar]
- 12.Englander SW, Kallenbach NR. Hydrogen exchange and structural dynamics of proteins and nucleic acids. Q Rev Biophys. 1983;16:521–655. doi: 10.1017/s0033583500005217. [DOI] [PubMed] [Google Scholar]
- 13.Englander SW, Poulsen A. Hydrogen-Tritium Exchange of the Random Chain Polypeptide. Biopolymers. 1969;7:379–393. [Google Scholar]
- 14.Molday RS, Englander SW, Kallen RG. Primary Structure Effects on Peptide Group Hydrogen Exchange. Biochemistry. 1972;11:150–158. doi: 10.1021/bi00752a003. [DOI] [PubMed] [Google Scholar]
- 15.Lu X, Wintrode PL, Surewicz WK. Beta-Sheet core of human prion protein amyloid fibrils as determined by hydrogen/deuterium exchange. Proc Natl Acad Sci U S A. 2007;104:1510–1515. doi: 10.1073/pnas.0608447104. [DOI] [PMC free article] [PubMed] [Google Scholar]
- 16.Zhang Z, Smith DL. Determination of amide hydrogen exchange by mass spectrometry: A new tool for protein structure elucidation. Protein Sci. 1993;2:522–531. doi: 10.1002/pro.5560020404. [DOI] [PMC free article] [PubMed] [Google Scholar]
- 17.Chik JK, Vande Graaf JL, Schriemer DC. Quantitating the Statistical Distribution of Deuterium Incorporation To Extend the Utility of H/D Exchange MS Data. Anal Chem. 2005;78:207–214. doi: 10.1021/ac050988l. [DOI] [PubMed] [Google Scholar]
- 18.Damo SM, Phillips AH, Young AL, Li S, Woods VL, Wemmer DE. Probing the Conformation of a Prion Protein Fibril with Hydrogen Exchange. J Biol Chem. 2010;285:32303–32311. doi: 10.1074/jbc.M110.114504. [DOI] [PMC free article] [PubMed] [Google Scholar]
- 19.Thurlkill RL, Grimsley GR, Scholtz JM, Pace CN. pK Values of Ionizable Groups of Proteins. Protein Sci. 2006;15:1214–1218. doi: 10.1110/ps.051840806. [DOI] [PMC free article] [PubMed] [Google Scholar]
- 20.Del Mar C, Greenbaum EA, Mayne L, Englander SW, Woods VL. Structure and properties of α-synuclein and other amyloids determined at the amino acid level. Proc Natl Acad Sci U S A. 2005;102:15477–15482. doi: 10.1073/pnas.0507405102. [DOI] [PMC free article] [PubMed] [Google Scholar]
- 21.Kheterpal I, Wetzel R. Hydrogen/Deuterium Exchange Mass Spectrometry Window into Amyloid Structure. Acc Chem Res. 2006;39:584–593. doi: 10.1021/ar050057w. [DOI] [PubMed] [Google Scholar]
- 22.Sievers SA, Karanicolas J, Chang HW, Zhao A, Jiang L, Zirafi O, Stevens JT, Münch J, Baker D, Eisenberg D. Structure-based design of non-natural amino-acid inhibitors of amyloid fibril formation. Nature. 2011;475:96–100. doi: 10.1038/nature10154. [DOI] [PMC free article] [PubMed] [Google Scholar]
- 23.Kheterpal I, Williams A, Murphy C, Bledsoe B, Wetzel R. Structural Features of the Aβ Amyloid Fibril Elucidated by Limited Proteolysis. Biochemistry. 2001;40:11757–11767. doi: 10.1021/bi010805z. [DOI] [PubMed] [Google Scholar]
- 24.Polverino de Laureto P, Taddei N, Frare E, Capanni C, Costantini S, Zurdo J, Chiti F, Dobson CM, Fontana A. Protein Aggregation and Amyloid Fibril Formation by an SH3 Domain Probed by Limited Proteolysis. J Mol Biol. 2003;334:129–141. doi: 10.1016/j.jmb.2003.09.024. [DOI] [PubMed] [Google Scholar]
- 25.Park C, Marqusee S. Probing the High Energy States in Proteins by Proteolysis. J Mol Biol. 2004;343:1467–1476. doi: 10.1016/j.jmb.2004.08.085. [DOI] [PubMed] [Google Scholar]
- 26.Owen DH, Katz DF. A Review of the Physical and Chemical Properties of Human Semen and the Formulation of a Semen Simulant. J Androl. 2005;26:459–469. doi: 10.2164/jandrol.04104. [DOI] [PubMed] [Google Scholar]
- 27.Tevi-Benissan C, Belec L, Levy M, Schneider-Fauveau V, Si Mohamed A, Hallouin MC, Matta M, Gresenguet G. In vivo semen-associated pH neutralization of cervicovaginal secretions. Clinical and Diagnostic Laboratory Immunology. 1997;4:367–374. doi: 10.1128/cdli.4.3.367-374.1997. [DOI] [PMC free article] [PubMed] [Google Scholar]
- 28.Roan NR, Münch J, Arhel N, Mothes W, Neidleman J, Kobayashi A, Smith-McCune K, Kirchhoff F, Greene WC. The Cationic Properties of SEVI Underlie Its Ability To Enhance Human Immunodeficiency Virus Infection. J Virol. 2009;83:73–80. doi: 10.1128/JVI.01366-08. [DOI] [PMC free article] [PubMed] [Google Scholar]
Associated Data
This section collects any data citations, data availability statements, or supplementary materials included in this article.