

Abstract
The neurotrophin brain-derived neurotrophic factor (BDNF) and its receptor tyrosine kinase TrkB serve important regulatory roles for multiple aspects of the biology of neurons including cell death, survival, growth, differentiation, and plasticity. Regulation of the local availability of BDNF/TrkB at distinct subcellular domains such as soma, dendrites, axons, growth cones, nerve terminals, and spines appears to contribute to their specific functions. In view of the variance in size and shape of neurons and their compartments, previous quantitative studies of the BDNF/TrkB protein and mRNA lacked a robust normalization procedure. To overcome this problem, we have established methods that use immunofluorescence detection of α-tubulin as a normalization factor for the quantitative analysis of protein and mRNA in primary rat cortical and striatal neurons in culture. The efficacy of this approach is demonstrated by studying the dynamic distribution of proteins and mRNA at different growth stages or conditions. Treatment of cultured neurons with KCl resulted in increased levels of TrkB protein, reduced levels of BDNF mRNA (composite of multiple transcripts) and a slight reduction in BDNF protein levels in the dendrites from the cortex. The KCl treatment also lowered the percentage of BDNF and TrkB proteins in the soma indicative of protein transport. Finally, analysis of the rat cortical and striatal neurons demonstrated comparable or even higher levels of BDNF/TrkB protein and BDNF mRNA in the neurons from the striatum. Thus, in contrast to previous observations made in vivo, striatal neurons are capable of synthesizing BDNF mRNA when cultured in growth media in vitro. The analytical approach presented here provides a detailed understanding of BDNF/TrkB levels in response to a variety of neuronal activities. Our methods could be used broadly, including applications in cell and tissue cytometry, to yield accurate quantitative data of gene expression in cellular and subcellular contexts.
Key terms: immunofluorescence, fluorescence in situ hybridization, brain-derived neurotrophic factor, BDNF, TrkB, α-tubulin, cortical neuron, striatal neuron
Brain-derived neurotrophic factor (BDNF) plays an important role in survival, growth, differentiation, and death of neurons (1,2). Local availability of BDNF at distinct subcellular domains such as soma, dendrites, axons, and spines contributes to specific functions of BDNF (3). An important aspect is the ability of neuronal activity to increase BDNF levels locally. In addition to acting as a growth and tropic factor, BDNF has the capacity to activate excitatory synapses and depress inhibitory synapses (4). BDNF exerts its functions in the extracellular space by binding to a high affinity receptor, the tyrosine kinase receptor TrkB (5), and a low affinity receptor, the p75 neurotrophin receptor (P75NTR). Recently, BDNF expression was shown regulated by the targeting of its mRNA to various intracellular locations where local translation machinery synthesizes BDNF protein within restricted subcellular domains (6,7). How BDNF mRNAs are transported in neurons and specifically translated within these diverse regions is an unresolved problem, notwithstanding many studies reported (7–9). Also, continuous up and down changes in the levels of BDNF make it difficult to assess the full impact of this trophic factor.
Because of the wide variance in size and shape of neurons and their compartments as well as varying lengths of processes, most of the reported expression data for mRNA and protein lack a normalization procedure suitable for accurate data analysis and interpretation. The steady-state levels of mRNA and protein in cells and tissues depend on the size of the biological material being examined, necessitating a normalization step to account for the size differences. The normalization procedure is usually carried out by dividing the measured quantity of an analyte by the amount of ubiquitously present material in respective samples. Internal standards, added to the starting material and quantified in parallel to the target analyte, are commonly used for this purpose. Normalization has been widely applied to quantitative analysis of protein/mRNA using a variety of internal standards (10,11). In this study, we have focused on the normalization procedure using an image-based approach involving converting image data sets to quantitative information. This kind of information readout captures the essence of relevant image information and facilitates functional analysis and data comparison.
Morphological properties of the axonal and dendritic arborizations, which vary considerably in size and length, constitute a key aspect of neuronal phenotype and play a determinant role in network connectivity (12). For reliable analysis of protein and mRNA in axons and dendrites, quantitative data should be normalized to starting material or compartment, i.e., the size of axon and dendrite segments analyzed. Although we have previously used GFP transfected into neurons for normalization purpose (13), many quantitative studies of protein and mRNA in neurons lack proper normalization procedure (9; 28).
In this study, we have selected α-tubulin as a normalization factor. α-tubulin is a housekeeping gene that has been used as an internal standard of protein and mRNA in neural cells and tissues by western blotting and RT-PCR (11,14,15). Using our new normalized quantitative analysis approach, we report the dynamic distribution of BDNF/TrkB protein and mRNA in cortical and striatal neurons following days in culture or under commonly used stimulatory conditions to promote alteration of gene expression such as cell depolarization by KCl and treatment by BDNF.
Materials and Methods
Dissection and Culture of Neurons
All rats were maintained under veterinary supervision at New York University School of Medicine Animal Care Facility in accordance with the guidelines established by the NIH for the care of laboratory animals and all procedures approved by the Institutional Animal Care and Use Committee (IACUC) of NYU School of Medicine.
Rat cortical and striatal neurons were isolated and cultured as previously described (16). A total of 30,000 cells were seeded on 12-mm glass coverslips (precleaned with 1 N HNO3 and coated with poly-D-lysine). For depolarization, neurons were incubated for 30 min at 37°C in culture media to which KCl was added (50 mM final). For BDNF stimulation, neurons were incubated for 60 min at 37°C in culture media to which 2 nM BDNF (PeproTech, Rocky Hill, NJ) was added. Neurons were fixed with 4% paraformaldehyde (PFA; Electron Microscopy Sciences) in phosphate-buffered saline (PBS) for 20 min at room temperature.
Western Blotting
A total of 300,000 neurons were seeded on separate 35 mm culture dishes and lysed on days 4, 7, or 10. Cells were lysed with RIPA buffer directly on the plate for 1 h, collected, and clarified by centrifugation at 12,000g. Protein levels were quantified by Bradford assay and 50 μg of soluble protein lysate were loaded in each lane of a 7.5% SDS-polyacrylamide gel for electrophoresis. Proteins were transferred to nitrocellulose membrane, blocked for 1 h in 5% non-fat dry milk in TBST (20 mM Tris-HCl, pH 8, 150 mM NaCl, 0.05% Tween 20, 0.5 mM EDTA) at room temperature, and incubated in diluted mouse anti-α-tubulin antibody (Clone B512, Sigma) or other antibodies in TBST overnight at 4°C. IRDye®800-conjugated goat anti-mouse secondary antibody was used at 1:10,000 dilution. The blot was scanned and analysed by an Odyssey Infrared Imaging System (LI-COR Biosciences). Compared with chemiluminescence/CCD camera detection system, which may be linear over a 250-fold range, infrared detection has a broad linear dynamic range greater than 4,000-fold, eliminating inaccurate quantification due to band saturation.
Preparation of Probes for mRNA Detection
Digoxigenin (DIG)-labeled DNA probes were generated using the DIG-Nick Translation Mix (Roche Applied Science) as described (17). RLTK plasmid (Promega) containing the BDNF long 3′UTR insert (1.0 μg) was used as template DNA. After nick-translation, Illustra ProbeQuant™ G-50 Micro Columns (GE Healthcare) were used for probe purification. Template (1.0 μg) DNA yielded 50 μl probes, and probes of 200–400 nucleotides in length were used for hybridization. RLTK plasmid without an insert was used as a control, which gave no signal.
For TrkB mRNA detection in rat neurons, two oligonucleotide probes were used: 5′-GAGAGGGCTGGCAGAGTCA TCGTCGTTGCTGATGACGGAAGCTGGGCC-3′ (9) and 5′-AGCATCAGCTCGTACACCTCCTGGGGACACGTGCGAGG CCGCTGAAGG-3′. The oligonucleotides were labeled with DIG Oligonucleotide Tailing Kit, 2nd Generation (Roche Applied Science) according to the manufacturer’s instructions. Illustra ProbeQuant G-50 Micro Columns (GE Healthcare Life Sciences) were used for probe purification after labeling. A mixture of the two probes (1:1 ratio) was used for detection of rat TrkB mRNA.
Fluorescence In Situ Hybridization to Detect mRNA
Diethylpyrocarbonate (DEPC)-treated water was used for the preparation of PBS and other reagents. The neurons were fixed with 4% PFA for 18 min at room temperature, treated with 0.25% Triton X-100 in PBS for 10 min, and washed 3 times with PBS. After a 10-minute rinse in 1× sodium chloride/sodium citrate (SSC) buffer, the neurons were incubated for 1 h at 37°C in 100 μl hybridization buffer [25% dextran sulfate, 30 μg/ml single-stranded salmon sperm DNA (Sigma), 30 μg/ml yeast tRNA (Sigma), 0.4% IgG-free bovine serum albumin (BSA; Jackson ImmunoResearch Laboratories), 20 mM ribonucleoside vanadyl complex (Sigma), 0.01 M sodium phosphate buffer (pH 7.0), 2× SSC]. The neurons were hybridized for 6 h at 37°C with probe diluted in 100 μl hybridization buffer. Nick-translated DIG-labeled probe (1 μl) was used for the detection of BDNF mRNA in neurons grown on 12-mm cover slips in 24-well plates. Twenty nanograms of fluorescein isothiocyanate (FITC)-labeled 24-mer oligo dT probe (custom synthesis from Life Technologies, Grand Island, NY) was employed for the detection of total mRNA. After hybridization, neurons were washed with 40% formamide/1× SSC for 30 min at 37°C with gentle shaking, followed by 3 × 15 minute washes with 1× SSC with gentle shaking on an orbital shaker.
Detection of DIG-Labeled Probes and Immunofluorescence Staining
All dilutions and thorough washes (3 × 10 min) were performed in PBS unless otherwise stated. Cover slips were washed for 10 min with PBS, blocked with 5% goat serum (Sigma) for 30 min, and incubated for 1 h at room temperature with primary antibodies (in a solution containing 5% goat serum). They were then incubated for 30 min at room temperature with secondary antibodies. FITC-conjugated oligo dT was detected with Alexa 488-conjugated goat anti-FITC (BD Pharmingen). DIG-labeled probes were detected by incubating neurons with chicken anti-DIG (Immunology Consultants Laboratory), followed by DyLight 549-conjugated goat anti-chicken IgY (IgG) (Jackson ImmunoResearch Laboratories, West Grove, PA). α-Tubulin was detected by incubating sections with mouse anti-α-tubulin (1:10,000), followed by Alexa 488-conjugated goat anti-mouse IgG (BD Pharmingen) or Cy3-conjugated goat anti-mouse IgG (Jackson ImmunoRe-search Laboratories). BDNF, TrkB, and phospho-TrkB were detected by incubating sections with rabbit anti-BDNF (Millipore, AB1534SP), rabbit anti-TrkB (Millipore, 07-225), or rabbit anti-pTrkBY816 (18), followed by DyLight 649-conjugated goat anti-rabbit IgG (Jackson ImmunoResearch Laboratories).
Confocal Microscopy
Confocal imaging was performed using an LSM META510 confocal scanning laser system on an Axiovert 200 M microscope (Carl Zeiss). The instrument settings are detailed in Table 1. Images were acquired with a Plan-Apochromat 100×/1.3 oil-immersion objective lens using the same setting for each experiment. Each frame size was 2,048 × 2,048 pixels (scan speed, 6; scan number, 8). During acquisition of the image, axons were distinguished from dendrites under the microscope by several well-established features (19), including shape (dendrites often taper while axons usually maintain a constant radius; axons have smooth surface while dendrites have rough surface), length (dendrites are restricted to a small region around the cell body while axons can be much longer), and branch point (axons branch far from cell body while dendrites branch near from cell body). As the majority of neurons in our cortical and striatal culture preparation possessed only one clearly discernable axon and one or more dendrites, neurons with nonpyramidal morphological features (such as multiple axons or no distinguishable processes) were excluded from the analysis.
Table 1.
Parameters and settings used for confocal microscopy
| FLUORESCENT DYE | LASER | EXCITATION WAVELENGTH (NM) | EMISSION FILTER (NM) | DETECTOR |
|---|---|---|---|---|
| Alexa 488 | Argon (max. 12%) | 488 | BP 505–530 | Normal |
| Dylight 549, Cy3 | HeNe1 (max. 29%) | 543 | BP 560–615 | Normal |
| Dylight 649 | HeNe2 (max. 44%) | 633 | 659–723 | META |
Image Analysis
ImageJ 1.42o (http://rsb.info.nih.gov/ij) was obtained from the National Institutes of Health. For each experiment, images were processed and analyzed using the same procedure. In the LSM program, 0–30 μm and/or 30–60 μm segments from proximal axons or dendrites were traced and exported to ImageJ after adjustment of contrast and brightness. Each axon/dendrite was selected from one neuron. 0–30 μm represents a 30-μm segment of axon or dendrite from the soma, while 30–60 μm represents a segment from point A (30 μm from the soma) to point B (60 μm from the soma).
Intensity-based analysis
Intensity-based analysis method was used to study BDNF/TrkB protein and total mRNA levels in cortical neurons. Intensity of an image (protein or mRNA) was analyzed by the “Measure” function in the “Analyze” menu. The image of α-tubulin was changed to 8-bit grayscale and thresholded by the “Threshold” function in the submenu “Adjust.” The threshold of the image was determined by measuring background intensity of the image. Area of α-tubulin was then analyzed by the “Measure” function in the “Analyze” menu. For normalization, the intensity of protein and mRNA was divided by area of α-tubulin (in pixels) to generate the final results.
Number-based analysis
Number-based analysis method was used to study BDNF/TrkB mRNA in cortical neurons. The number of BDNF or TrkB mRNA-containing granules was counted after zooming in on the images. For normalization, the number of mRNA granules was divided by area of α-tubulin (in pixels) to generate the final results.
Single-cell analysis
Because the confocal microscope used in our study did not have a motorized stage, which enables automatic acquisition and stitching of images, we manually stitched images acquired from different parts of a neuron (with >10% overlap to permit orientation of neighboring images) by Paint Shop Pro 9 as described (20). Up to four images were acquired to obtain an image of a single neuron. The new composite image was imported back to the LSM program. Only the image portion containing the target neuron was selected and extracted to generate a new image for a single neuron. The brightness and contrast of the newly cropped images were adjusted and images in each channel were exported to Paint Shop Pro 9 to generate new images for further analysis performed in ImageJ. For normalization, intensities of the protein and mRNA were divided by area of α-tubulin to generate the final results.
Statistical Analysis
Data are expressed as mean ± SD. The protein and mRNA levels were compared using an unpaired Student’s t-test (one-tailed).
Results
α-Tubulin is Expressed at a Constant Level in Cultured Cortical Neurons
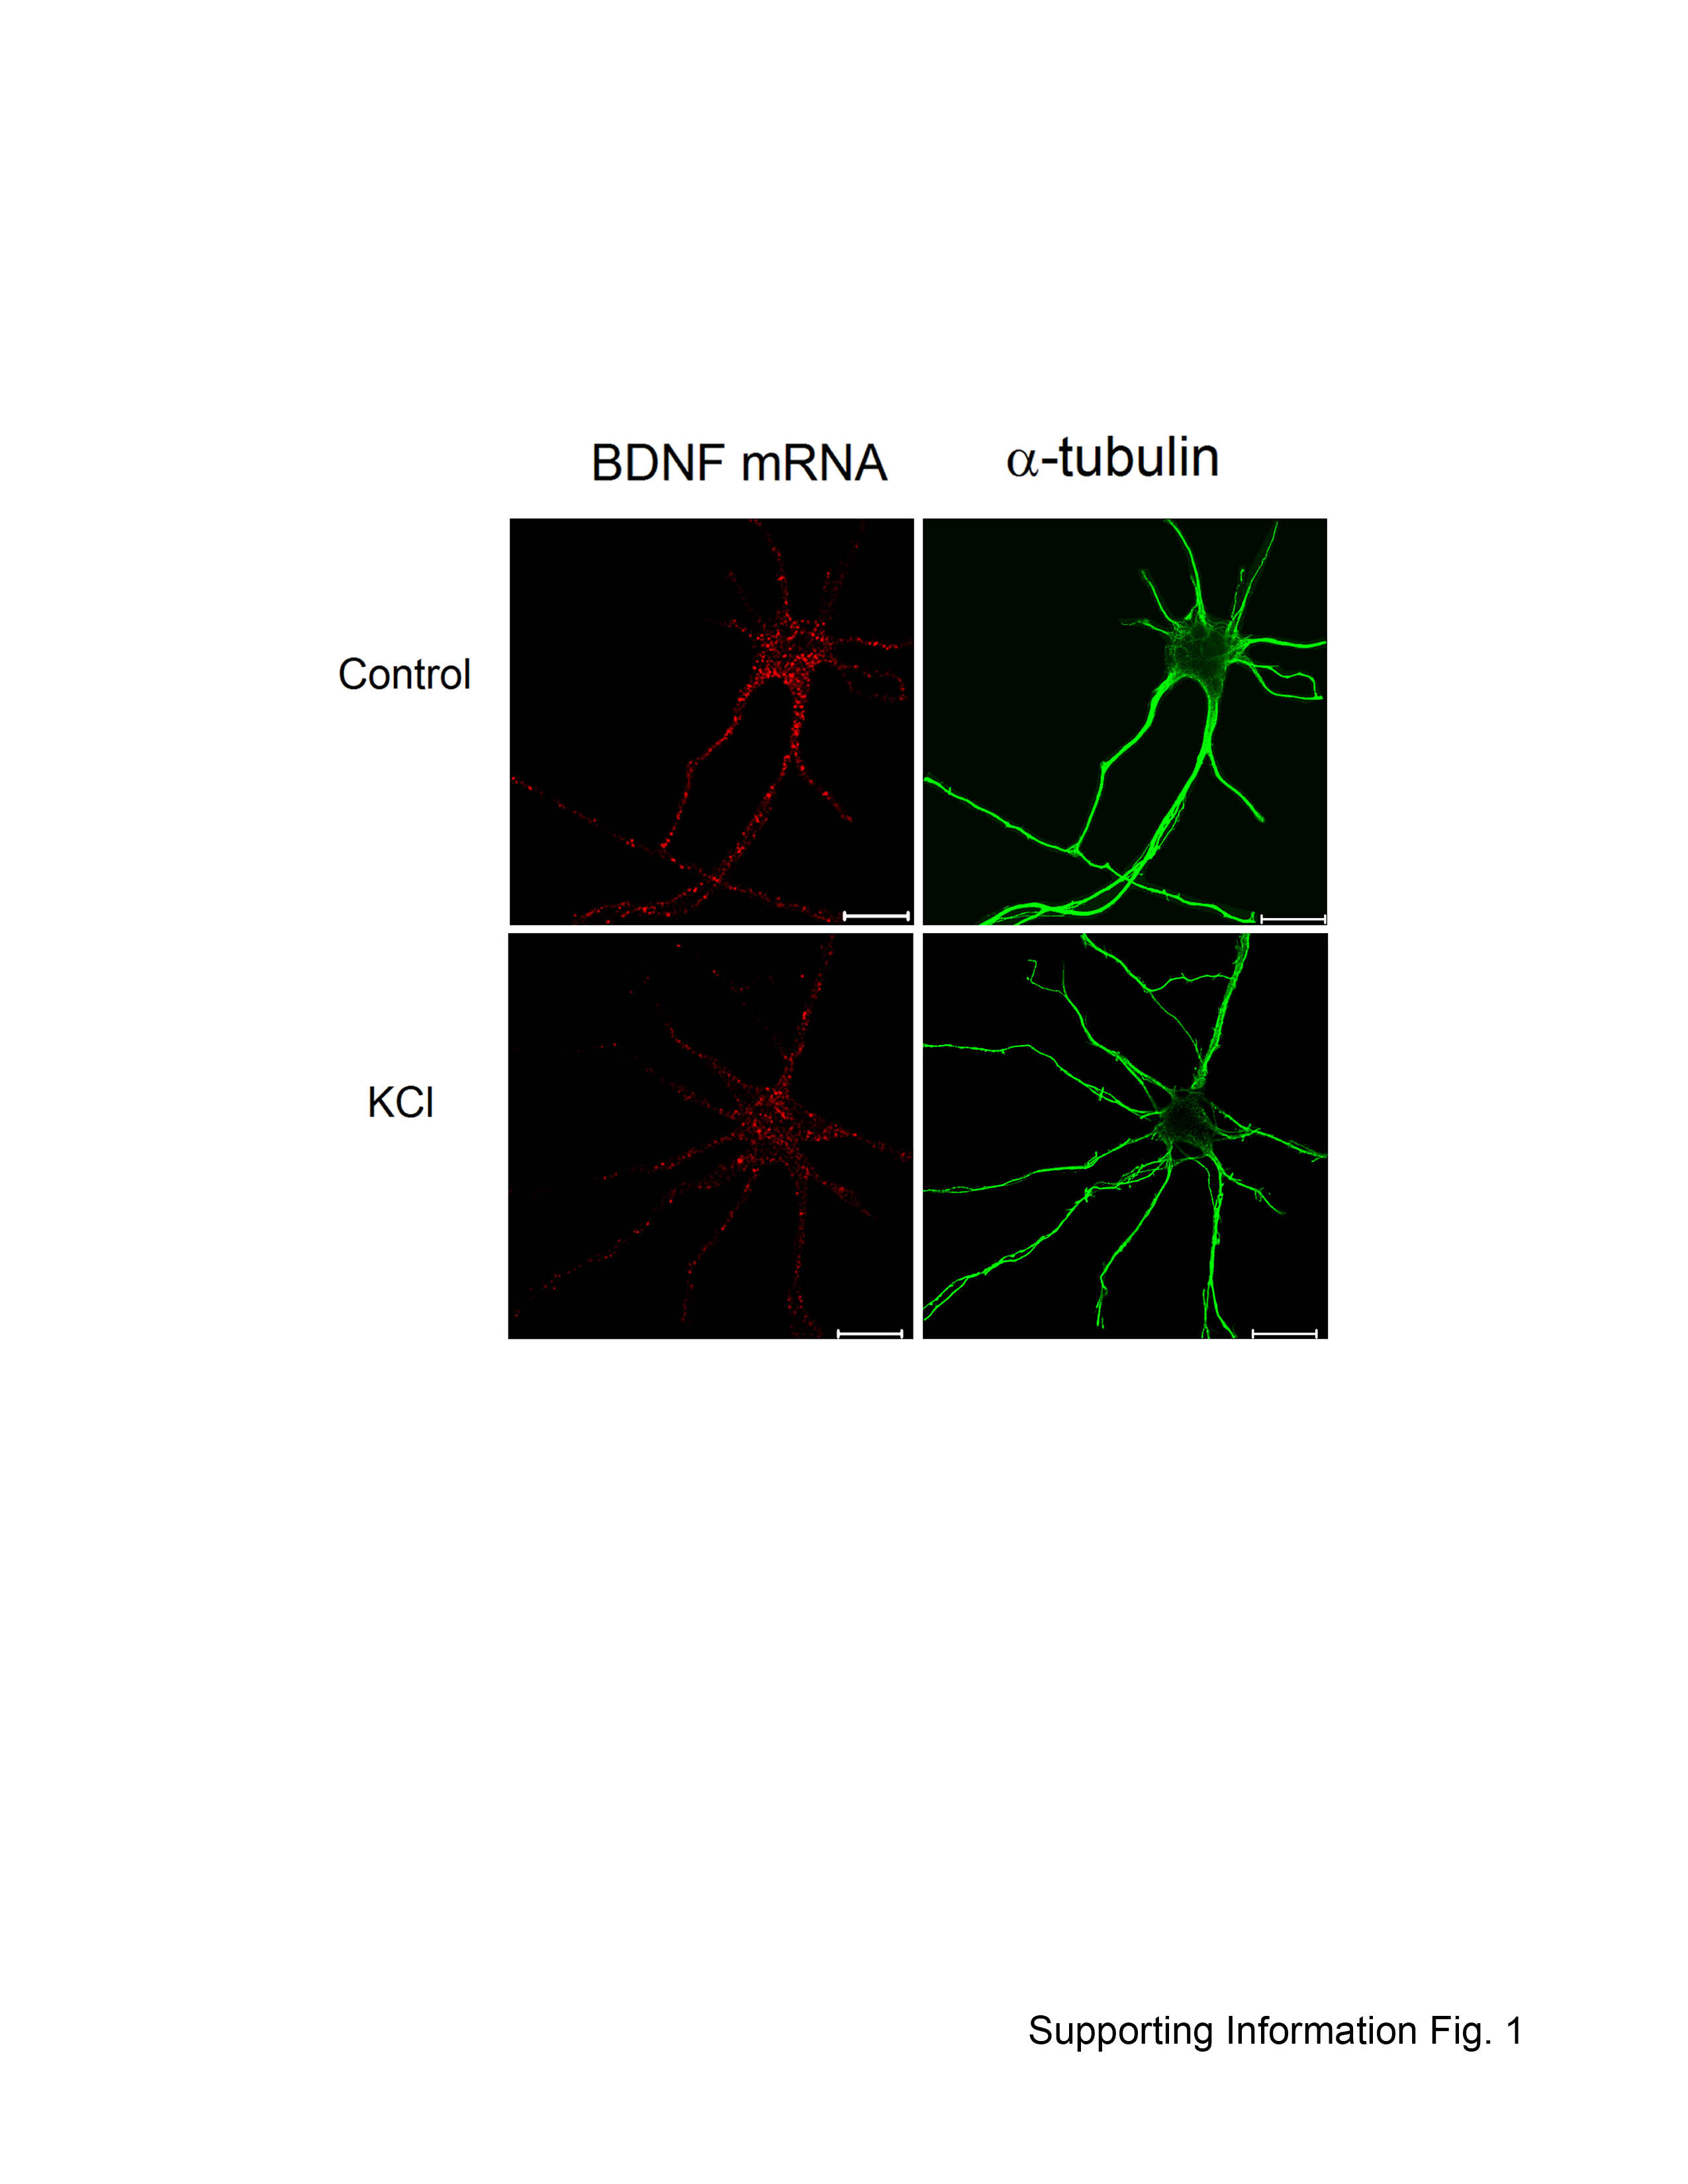
A prerequisite for a meaningful utilization of α-tubulin as a normalization factor is its relatively constant expression at different growth stages or under different experimental conditions. To demonstrate this, the expression level of α-tubulin in cortical neurons at various days in vitro (DIV4, DIV7 and DIV10) was determined by quantitative Western blotting (Figs. 1A and 1B). The total α-tubulin protein level remained constant in cultured neurons. The expression level of α-tubulin in DIV7 cortical neurons before and after depolarization of neurons with KCl was also analyzed by immunostaining (Supporting Information Fig. 1, right panels). No obvious changes (quantitative or qualitative) were detected.
Figure 1.

α-Tubulin protein levels in cortical neurons at indicated days in vitro (DIV). A: Western blot analysis of α-tubulin in neuronal cell extracts from DIV4, DIV7 and DIV10. B: Quantitative analysis of α-tubulin expression levels by measurement of the optical density of blots using the LI-COR software (Intensity index in arbitrary units). The histograms represent mean density of two tests for each sample. Error bars show standard deviations.
Use of α-Tubulin as a Normalization Factor in the Quantitative Analysis of BDNF and TrkB Protein Expression
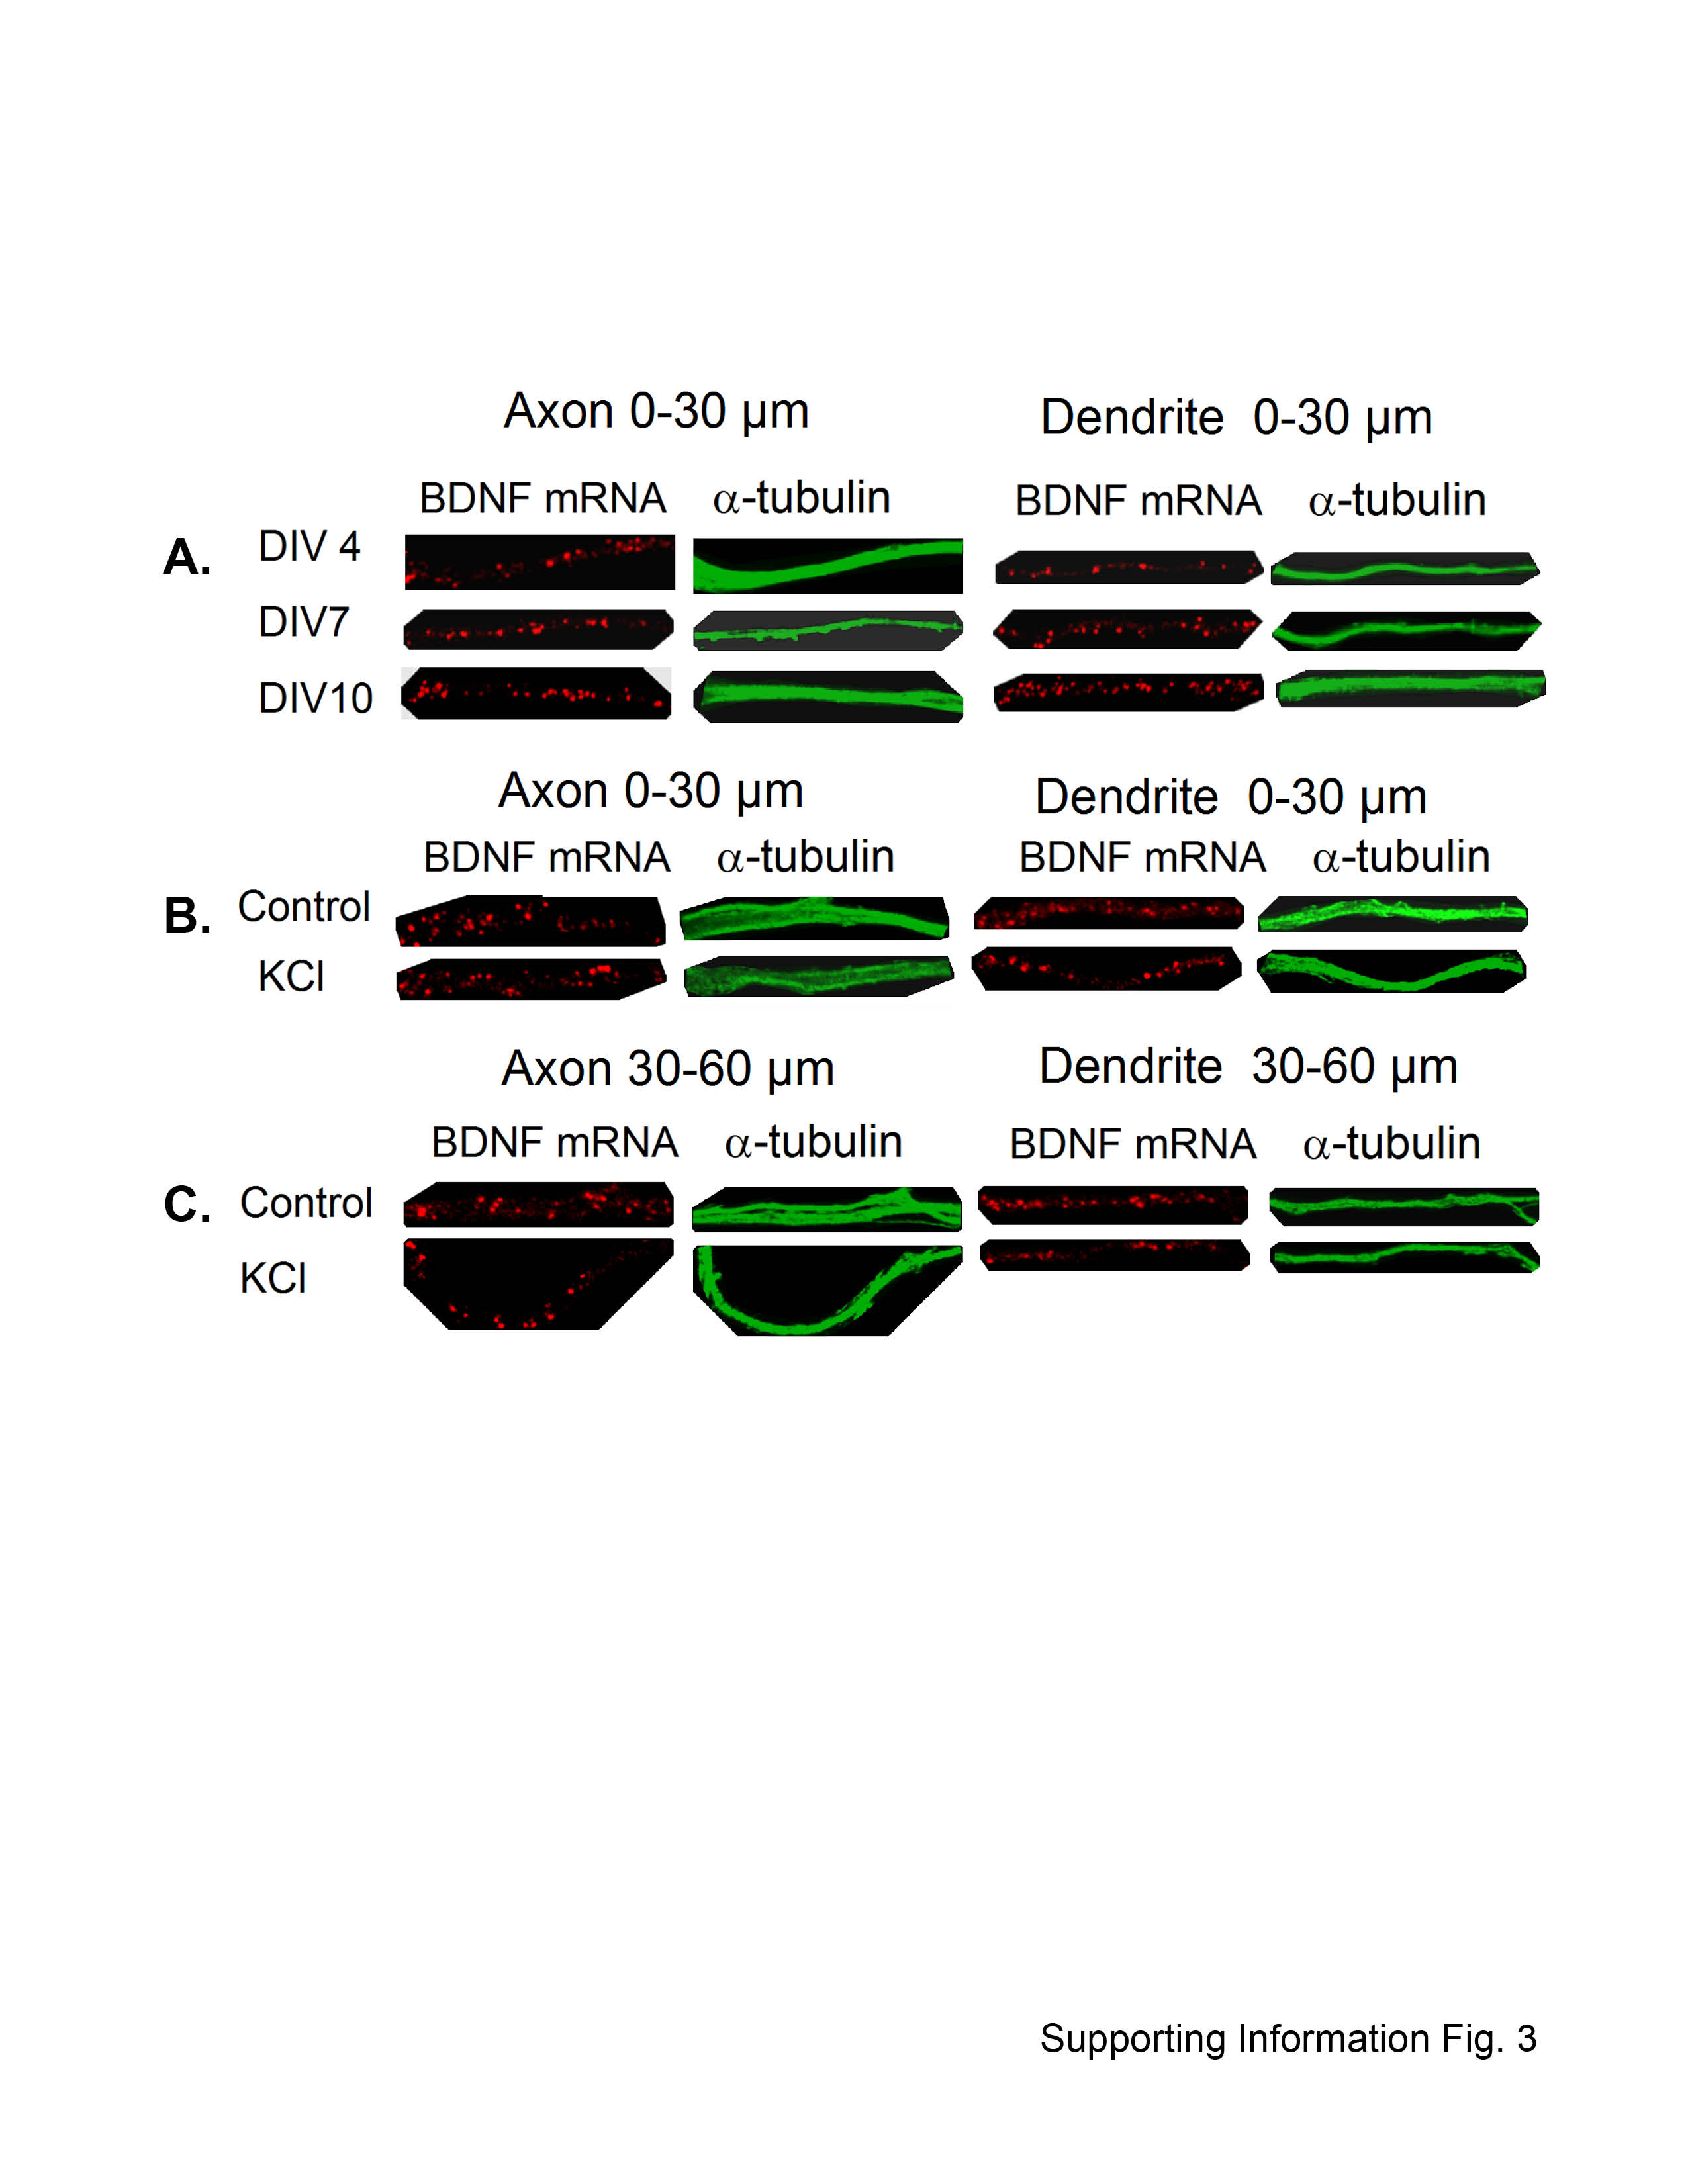
BDNF and TrkB are present not only in dendrites and soma but also in axons, growth cones, and spines. We investigated the subcellular localization of BDNF/TrkB using immunocytochemistry and confocal microscopy in dissociated cultures of cortical neurons before (DIV4), during (DIV7), and after the peak of synapse formation (DIV10) (21,22). Several 0–30 μm segments from the proximal region of axons or dendrites at various DIV were selected and the expression levels of BDNF and TrkB protein quantified by analyzing the optical intensity of the immunofluorescent staining of the two proteins (Figs. 2A and 2B). Representative confocal images of BDNF and TrkB protein expression in cortical neurons are shown in Supporting Information Figures 2A and 2B. To normalize for the expression, image intensity (I) of protein was divided by area (A) of the α-tubulin signal (in pixels; see Image analysis under Methods). The axonal expression levels of BDNF did not change significantly between neurons at DIV4 and DIV7 (P = 0.46), whereas the levels of BDNF in DIV10 neurons increased by 37.3% compared with DIV4 (P = 0.050), and 38.2% compared with DIV7 (P = 0.043). Dendritic BDNF levels did not change significantly between DIV4 and DIV7 (P = 0.45), DIV7 and DIV10 (P = 0.096), and DIV4 and DIV10 (P = 0.085). For the detection of TrkB, we used an antibody previously used in a quantitative study (21). The TrkB levels in axons did not change significantly between DIV4 and DIV7 (P = 0.075), DIV7 and DIV10 (P = 0.39), and DIV4 and DIV10 (P = 0.099). The dendritic levels of TrkB also did not change significantly between DIV4 and DIV7 (P = 0.47), DIV7 and DIV10 (P = 0.053), and DIV4 and DIV10 (P = 0.087). To investigate potential effects of depolarization on the localization of BDNF and TrkB in cortical neurons, cultures were depolarized with 50 mM KCl and the expression levels of BDNF and TrkB within 0–30 μm and 30–60 μm segments from the proximal region before and after depolarization with 50 mM KCl were analyzed. Representative confocal images of BDNF and TrkB protein expression in cortical neurons before and after depolarization are shown in Supporting Information Figures 2C and 2D. The levels of BDNF in 0–30 μm segments of both axons and dendrites did not change significantly after depolarization (Fig. 2C; P = 0.21 for axons, P = 0.40 for dendrites). Similar results were obtained for 30–60 μm segments of both axons and dendrites (Fig. 2D; P = 0.35 for axons, P = 0.15 for dendrites). The levels of TrkB protein in the 0–30 μm segment of axons also did not change significantly after depolarization (Fig. 2E; P = 0.40); however, the levels of TrkB in 0–30 μm segment of dendrites increased significantly (P = 0.045). For 30–60 μm segments of both axons and dendrites, the levels of TrkB did not change significantly after depolarization (Fig. 2F; P = 0.15 for axons, P = 0.16 for dendrites).
Figure 2.

Quantitative analysis of BDNF and TrkB protein expression in cortical neurons. Axons and dendrites are shown in gray and dark gray bars, respectively. Y-axis: I, intensity; A, area. Student’s t test: *P<0.05. See text for actual P-values. Error bars show standard deviations. Expression levels of (A) BDNF and (B) TrkB in cortical neurons (0—30 μm segments) from different stages (DIV4, DIV7, DIV10) are shown; n = 4. Expression levels of (C, D) BDNF, and (E, F) TrkB in DIV7 neurons before and after 30—min depolarization with 50 mM KCl. Analysis was performed on (C, E) 0—30 μm, and (D, F) 30—60 μm segments of axons and dendrites; n = 5.
Quantitative Analysis of mRNA Distribution in Neurons Using α-Tubulin as a Normalization Factor
We next analyzed the distribution of BDNF mRNA in neurons at different DIVs. BDNF mRNA was found present in puncta in the axon and dendrites during development. The puncta, regarded as mRNA granules, may contain up to 30 mRNA molecules and other proteins (23). Therefore, we first used a number (N)-based analysis (see Image analysis under Methods) to investigate the dynamic targeting of BDNF mRNA in 0–30 μm segment of cortical neurons at DIV4, DIV7, and DIV10 (Fig. 3A). Representative confocal images of BDNF mRNA in cortical neurons from different DIV are shown in Supporting Information Figure 3A.
Figure 3.

Quantitative analysis of BDNF mRNA and total mRNA in cortical neurons. Y-axis: N, number; I, intensity; A, area. Axons and dendrites are shown in gray and dark gray bars, respectively. Student’s t test: *P < 0.05; **P < 0.01. See text for actual P-values. Error bars show standard deviations. A: Levels of BDNF mRNA granules (number-based analysis) in cortical neurons (0—30 μm segments) at different stages in culture (DIV4, DIV7, DIV10); n = 4. B, C: Levels of BDNF mRNA (number-based analysis) in axons and dendrites of DIV8 cortical neurons before and after depolarization with 50 mM KCl. Analyses were performed on (B) 0—30 μm, and (C) 30—60 μm segments. (B) n = 5; (C) n = 5 for axon; n = 4 for dendrite. D, E: Levels of total mRNA (intensity-based analysis) in DIV7 cortical neurons before and after depolarization with 50 mM KCl. Analysis was performed on (D) 0—30 μm, and (E) 30—60 μm segments; n = 9 for axon; n = 10 for dendrite.
The axonal levels of BDNF mRNA in DIV7 neurons increased significantly compared with DIV4 neurons (P = 0.014), whereas no significant difference was observed with DIV10 neurons (P = 0.21). The dendritic levels of BDNF mRNA in DIV7 neurons increased significantly compared with DIV4 neurons (P = 0.029), and DIV10 neurons showed further increase in the level of BDNF mRNA compared with DIV7 neurons (P = 0.021).
The same number (N)-based analysis was also applied to investigate the levels of BDNF mRNA in the DIV8 neurons before and after depolarization with 50 mM KCl. Representative confocal images of BDNF mRNA in cortical neurons before and after depolarization are shown in Supporting Information Figures 1, 3B, and 3C. The BDNF mRNA granules in the axonal segment within 0–30 μm (P = 0.10) and 30–60 μm (P = 0.31) did not change significantly after treatment with KCl (Figs. 3B and 3C). However, BDNF mRNA granules in the dendritic segment within 0–30 μm (P = 0.010) and 30–60 μm (P = 0.046) were found reduced significantly after treatment with KCl, demonstrating differential targeting of BDNF mRNA in axons and dendrites in response to an extracellular stimulus (Figs. 3B and 3C).
Intensity (I)-based quantification was used to study the change of total mRNA in the DIV7 neurons after depolarization with 50 mM KCl. Several 0–30 μm and 30–60 μm segments of axons and dendrites were selected for the analysis. For 0–30 μm segments, the total mRNA of axons decreased significantly after depolarization (P = 0.040), whereas the total dendritic mRNA levels did not change significantly on depolarization (P = 0.16) (Fig. 3D). For 30–60 μm segments of axons and dendrites, the total mRNA levels did not change significantly on depolarization (Fig. 3E; P = 0.065 for axons, P = 0.48 for dendrites).
Using α-Tubulin as a Normalization Factor in Single-Cell Quantitative Analysis of Protein and mRNA
We next performed quantitative expression analysis in single cells (whole neurons) using optical intensities of α-tubulin as a normalization factor. To demonstrate the application of this method, two neurons were selected and the levels of BDNF protein before and after depolarization were determined (Fig. 4A). Optical intensities (I) of BDNF protein were found reduced after depolarization (+KCl) compared with before depolarization. Furthermore, the percentage of BDNF protein in the soma decreased after depolarization (Fig. 4A, right bar graph), possibly reflecting changes in the localization of BDNF from the soma to the axon and dendrites. Optical intensities of TrkB protein before and after depolarization were also studied (Fig. 4B). No significant differences in TrkB protein levels were detected, while the intensity of TrkB in the soma was also reduced after depolarization (Fig. 4B, right bar graph), consistent with the notion that TrkB protein was transported from the soma to the axon and dendrites. These experiments demonstrate the feasibility of quantifying changes in BDNF and TrkB levels after KCl treatment and redistribution of BDNF and TrkB in single cells following depolarization, which cannot be measured by western blotting. We also used this approach to analyze total mRNA under depolarizing conditions (Fig. 4C). Both total mRNA and mRNA in the soma increased after depolarization, likely reflecting synthesis of new mRNA in neurons.
Figure 4.

Quantitative analysis of protein and mRNA in a single cell from DIV5 cortical neurons before and after depolarization. A: Levels of BDNF expression before and after depolarization with 50 mM KCl. Enrichment of BDNF can be seen in the distal parts of the neuron after depolarization. B: Levels of TrkB expression before and after depolarization with 50 mM KCl. C: Levels of total mRNA before and after depolarization with 50 mM KCl. Scale bar, 10 μm. The brightness and contrast of (A) and (C) were adjusted for better visualization. The statistical analysis for each experiment is shown in the right panel, which include quantitative data for total protein/mRNA normalized to α-tubulin, and percentage of protein/mRNA present in soma, before and after KCl treatment. Y-axis: I, intensity.
Quantitative Analysis of TrkB Distribution in Cortical Neurons After BDNF Stimulation
BDNF binds to TrkB on the cell surface, which initiates signalling cascades and multiple biological responses in neurons. We analyzed the dynamic distribution of BDNF and TrkB protein and TrkB mRNA in response to BDNF. Cortical neurons (DIV8) were treated for 1 h with 2 nM BDNF and analyzed as before. The levels of BDNF in cortical neurons before and after treatment did not change significantly within 0–30 μm (Fig. 5A; P = 0.15 for axons, P = 0.37 for dendrites). Similarly, the BDNF levels did not change significantly before and after BDNF treatment within 30–60 μm (Fig. 5B; P = 0.18 for axons, P = 0.49 for dendrites). By contrast, the levels of TrkB protein decreased significantly after BDNF treatment (Fig. 5C; 0–30 μm, P = 0.0074 for axons, P = 0.011 for dendrites). The changes were less significant within 30–60 μm (Fig. 5D; P = 0.064 for axons, P = 0.099 for dendrites).
Figure 5.

Quantitative analysis of BDNF, TrkB, phospho-TrkB protein, and TrkB mRNA in cortical neurons (DIV8) after BDNF treatment. Axons and dendrites are shown in gray and dark gray bars, respectively. Y-axis: I, intensity; A, Area; N, number. Student’s t test: *P < 0.05, **P < 0.01. See text for actual P-values. Error bars show standard deviations. A, B: Levels of BDNF expression in cortical neurons were detected before and after treatment with 2 nM BDNF for 1 h. Analysis performed on 0—30 μm and 30—60 μm segments is shown in (A) and (B), respectively; n = 5. C, D: Levels of TrkB in cortical neurons were detected before and after treatment with 2 nM BDNF for 1 h. Analysis performed on 0—30 μm and 30—60 μm segments is shown in (C) and (D), respectively; n = 5. E, F: Levels of phospho-TrkB in cortical neurons detected before and after treatment with 2 nM BDNF for 1 h. Analysis performed on 0—30 μm and 30—60 μm segments is shown in (E) and (F), respectively; n = 5. G, H: Levels of TrkB mRNA in cortical neurons detected before and after treatment with 2 nM BDNF for 1 h. Number-based analysis performed on 0—30 μm and 30—60 μm segments is shown in (G) and (H), respectively; n = 6.
Binding of BDNF triggers phosphorylation of TrkB. To examine this modification on TrkB upon BDNF stimulation, the levels of phosphorylated-TrkB (phospho-TrkB) in cortical neurons before and after treatment were determined with a p-TrkB antibody. Within the 0–30 μm segment of axons, the levels of p-TrkB increased significantly after BDNF treatment (Fig. 5E; P = 0.021) but not within the 0–30 μm segment of dendrites (P = 0.37). For the 30–60 μm segments of both axons and dendrites, the levels of p-TrkB did not change significantly after BDNF treatment (Fig. 5F; P = 0.48 for axons, P = 0.32 for dendrites).
To examine if the TrkB mRNA levels are regulated by BDNF, we performed a quantitative analysis to detect TrkB mRNA. The levels of TrkB mRNA did not change significantly before and after BDNF treatment in all segments tested (Fig. 5G: 0–30 μm, P = 0.49 for axons, P = 0.12 for dendrites; Fig. 5H: 30–60 μm, P = 0.29 for axons, P = 0.15 for dendrites). Taken together, we found BDNF treatment to reduce TrkB protein without affecting the levels of mRNA or p-TrkB.
Comparative Analysis of BDNF and TrkB Expression in Cortical and Striatal Neurons
The BDNF mRNA levels are reported to be low in adult mouse striatum (24), and most studies suggest that striatal BDNF is delivered through anterograde transport by cortical afferents (25,26). To determine quantitatively relative expression levels of BDNF/TrkB mRNA and protein in primary cortical and striatal neurons in culture, we performed fluorescence in situ hybridization (FISH) and IF in these neurons (DIV8) derived from the same brain (Fig. 6). BDNF levels in 0–30 μm and 30–60 μm segments of axons did not differ significantly between cortical and striatal neurons (Fig. 6A: 0–30 μm, P = 0.26; 30–60 μm, P = 0.45). However, the levels of BDNF in 0–30 μm and 30–60 μm segments were significantly higher in dendrites from the striatum than the cortex (Fig. 6B: 0–30 μm, P = 0.0066; 30–60 μm, P = 0.027).
Figure 6.

Comparative analyses of BDNF, BDNF mRNA and TrkB in DIV 8 cortical neurons and striatal neurons. I: Intensity; N: Number; A: Area. Student’s t test: *P < 0.05; **P < 0.01. See text for actual P-values. Error bars show standard deviations. A, B: Levels of BDNF protein in cortical and striatal neurons. Analysis of axons and dendrites is shown in (A) and (B), respectively; n = 5. C, D: Levels of BDNF mRNA in cortical and striatal neurons. Analysis of axons and dendrites is shown in (C) and (D), respectively; n = 5. E, F: Levels of TrkB protein in cortical and striatal neurons. Analysis of axons and dendrites is shown in (E) and (F), respectively; n = 5.
When BDNF mRNA levels were compared between cortical and striatal neurons, they were present at comparable levels in axons and dendrites, indicating that striatal neurons can synthesize BDNF mRNA under in vitro culture conditions despite reported low levels detected in the mouse brain. No significant difference was found between BDNF mRNA levels in axons from the cortex and the striatum (Fig. 6C: 0–30 μm, P = 0.14; 30–60 μm, P = 0.25). Similar results were obtained for the dendrites (Fig. 6D: 0–30 μm, P = 0.24; 30–60 μm, P = 0.35).
TrkB expression was also analyzed: its levels in 0–30 μm and 30–60 μm segments of axons from the striatum were significantly higher than those from the cortex (Fig. 6E: 0–30 μm, P = 0.013; 30–60 μm, P = 0.041). The TrkB levels were higher in the dendrites from the striatum compared with the cortex especially in the 30–60 μm segments (Fig. 6F, 0–30 μm, P = 0.064; 30–60 μm, P = 0.039). Taken together, we detected higher levels of BDNF and TrkB protein in neurons from the striatum. Furthermore, we observed comparable levels of BDNF mRNA in striatal and cortical neurons indicating that unlike the neurons studied in vivo, striatal neurons grown in culture synthesize BDNF mRNA.
Discussion
A New Method to Quantitatively Analyze Protein and mRNA in Neurons
We have developed a combined approach of fluorescent labeling and image analysis for the quantitative analysis of mRNA and protein in cultured neurons. The new approach offers an accurate and reliable method for the relative or absolute (in the form of granules or puncta) quantitative measurement of protein and mRNA. Comparisons of our method with conventional methods, RT-PCR for mRNA and Western blotting for proteins are summarized in Tables 2 and 3, respectively.
Table 2.
Comparison of RT-PCR with the combined method of FISH and fluorescence densitometry
| RT-PCR | FISH + FLUORESCENCE DENSITOMETRY | |
|---|---|---|
| Relative and absolute quantification | Possible | Possible (e.g., number of puncta) |
| Sample size | Not critical | Sections or cells |
| Detection limit | One copy (theoretical) | A few copies may be detected but depends on detection procedure. |
| Sensitivity | Most sensitive method available | Very sensitive |
| Optimization needed | High. Control mRNA or rRNA for normalization. | High. Use protein for normalization. |
| Detection of multiple transcripts | Yes, in same tube. | Yes, multiple transcripts in same cells can be viewed. |
| Localization of mRNA in different cell populations | No | Yes |
| Subcellular localization of mRNA in cells/tissues | No | Yes, subcellular quantification is possible. |
| Colocalization with proteins | No | Yes |
| Size of mRNA | Cannot be determined. | Cannot be determined, but size of mRNA granule can be viewed. |
| Tolerate partially degraded mRNA | Yes | Yes |
Table 3.
Comparison of western blotting with the combined method of IF and fluorescence densitometry
| WESTERN BLOTTING | IF + FLUORESCENCE DENSITOMETRY | |
|---|---|---|
| Detection method | Antigen–antibody reaction | Antigen–antibody reaction |
| Relative or absolute quantification | Possible | Possible (e.g., number of puncta) |
| Size of protein | Can be determined | Cannot be determined |
| Sample size | 10 μg total protein. May limit detection of protein at very low concentration. | Sections or cells |
| Sensitivity | Very sensitive (enzyme-conjugated detection), but membrane transfer may limit detection. | Very sensitive |
| Optimizations needed | High | High |
| Detection of multiple proteins | Yes, in same gel | Yes |
| Localization of protein in cells/tissues | No | Yes |
| Subcellular localization of protein | No | Yes, subcellular quantification is possible. |
| Colocalization with other proteins or mRNA | Not possible | Possible |
| Tolerate partially degraded protein | Possible | Yes |
| Time consumption | Work intensive | Less work intensive |
Because normalization is critical for data analysis and interpretation, we have used α-tubulin as an internal normalization factor in two ways. The first is size-based normalization (27,28) in which the results are normalized to the size of the neuron or neuronal compartments of the axon and dendrites. This normalization factor is obtained by measuring the α-tubulin-staining area, which reflects different size (scale) of axons or dendrites analyzed. The second method is α-tubulin intensity-based normalization, which we have used in the whole-cell analysis of mRNA and protein in neurons. In this case, the intensity of α-tubulin staining represents the biomass of a single neuron.
For quantitative analysis of protein and mRNA, both intensity (relative quantification) and number (absolute quantification) may be used for analysis. A comparison of the two methods is summarized in Table 4. Both intensity-based (28) and number-based methods were used in the current study of mRNA quantification in neurons, whereas the intensity-based method was used to quantify BDNF and TrkB protein levels. Number-based methods can also be used for these studies (21,29). In this case, the number may represent number of granules, puncta, or vesicles. For example, one mRNA granule may contain (up to) 30 mRNA molecules (23). Although the two methods have different algorithms, they are related and can be combined. Total intensity can be obtained by multiplying the number and mean intensity of individual events. This kind of combination is also useful when some events overlap or are clustered, and the outcome needs to be estimated by dividing the total intensity by the number.
Table 4.
Comparison of intensity-based analysis with number-based analysis
| INTENSITY-BASED ANALYSIS | NUMBER-BASED ANALYSIS | |
|---|---|---|
| Quantification | Normally relative but reflects total amount. | Absolute but only for the number of puncta or granules. |
| Automation | Yes, after background subtraction. | Yes, particle analysis can be used. |
| Whole-cell analysis | Yes | Yes |
| Normalization factor | Protein | Protein |
| Dependency on background | Background subtraction is needed. | Not critical; background is used for determination of signal from noise. |
| Signal/noise ratio | Important for analysis | OK if granule can be distinguished. |
| Standardization of staining and FISH | Same procedure and parameters should be used. | Same procedure and parameters should be used. |
| Image acquisition | Same procedure and parameters should be used. | Variations allowed. |
| Image analysis | Same procedure and parameters should be used. | Variations allowed. |
To improve the accuracy of the analysis, background should ideally be subtracted from images (29). For example, in the intensity-based method, background should be subtracted to obtain accurate signal information reflecting the true level of the protein or mRNA. For number-based methods, background can be kept in the image if staining of puncta can be distinguished from noise and non-specific background. However, in some circumstances, background must be removed to facilitate automatic analysis. In this study, the background signal (for protein and mRNA analyzed) or thresholding (for α-tubulin) was determined by measuring background intensity. This is then followed by a thresholding to remove the background. These types of background subtractions can be performed in ways similar to those reported previously (21,29).
Another factor important for obtaining reliable results is the selection of adequate sample size. As neurites can be highly heterogeneous depending on age, density, and health of the neurons imaged, selection of a subset of neurites for analysis must take into account such variations and use a defined set of characteristics. A chosen protein marker used to identify a certain neuron type would make quantitative analysis highly accurate. Because the degree of heterogeneity among neurites of different neurons defines the tightness of the standard deviation and therein the differences in a data set, the number of neurites per cell, average segment length, and the number of cells analyzed to represent the population must be optimized according to the degree of variation inherent in the neuronal culture. Analysis performed on large data sets will be time consuming. In this case, automatic or batch-based image processing/analysis approaches may be applied to reduce workload. However, the selection of neurons and segments of interest must be performed manually. The manual selection also allows inclusion of (e.g. for whole cell analysis) or exclusion of (e.g. for analysis of axons/dendrites) spines, which may contain α-tubulin when microtubules move in and out of dendritic spines in an activity-dependent manner (30).
One of the most important requirements for the method described here is to select the right normalization factor. The same rules for choosing a protein or an mRNA as a normalization control for western blotting or RT-PCR apply (11,31). Although some standards are expressed at relatively constant levels, their expression could vary depending on experimental conditions (32–34). It was reported previously that local translation of α1-tubulin in neurites is regulated by serotonin (35) or different culture conditions (36). Therefore, prior to performing the analysis, it should be confirmed that the protein selected is expressed at constant levels in target cells/tissues and that its expression levels do not change in culture or following various treatments. Western blotting can be used to establish constant levels of expression of a chosen protein; however, loading errors in Western blotting must be controlled as described (11). With a reliable normalization factor, the method can be extended to other cell types and tissues. In addition, Tubulin Tracker may be used for the analysis of protein and mRNA in live neurons.
Besides the use of an internal standard such as α-tubulin, an external standard can also be used as a normalization factor. At a single-cell level, diffusive fluorescent proteins such as GFP/RFP or vital fluorescent dyes (fluorescently labeled dextran) have been used to trace neuronal segments and to normalize for the variance in size, shape, and local volume of neurites (37,38). Comparison of our method with other normalization methods, which use diffusive fluorescent proteins or fluorescently labeled dextran, is summarized in Table 5.
Table 5.
Comparison of α-tubulin, fluorescent proteins (e.g., GFP), and fluorescent neuronal tracers (e.g., fluorescent dextran) as normalization factors
| FEATURE | METHOD
|
||
|---|---|---|---|
| α-TUBULIN | FLUORESCENT PROTEINS (E.G., GFP) | FLUORESCENT NEURONAL TRACERS (E.G., FLUORESCENT DEXTRAN) | |
| Type of standard | Internal | External | External |
| Need for genetic modification | No | Yes | No |
| Need for delivery, loading, or labeling | No | Yes, by transfection or use of transgenic mice expressing GFP. | Yes, in most cases, dyes have to be delivered to neurons. |
| Delivery/loading/labeling methods | N/A | Biological (viral vector), chemical (e.g., cell-penetrating peptides, α-toxin of S. aureus), vehicle (e.g., liposomes), mechanical (e.g., microinjection, whole-cell patch clamping, gene gun), electrical (electroporation) | Chemical (e.g., cell-penetrating peptides, α-toxin of S. aureus), vehicle (e.g., liposomes), mechanical (e.g., microinjection, whole-cell patch clamping, gene gun), electrical (electroporation) |
| Effects on neurons | N/A | Protein delivery methods may alter the physiology of neurons or cause toxicity. Chromosomal insertion by viral vectors may disrupt gene expression. | Loading/labeling neurons may alter the physiology or cause toxicity. The dyes themselves may be toxic to cells. |
| Distribution pattern | Similar to physiological distribution. | Distribution pattern may be uneven in a single neuron (e.g., puncta-like pattern, Ref. 38 and Ma, B., unpublished results). The distal-most part or fine structure may not be labeled. The pattern may be variable between cells due to different levels of protein expression (38,39). | The standards have to be anterogradely or retrogradely transported in neurons. In some cases, distribution pattern may be uneven in a single neuron (e.g., puncta-like pattern, Ref. 40). The distal-most part or fine structure may not be labeled. The pattern may be variable between cells due to different amounts of dye delivered (37). |
| Efficiency of delivery, loading, or labeling methods | N/A | Transfection efficiency may be low because primary neurons are difficult to transfect especially in older neuronal cultures. | Loading efficiency is variable. Depends on delivery methods. |
| Aldehyde-fixable | Yes | Yes, but some fluorescent proteins may become lost after fixation because GFP is highly water soluble and diffusable. | Yes, but only for specially treated dyes, e.g., lysinated dextrans. |
| Loss of fluorescence after immunofluorescent staining | No loss | Some fluorescent proteins are highly water soluble and may be lost after staining. | Fluorescent dyes may be washed out after staining. Lysinated dextrans are better. |
| Loss of fluorescence after FISH | No loss | Some fluorescent proteins are highly water soluble and might be lost after harsh treatment used in FISH. | Fluorescent dyes may be washed out after harsh treatment used in FISH. Lysinated dextrans are better. |
| Detection methods | Antibody staining | Fluorescence from fluorescent protein itself or antibody against fluorescent protein (in the case of GFP loss, see Ref. 38). | Fluorescence from conjugated fluorescent dye or antibody against the conjugated fluorescent dye or hapten. |
| Whole-cell analysis | Possible | Not possible | Not possible |
| Cell segment analysis | Possible | Possible | Possible |
| Live cell imaging and analysis | No. However, it is possible with Tubulin Tracker. | Possible | Possible |
| Prior tests before application | Need to test for constant expression in some cases (35), although it is a house-keeping gene. | Might be needed as GFP expression in different cells might be variable. | Might be needed as the amount and distribution of dyes loaded into different cells might be variable. |
| Accuracy | +++ | +++ | +++ |
Dynamic Distribution of BDNF and TrkB in Developing Cortical Neurons
In this study, dynamic distribution of BDNF and TrkB proteins before (DIV4), during (DIV7), and after (DIV10) synapse formation (22) was investigated in cortical neurons (Figs. 2A and 2B). In 0–30 μm proximal segments of axons and dendrites, the levels of BDNF did not increase from DIV4 to DIV7, whereas they increased significantly by DIV10. On the contrary, TrkB expression was observed to undergo no significant change during development and synapse formation. This may in part reflect transport of TrkB to the distal portion of neurons to receive the BDNF signal (21).
Local translation of BDNF has been suggested to contribute to neuronal development. Thus, we investigated the levels of BDNF mRNA in neurons at different DIV (Fig. 3A). Interestingly, we found BDNF mRNA present in axons and at levels comparable to those in dendrites. In both axons and dendrites, the BDNF mRNA levels increased with days in culture, supporting the notion that BDNF mRNA targeting is involved in neuronal development and synapse formation.
Dynamic Distribution of BDNF and TrkB Following Depolarization with KCl
Neuronal activity has been proposed to enhance BDNF signalling by selectively modulating TrkB receptors (41,42). We investigated the dynamic distribution of BDNF and TrkB proteins within proximal 0–30 μm and 30–60 μm segments of axons and dendrites after depolarization by KCl treatment (Figs. 2C and 2D). In the axons, the levels of BDNF increased, but in the dendrites, the BDNF levels decreased, possibly reflecting transport of BDNF to the distal end (>60 μm) for secretion. Furthermore, in whole neurons the total level of BDNF and the fraction of BDNF in the soma decreased following treatment with KCl, consistent with the above notion of anterograde transport and secretion (Fig. 4A).
Quantitative analysis of TrkB found the protein present in both 0–30 μm and 30–60 μm segments of axons and dendrites and its level increased after depolarization (Figs. 2E and 2F). The observed increase in TrkB protein in axons and dendrites may be due to redistribution and insertion of TrkB in membranes, instead of new protein synthesis because in an analysis of whole neurons, no difference was found in the total level of TrkB after depolarization (Fig. 4B). However, the percentage of TrkB in the soma decreased significantly after depolarization.
Treatment with KCl can change the distribution of mRNA or even stimulate new synthesis of mRNA in neurons (9). In both 0–30 μm and 30–60 μm segments of dendrites, the BDNF mRNA levels decreased after depolarization, suggesting transport of BDNF mRNA from proximal to distal compartments of neurons. By contrast, in 0–30 μm and 30–60 μm segments of axons, the BDNF mRNA levels did not change significantly after depolarization, demonstrating differences between dendrites and axons. It should be noted that rodent BDNF genes consist of eight exons encoding 5′ untranslated sequence, and one 3′ exon coding for pro-BDNF protein (43). Each 5′ non-coding exon is spliced to the protein-coding exon to generate a unique transcript that originates from one of at least eight distinct promoters. The results of the current study represented a composite of multiple BDNF transcripts; probe unique to each spliced mRNA should permit analysis of distinct transcripts. Quantitative analysis of the distribution of specific mRNAs in response to synaptic activity can offer new insights into post-transcriptional events occurring in neurons.
Dynamic Distribution of BDNF and TrkB after BDNF Stimulation
BDNF signalling through its receptor TrkB modulates survival, differentiation, and activity of neurons (44). We examined the effect of long-term BDNF treatment on the levels of BDNF/TrkB in cortical neurons (Fig. 5). We observed a small reduction in BDNF protein levels in axons potentially due to secretion of endogenous and endocytosed BDNF upon prolonged exposure (45). By contrast, the TrkB protein levels in both proximal and distal part of axons and dendrites decreased significantly following 1-h BDNF treatment. The findings are consistent with previous reports that continuous exposure to BDNF induces a negative feedback by depleting functional TrkB receptors from the neuronal surface (46). In addition, we found the levels of phospho-TrkB in the proximal part increased after stimulation, indicating activation of the TrkB receptor (47).
Analysis of TrkB mRNA levels showed no significant change after BDNF treatment in the axons, whereas a small increase was observed in the dendrites, possibly reflecting transport of newly synthesized TrkB mRNA (48). We suggest that the mRNA is blocked from translation or more likely, newly synthesized TrkB protein is degraded rapidly in order to explain the substantial reduction in the TrkB protein levels following BDNF treatment.
Comparative Analysis of BDNF/TrkB Expression in Cortical and Striatal Neurons
In addition to cortical neurons, we also performed quantitative analysis of protein and mRNA in neurons cultured from the striatum. We found no significant difference in BDNF protein levels in the axons from the cortex and the striatum, while significantly more BDNF protein was present in the dendrites from the striatum, presumably transported from the cortex. Interestingly, we also observed BDNF mRNA in striatal neurons: its axonal level was slightly higher than that of cortical neurons, while its dendritic level was slightly lower. These results differ from previously published data (24), in which BDNF mRNA levels in striatal neurons were significantly lower than those of cortical neurons when measured in vivo. The reason for the discrepancy is unclear. It was recently reported that conditional knockout of BDNF in the CNS demonstrated a specific requirement for this factor in dendritic growth of striatal neurons (49). Our results indicate that cultured striatal neurons can produce BDNF mRNA and offer the possibility of increasing BDNF levels in the striatum in vivo. This has therapeutic implications for neurodegenerative diseases such as Huntington’s disease, in which deprivation of BDNF in the striatum contributes to its pathophysiology (14,50).
Supplementary Material
Acknowledgments
Grant sponsor: NIH; Grant number: NS061917; Grant number: S10 RR017970.
The authors thank Wayne Rasband for the ImageJ program.
Footnotes
Additional Supporting Information may be found in the online version of this article.
Literature Cited
- 1.Lu B. BDNF and activity-dependent synaptic modulation. Learn Mem. 2003;10:86–98. doi: 10.1101/lm.54603. [DOI] [PMC free article] [PubMed] [Google Scholar]
- 2.Pezet S, Malcangio M, McMahon SB. BDNF: A neuromodulator in nociceptive pathways? Brain Res Brain Res Rev. 2002;40:240–249. doi: 10.1016/s0165-0173(02)00206-0. [DOI] [PubMed] [Google Scholar]
- 3.Tongiorgi E, Domenici L, Simonato M. What is the biological significance of BDNF mRNA targeting in the dendrites? Clues from epilepsy and cortical development. Mol Neurobiol. 2006;33:17–32. doi: 10.1385/MN:33:1:017. [DOI] [PubMed] [Google Scholar]
- 4.Schuman EM. Neurotrophin regulation of synaptic transmission. Curr Opin Neurobiol. 1999;9:105–109. doi: 10.1016/s0959-4388(99)80013-0. [DOI] [PubMed] [Google Scholar]
- 5.Patapoutian A, Reichardt LF. Trk receptors: Mediators of neurotrophin action. Curr Opin Neurobiol. 2001;11:272–280. doi: 10.1016/s0959-4388(00)00208-7. [DOI] [PubMed] [Google Scholar]
- 6.Tongiorgi E, Baj G. Functions and mechanisms of BDNF mRNA trafficking. Novartis Found Symp. 2008;289:136–47. doi: 10.1002/9780470751251.ch11. discussion 147–51, 193–195. [DOI] [PubMed] [Google Scholar]
- 7.An JJ, Gharami K, Liao GY, Woo NH, Lau AG, Vanevski F, Torre ER, Jones KR, Feng Y, Lu B, et al. Distinct role of long 3′ UTR BDNF mRNA in spine morphology and synaptic plasticity in hippocampal neurons. Cell. 2008;134:175–187. doi: 10.1016/j.cell.2008.05.045. [DOI] [PMC free article] [PubMed] [Google Scholar]
- 8.Chiaruttini C, Sonego M, Baj G, Simonato M, Tongiorgi E. BDNF mRNA splice variants display activity-dependent targeting to distinct hippocampal laminae. Mol Cell Neurosci. 2008;37:11–19. doi: 10.1016/j.mcn.2007.08.011. [DOI] [PubMed] [Google Scholar]
- 9.Tongiorgi E, Righi M, Cattaneo A. Activity-dependent dendritic targeting of BDNF and TrkB mRNAs in hippocampal neurons. J Neurosci. 1997;17:9492–9505. doi: 10.1523/JNEUROSCI.17-24-09492.1997. [DOI] [PMC free article] [PubMed] [Google Scholar]
- 10.Guenin S, Mauriat M, Pelloux J, Van Wuytswinkel O, Bellini C, Gutierrez L. Normalization of qRT-PCR data: The necessity of adopting a systematic, experimental conditions-specific, validation of references. Journal of experimental botany. 2009;60:487–493. doi: 10.1093/jxb/ern305. [DOI] [PubMed] [Google Scholar]
- 11.Liu NK, Xu XM. Beta-tubulin is a more suitable internal control than beta-actin in western blot analysis of spinal cord tissues after traumatic injury. J Neurotrauma. 2006;23:1794–1801. doi: 10.1089/neu.2006.23.1794. [DOI] [PubMed] [Google Scholar]
- 12.Ascoli GA. Neuroinformatics grand challenges. Neuroinformatics. 2008;6:1–3. doi: 10.1007/s12021-008-9010-5. [DOI] [PubMed] [Google Scholar]
- 13.Ma B, Savas JN, Yu MS, Culver BP, Chao MV, Tanese N. Huntingtin mediates dendritic transport of beta-actin mRNA in rat neurons. Sci Rep. 2011;1:140. doi: 10.1038/srep00140. [DOI] [PMC free article] [PubMed] [Google Scholar]
- 14.Gharami K, Xie Y, An JJ, Tonegawa S, Xu B. Brain-derived neurotrophic factor over-expression in the forebrain ameliorates Huntington’s disease phenotypes in mice. J Neurochem. 2008;105:369–379. doi: 10.1111/j.1471-4159.2007.05137.x. [DOI] [PMC free article] [PubMed] [Google Scholar]
- 15.Wibrand K, Messaoudi E, Havik B, Steenslid V, Lovlie R, Steen VM, Bramham CR. Identification of genes coupregulated with Arc during BDNF-induced long-term potentiation in adult rat dentate gyrus in vivo. Eur J Neurosci. 2006;23:1501–1511. doi: 10.1111/j.1460-9568.2006.04687.x. [DOI] [PubMed] [Google Scholar]
- 16.Osten P, Srivastava S, Inman GJ, Vilim FS, Khatri L, Lee LM, States BA, Einheber S, Milner TA, Hanson PI, et al. The AMPA receptor GluR2 C terminus can mediate a reversible, ATP-dependent interaction with NSF and alpha- and beta-SNAPs. Neuron. 1998;21:99–110. doi: 10.1016/s0896-6273(00)80518-8. [DOI] [PubMed] [Google Scholar]
- 17.Ma B, Culver BP, Baj G, Tongiorgi E, Chao MV, Tanese N. Localization of BDNF mRNA with the Huntington’s disease protein in rat brain. Mol Neurodegener. 2010;5:22. doi: 10.1186/1750-1326-5-22. [DOI] [PMC free article] [PubMed] [Google Scholar]
- 18.Jeanneteau F, Garabedian MJ, Chao MV. Activation of Trk neurotrophin receptors by glucocortisoids provides a neuroprotective effect. Proc Natl Acad Sci USA. 2008;105:4862–4867. doi: 10.1073/pnas.0709102105. [DOI] [PMC free article] [PubMed] [Google Scholar]
- 19.Takemoto-Kimura S, Ageta-Ishihara N, Nonaka M, Adachi-Morishima A, Mano T, Okamura M, Fujii H, Fuse T, Hoshino M, Suzuki S, et al. Regulation of dendritogenesis via a lipid-raft-associated Ca2+/calmodulin-dependent protein kinase CLICK-III/CaMKIgamma. Neuron. 2007;54:755–770. doi: 10.1016/j.neuron.2007.05.021. [DOI] [PubMed] [Google Scholar]
- 20.Ma B, Zimmermann T, Rohde M, Winkelbach S, He F, Lindenmaier W, Dittmar KE. Use of Autostitch for automatic stitching of microscope images. Micron. 2007;38:492–499. doi: 10.1016/j.micron.2006.07.027. [DOI] [PubMed] [Google Scholar]
- 21.Gomes RA, Hampton C, El-Sabeawy F, Sabo SL, McAllister AK. The dynamic distribution of TrkB receptors before, during, and after synapse formation between cortical neurons. J Neurosci. 2006;26:11487–11500. doi: 10.1523/JNEUROSCI.2364-06.2006. [DOI] [PMC free article] [PubMed] [Google Scholar]
- 22.Washbourne P, Bennett JE, McAllister AK. Rapid recruitment of NMDA receptor transport packets to nascent synapses. Nat Neurosci. 2002;5:751–759. doi: 10.1038/nn883. [DOI] [PubMed] [Google Scholar]
- 23.Mouland AJ, Mercier J, Luo M, Bernier L, DesGroseillers L, Cohen EA. The double-stranded RNA-binding protein Staufen is incorporated in human immunodeficiency virus type 1: Evidence for a role in genomic RNA encapsidation. J Virol. 2000;74:5441–5451. doi: 10.1128/jvi.74.12.5441-5451.2000. [DOI] [PMC free article] [PubMed] [Google Scholar]
- 24.Hofer M, Pagliusi SR, Hohn A, Leibrock J, Barde YA. Regional distribution of brain-derived neurotrophic factor mRNA in the adult mouse brain. EMBO J. 1990;9:2459–2464. doi: 10.1002/j.1460-2075.1990.tb07423.x. [DOI] [PMC free article] [PubMed] [Google Scholar]
- 25.Altar CA, Cai N, Bliven T, Juhasz M, Conner JM, Acheson AL, Lindsay RM, Wiegand SJ. Anterograde transport of brain-derived neurotrophic factor and its role in the brain. Nature. 1997;389:856–860. doi: 10.1038/39885. [DOI] [PubMed] [Google Scholar]
- 26.Conner JM, Lauterborn JC, Yan Q, Gall CM, Varon S. Distribution of brain-derived neurotrophic factor (BDNF) protein and mRNA in the normal adult rat CNS: Evidence for anterograde axonal transport. J Neurosci. 1997;17:2295–2313. doi: 10.1523/JNEUROSCI.17-07-02295.1997. [DOI] [PMC free article] [PubMed] [Google Scholar]
- 27.Antar LN, Dictenberg JB, Plociniak M, Afroz R, Bassell GJ. Localization of FMRP-associated mRNA granules and requirement of microtubules for activity-dependent trafficking in hippocampal neurons. Genes Brain Behav. 2005;4:350–359. doi: 10.1111/j.1601-183X.2005.00128.x. [DOI] [PubMed] [Google Scholar]
- 28.Dictenberg JB, Swanger SA, Antar LN, Singer RH, Bassell GJ. A direct role for FMRP in activity-dependent dendritic mRNA transport links filopodial-spine morphogenesis to fragile X syndrome. Dev Cell. 2008;14:926–939. doi: 10.1016/j.devcel.2008.04.003. [DOI] [PMC free article] [PubMed] [Google Scholar]
- 29.Glynn MW, McAllister AK. Immunocytochemistry and quantification of protein colocalization in cultured neurons. Nat Protoc. 2006;1:1287–1296. doi: 10.1038/nprot.2006.220. [DOI] [PubMed] [Google Scholar]
- 30.Jaworski J, Kapitein LC, Gouveia SM, Dortland BR, Wulf PS, Grigoriev I, Camera P, Spangler SA, Di Stefano P, Demmers J, et al. Dynamic microtubules regulate dendritic spine morphology and synaptic plasticity. Neuron. 2009;61:85–100. doi: 10.1016/j.neuron.2008.11.013. [DOI] [PubMed] [Google Scholar]
- 31.Wong ML, Medrano JF. Real-time PCR for mRNA quantitation. Biotechniques. 2005;39:75–85. doi: 10.2144/05391RV01. [DOI] [PubMed] [Google Scholar]
- 32.Thellin O, Zorzi W, Lakaye B, De Borman B, Coumans B, Hennen G, Grisar T, Igout A, Heinen E. Housekeeping genes as internal standards: Use and limits. J Biotechnol. 1999;75:291–295. doi: 10.1016/s0168-1656(99)00163-7. [DOI] [PubMed] [Google Scholar]
- 33.Thellin O, ElMoualij B, Heinen E, Zorzi W. A decade of improvements in quantification of gene expression and internal standard selection. Biotechnol Adv. 2009;27:323–333. doi: 10.1016/j.biotechadv.2009.01.010. [DOI] [PubMed] [Google Scholar]
- 34.Tunbridge EM, Eastwood SL, Harrison PJ. Changed relative to what? Housekeeping genes and normalization strategies in human brain gene expression studies. Biol Psychiatry. 2011;69:173–179. doi: 10.1016/j.biopsych.2010.05.023. [DOI] [PubMed] [Google Scholar]
- 35.Moccia R, Chen D, Lyles V, Kapuya E, EY, Kalachikov S, Spahn CM, Frank J, Kandel ER, Barad M, et al. An unbiased cDNA library prepared from isolated Aplysia sensory neuron processes is enriched for cytoskeletal and translational mRNAs. J Neurosci. 2003;23:9409–9417. doi: 10.1523/JNEUROSCI.23-28-09409.2003. [DOI] [PMC free article] [PubMed] [Google Scholar]
- 36.Marten NW, Burke EJ, Hayden JM, Straus DS. Effect of amino acid limitation on the expression of 19 genes in rat hepatoma cells. FASEB J. 1994;8:538–544. doi: 10.1096/fasebj.8.8.8181673. [DOI] [PubMed] [Google Scholar]
- 37.Oberti D, Kirschmann MA, Hahnloser RH. Correlative microscopy of densely labeled projection neurons using neural tracers. Front Neuroanat. 2010;4:24. doi: 10.3389/fnana.2010.00024. [DOI] [PMC free article] [PubMed] [Google Scholar]
- 38.Savas JN, Ma B, Deinhardt K, Culver BP, Restituito S, Wu L, Belasco JG, Chao MV, Tanese N. A role for huntington disease protein in dendritic RNA granules. J Biol Chem. 2010;285:13142–13153. doi: 10.1074/jbc.M110.114561. [DOI] [PMC free article] [PubMed] [Google Scholar]
- 39.Buerli T, Pellegrino C, Baer K, Lardi-Studler B, Chudotvorova I, Fritschy JM, Medina I, Fuhrer C. Efficient transfection of DNA or shRNA vectors into neurons using magnetofection. Nat Protoc. 2007;2:3090–3101. doi: 10.1038/nprot.2007.445. [DOI] [PubMed] [Google Scholar]
- 40.Clayton EL, Sue N, Smillie KJ, O’Leary T, Bache N, Cheung G, Cole AR, Wyllie DJ, Sutherland C, Robinson PJ, et al. Dynamin I phosphorylation by GSK3 controls activity-dependent bulk endocytosis of synaptic vesicles. Nat Neurosci. 2010;13:845–851. doi: 10.1038/nn.2571. [DOI] [PMC free article] [PubMed] [Google Scholar]
- 41.Nagappan G, Lu B. Activity-dependent modulation of the BDNF receptor TrkB: Mechanisms and implications. Trends Neurosci. 2005;28:464–471. doi: 10.1016/j.tins.2005.07.003. [DOI] [PubMed] [Google Scholar]
- 42.Tongiorgi E. Activity-dependent expression of brain-derived neurotrophic factor in dendrites: Facts and open questions. Neurosci Res. 2008;61:335–346. doi: 10.1016/j.neures.2008.04.013. [DOI] [PubMed] [Google Scholar]
- 43.Aid T, Kazantseva A, Piirsoo M, Palm K, Timmusk T. Mouse and rat BDNF gene structure and expression revisited. J Neurosci Res. 2007;85:525–535. doi: 10.1002/jnr.21139. [DOI] [PMC free article] [PubMed] [Google Scholar]
- 44.Numakawa T, Suzuki S, Kumamaru E, Adachi N, Richards M, Kunugi H. BDNF function and intracellular signaling in neurons. Histol Histopathol. 2010;25:237–258. doi: 10.14670/HH-25.237. [DOI] [PubMed] [Google Scholar]
- 45.Santi S, Cappello S, Riccio M, Bergami M, Aicardi G, Schenk U, Matteoli M, Canossa M. Hippocampal neurons recycle BDNF for activity-dependent secretion and LTP maintenance. EMBO J. 2006;25:4372–4380. doi: 10.1038/sj.emboj.7601303. [DOI] [PMC free article] [PubMed] [Google Scholar]
- 46.Haapasalo A, Sipola I, Larsson K, Akerman KE, Stoilov P, Stamm S, Wong G, Castren E. Regulation of TRKB surface expression by brain-derived neurotrophic factor and truncated TRKB isoforms. J Biol Chem. 2002;277:43160–43167. doi: 10.1074/jbc.M205202200. [DOI] [PubMed] [Google Scholar]
- 47.Ji Y, Lu Y, Yang F, Shen W, Tang TT, Feng L, Duan S, Lu B. Acute and gradual increases in BDNF concentration elicit distinct signaling and functions in neurons. Nat Neurosci. 2010;13:302–309. doi: 10.1038/nn.2505. [DOI] [PMC free article] [PubMed] [Google Scholar]
- 48.Righi M, Tongiorgi E, Cattaneo A. Brain-derived neurotrophic factor (BDNF) induces dendritic targeting of BDNF and tyrosine kinase B mRNAs in hippocampal neurons through a phosphatidylinositol-3 kinase-dependent pathway. J Neurosci. 2000;20:3165–3174. doi: 10.1523/JNEUROSCI.20-09-03165.2000. [DOI] [PMC free article] [PubMed] [Google Scholar]
- 49.Rauskolb S, Zagrebelsky M, Dreznjak A, Deogracias R, Matsumoto T, Wiese S, Erne B, Sendtner M, Schaeren-Wiemers N, Korte M, et al. Global deprivation of brain-derived neurotrophic factor in the CNS reveals an area-specific requirement for dendritic growth. J Neurosci. 2010;30:1739–1749. doi: 10.1523/JNEUROSCI.5100-09.2010. [DOI] [PMC free article] [PubMed] [Google Scholar]
- 50.Zuccato C, Ciammola A, Rigamonti D, Leavitt BR, Goffredo D, Conti L, MacDonald ME, Friedlander RM, Silani V, Hayden MR, et al. Loss of huntingtin-mediated BDNF gene transcription in Huntington’s disease. Science. 2001;293:493–498. doi: 10.1126/science.1059581. [DOI] [PubMed] [Google Scholar]
Associated Data
This section collects any data citations, data availability statements, or supplementary materials included in this article.