Abstract
Hemodynamic forces play an important role in sculpting the embryonic heart and its valves. Alteration of blood flow patterns through the hearts of embryonic animal models lead to malformations that resemble some clinical congenital heart defects, but the precise mechanisms are poorly understood. Quantitative understanding of the local fluid forces acting in the heart has been elusive because of the extremely small and rapidly changing anatomy. In this study, we combine multiple imaging modalities with computational simulation to rigorously quantify the hemodynamic environment within the developing outflow tract (OFT) and its eventual aortic and pulmonary valves. In vivo Doppler ultrasound generated velocity profiles were applied to Micro-Computed Tomography generated 3D OFT lumen geometries from Hamburger-Hamilton (HH) stage 16 to 30 chick embryos. Computational fluid dynamics simulation initial conditions were iterated until local flow profiles converged with in vivo Doppler flow measurements. Results suggested that flow in the early tubular OFT (HH16 and HH23) was best approximated by Poiseuille flow, while later embryonic OFT septation (HH27, HH30) was mimicked by plug flow conditions. Peak wall shear stress (WSS) values increased from 18.16 dynes/cm2 at HH16 to 671.24 dynes/cm2 at HH30. Spatiotemporally averaged WSS values also showed a monotonic increase from 3.03 dynes/cm2 at HH16 to 136.50 dynes/cm2 at HH30. Simulated velocity streamlines in the early heart suggest a lack of mixing, which differed from classical ink injections. Changes in local flow patterns preceded and correlated with key morphogenetic events such as OFT septation and valve formation. This novel method to quantify local dynamic hemodynamics parameters affords insight into sculpting role of blood flow in the embryonic heart and provides a quantitative baseline dataset for future research.
Keywords: shear stress, blood flow, rheology, mechanotransduction, morphogenesis, pulmonary valve, aortic valve, embryo, mechanobiology, finite element, simulation, vortex
INTRODUCTION
The heart is the first organ to develop in the embryo and its function is essential for delivering an ever-increasing supply of nutrients to the growing organism. The heart originates as two bilaterally symmetric fields of lateral plate mesoderm, which migrate and fuse at the midline to form a linear tube that quickly acquires synchronous beating49. The heart tube then forms a rightward loop, creating left right asymmetry for proper orientation of the heart. Subsequent to looping of the heart, the outflow tract (OFT) gains a characteristic dog-leg bend in its course from the right ventricle to the pericardial cavity. Simultaneous with heart looping, a hyaluronan-rich gelatinous matrix, called cardiac jelly (secreted by primary myocardium), forms swellings that project into the lumen of the entire OFT. Spatially restricted subsets of endocardial cells within the OFT and the atrioventricular canal are then stimulated to undergo endocardial-to-mesenchymal transition (EndMT). EndMT provides the initial bolus of cells that populate the cardiac jelly, forming cellularized masses (dubbed “cushions”) that eventually form the valves and fibrous septa in the heart13. Two outflow cushions proximal to the right ventricle in the OFT become the muscular pulmonary infundibulum, while three distal cushions within the proximal conus and distal truncus form the outflow valves40,61. Simultaneous with this process (beginning at HH30 in chick), a population of cells derived from the neural crest begins to migrate caudally through the walls of the aortic sac and into the fused truncal cushions, creating a crescent-shaped septal wedge that divides the OFT into aortic and pulmonary components1,32. By this stage, ventricular septation is also completed. Once these septations are completed, heart has two separate outflow vessels: pulmonary artery from right ventricle and aorta from left ventricle. In the chick embryo, this entire process occurs within one week of development, concomitant with a 100 fold increase in size7.
While the morphological characteristics of this process have been well studied, the mechanisms driving these morphogenic processes however remain incompletely understood. In 99% of cases, heart develops normally. On the other hand, congenital heart defects (CHD) are the most common and lethal types of birth defects, affecting 1–5% of all live births and are responsible for 10–30% preterm fetal deaths24,25,43,50. OFT region is critically affected in a large population of CHD and is associated with high morbidity and mortality46. Among clinical CHD cases, only a minority have an identifiable genetic cause19,33,48, necessitating investigation of other regulatory mechanisms. Importantly, CHD often originate as localized tissue abnormalities within a largely normal heart that lead to larger malformations that can seriously impair cardiac function at birth29. Many of these CHD shunt blood improperly between chambers, resulting in disproportionate tissue growth and regression51. Therefore hemodynamic factors, such as blood pressure and wall shear stress (WSS), are attractive alternative candidate regulators of cardiac development.
Much of what we know about embryonic hemodynamics has been determined from animal models such as the chick. Several studies have shown that blood pressure and cardiac output increase exponentially during cardiogenesis9,28, and these levels can be modulated with microsurgical interventions such as left atrial ligation27, vitelline vein ligation and conotruncal banding39. A key challenge however is quantifying hemodynamic indices like wall shear stress locally within these complex 3D anatomies. Typical interrogation locations (dorsal aorta and vitelline vein) are non-cardiac and don’t represent all blood flow. Microinjections of colored inks26 and micro-angiography55,62 are largely qualitative with a non-blood fluid rheology. Doppler ultrasound can record blood velocity at very fast rates (>10 kHz) but is only to rectify the peak blood velocity without respect to cross-sectional variations42. Optical coherence tomography37,38, confocal scanning30 and particle image velocimetry44 are promising techniques but currently can be used only for early stage embryos because of low imaging depth (<2mm). On the other hand, computational fluid dynamics (CFD) has the potential to give accurate estimates for local, biologically relevant hemodynamic metrics, even though it is sometimes difficult to validate results obtained with this technique. DeGroff et al. pioneered the use of image-based finite element modeling to simulate blood flow on early stage developing human embryonic hearts16. Groenendijk et al.21 and Liu et al.37,38 used finite element modeling to quantify blood flow in early stage chick embryo hearts. However, 3-D geometries in these studies are simplified or taken from reconstructed histological sections. Accurate representation of the 3D geometry is the most critical feature for simulating and analyzing blood flow accurately3. We recently developed a micro-computed tomography (Micro-CT) based 3D cardiac geometry generation technique in our lab, enabling us to capture torturous geometry at high spatial resolution (<10µm)7,31. This technique was recently employed by us and others to study antrioventricular and pharyngeal arch artery hemodynamics, respectively54,57. OFT region has been studied in many previous studies in mostly qualitative ways because this site is accessible to most optical techniques and it is a key site of CHD origination and propagation. Therefore it is critical to develop a rigorous understanding of the local hemodynamics present in normal embryonic development as a baseline for future studies as well as to interpret results of previous studies. In this study, we combine multiple imaging modalities with CFD analysis to create a comprehensive longitudinal analysis of local and global OFT hemodynamics in the embryonic chick model.
MATERIALS AND METHODS
Lumen Casts, Micro-CT Imaging, and Finite Element Model Creation
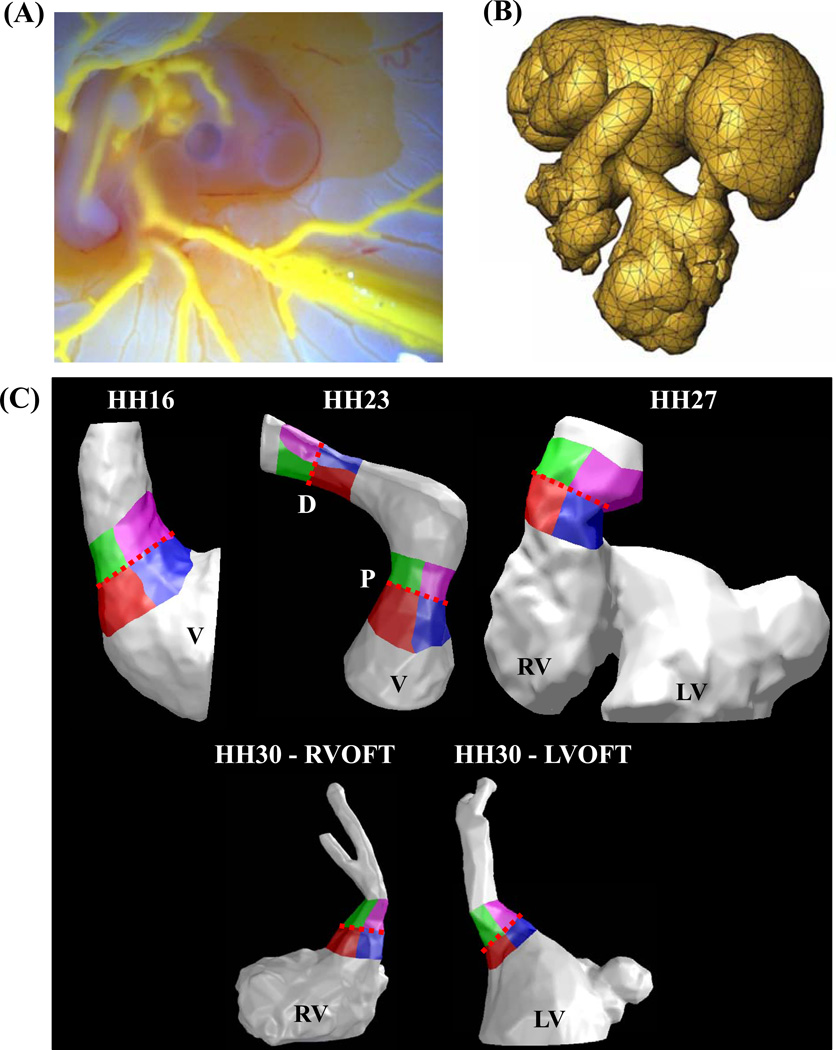
Intracardiac OFT 3D anatomy casts were created by microinjection of a self-polymerizing CT dense agent (Microfil, Flow-Tech, Carver Ma) (Figure 1A) as previously described7. The resultant anatomy represented physiologically dilated chamber volumes with open valves. Microfil perfused embryonic bodies were dissected away from the vitelline network and placed in 3 ml tubes filled with PBS. The embryos were then scanned via Micro-CT (Scanco, Inc) at 10 µm voxel resolution (approximately 400 slices/embryo). 3D Datasets were imported into GAMBIT (ANSYS, Inc) and meshed as previously described (Figure 1B)57. The ventricle, OFT and cushion geometry were isolated and the ventricles sectioned approximately 50% through its height to simulate inflow conditions into the OFT. The OFT was sectioned downstream from the distal cushions (Figure 1C). OFT regions in the model were separated into left and right inflow/outflow regions for WSS analysis. For HH23 both proximal and distal cushion regions were separated. At HH30, since OFT has septated into left and right sections, separations were done for both left ventricular OFT (LVOFT) and right ventricular OFT (RVOFT) (Figure 1C). For each analyzed stage, geometry from at least two embryo scans were analyzed independently..
Figure 1.
Finite element model creation. (A) A self polymerizing CT dense polymer, Microfil is microinjected into heart lumen. (B) 3D datasets generated via Micro-CT are meshed with GAMBİT. (C) Ventricles, cushions and outflow regions are isolated for each stage studied. Cushion regions where the WSS was traced: Right-Inflow regions are in red, Left-Inflow regions are in blue, Right-Outflow regions are in green, and Left-Outflow regions are in Purple. Trace colors match plot colors in Figures 5, 6, 9 and 10. Dotted Red Line – Mid-Cushion, separating inflow and outflow regions, V – Ventricle, P – Proximal cushions, D – Distal cushions, RV – Right ventricle, LV – Left ventricle, RVOFT – Right ventricular outflow tract, LVOFT – Left ventricular outflow tract
In Vivo Hemodynamic Measurements
Embryos were prepared at 72 hours gestation and cultured ex-ovo in custom housings as previously described57–59. We measured the inflow velocity to the ventricular OFT canal using B-mode guided Doppler ultrasound (Vevo770, Visualsonics, Inc.) by creating warmed Tyrodes solution as an aqueous conduit between the embryo and the ultrasound scanhead. B-mode imaging was also used to simultaneously measure the time varying diameter of the ventricular OFT canal at the midline of the closure region. Embryos were kept at 37°C during imaging by placing cultures in a water circulation heater as explained before58,59. After imaging, the embryos were transferred back to the incubator and allowed to recover. In this fashion we were able to serially image the same embryos for up to 6.5 days (the full duration of the study). For each analyzed stage, 5–6 doppler recordings were averaged to get velocity profiles at Figure 2, to be used in simulations.
Figure 2.
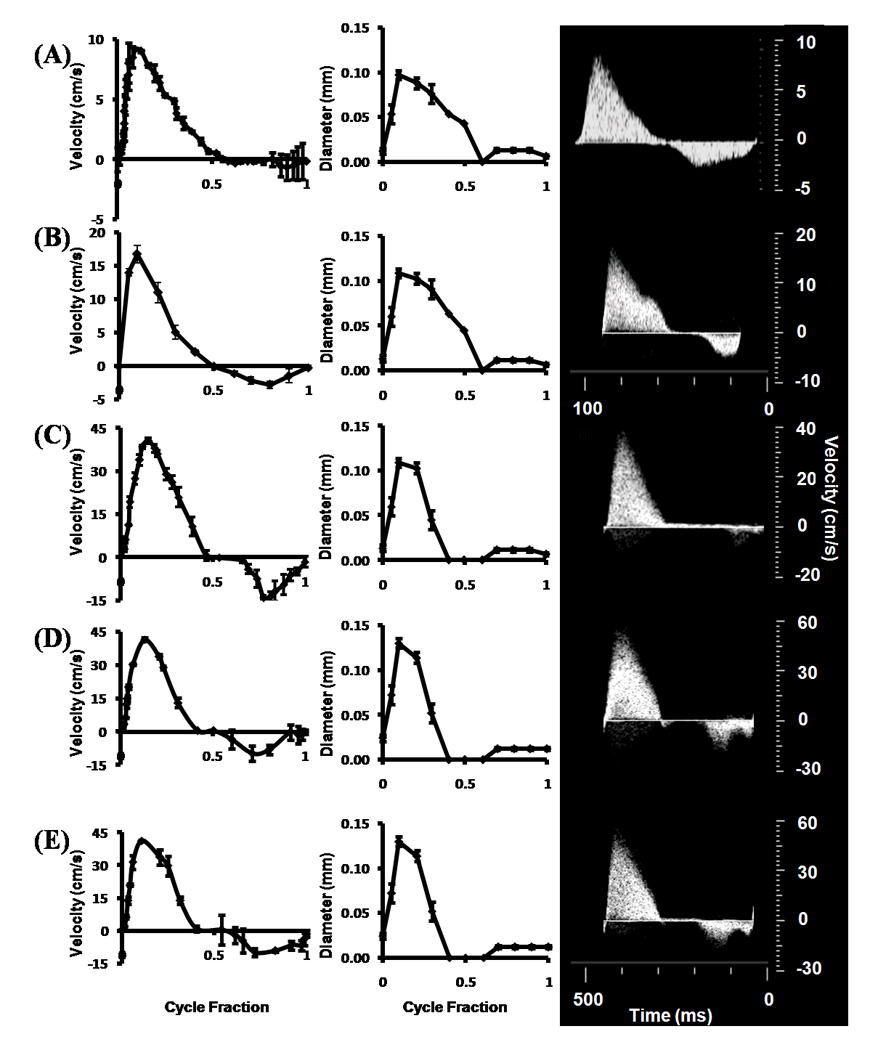
Stage specific OFT orifice flow profiles (left) and orifice diameters (right) as measured by ultrasound. Insets on right are original doppler recordings. (A) HH16. (B) HH23 - Proximal. (C) HH27. (D) HH30 – LVOFT. (E) HH30 – RVOFT. RVOFT – Right ventricular outflow tract, LVOFT – Left ventricular outflow tract.
Computational Simulations
Static geometries were generated to approximate the “instant” of systolic outflow where peak flow occurs. These geometries included 3D constructed anatomical features of the ventricular OFT. The meshed anatomies were imported into a CFD program running a transient, double precision and 3D pressure driven flow simulation, using stage specific velocity inputs (ANSYS FLUENT 12, ANSYS Inc.). We approximated inflow and outflow zones as flat elliptical regions on the mid-ventricular and distal OFT cross sections, respectively. Stage specific pulsatile flow (see below for details) was initiated using the Doppler ultrasound gathered velocity data and non-Newtonian blood rheology from Yalcin et al.57. As intra-ventricular flow cannot be quantified via ultrasound, our strategy therefore was to approximate ventricular ejection (the source of peak shear stress) as static 3D lumen geometry. To simulate initial blood flow profiles from mid-ventricle, we employed an iterative boundary approach as previously described57 using Doppler ultrasound quantified mid-cushion outflow velocity profiles as the in vivo baseline. Briefly, CFD simulations were conducted using a magnitude-scaled mid-cushion flow profile as a “fictitious” mid-ventricular input flow profile. The magnitude was iterated across a range and CFD simulations conducted to develop a correlation between ventricular inflow and cushion velocity profiles. From this, we could establish an input flow profile that generated the same mid-cushion outflow velocity profile as measured in vivo. These velocity profiles were then used as the input for CFD simulations. We performed a mesh convergence study and found out that at most 300,000 elements are sufficient for mesh independent solutions for all stages processed. Therefore all simulations were conducted with 300,000 tetrahedral elements. We continued simulations through multiple cardiac cycles until solutions were periodic for each time step. Convergence was enforced by reducing the residual of the continuity equation, as well as x-, y-, and z-momentum to 10−6 for all time steps. Each embryonic stage ran for 35 time steps, the entire length of one cardiac cycle, with 1000 iterations per time step (most solutions converged between 350–450 iterations). The computations were completed in between 36–48 hours on two Quad Core Intel Xenon processors (2.66 GHz) workstation with 8 GB of ram.
In Vivo WSS Approximation
Flow fields at the boundary layer are difficult to determine and validate due to the tortuous and rapidly moving walls in embryonic chick hearts. We therefore compared CFD simulated cross-sectional flow profiles at mid-cushion region (with static wall geometry) against Poiseuille and Plug flow approximations56. Poiseuille flow assumes a parabolic velocity distribution whereas in Plug flow, flow velocity is constant in the flow region except in the boundary layer where velocity increases sharply from zero at the wall to the constant velocity value. CFD calculated WSS were also compared to In vivo WSS values calculated for both Poiseuille and Plug Flow assumptions.
WSS formula for Plug Flow condition:
| (1) |
where τ is the shear stress, μ is the Non-Newtonian viscosity generated from the power law relationship and ∂u/∂y is the axial flow velocity at the wall with respect to the axis pointing channel center. The boundary layer thickness was estimated by analyzing the CFD flow profile shapes at peak velocity, assuming that the crossectional variation of the profile is constant throughout the cycle.
WSS formula for Poiseuille Flow condition:
| (2) |
where μ is the viscosity taken at .001 Pa-s, um is the mean flow velocity from Doppler recordings and d is the diameter from the B mode measurements. Figure 1 shows the tracings for each HH stage where the WSS was gathered at each time point for the cardiac cycle. Each developmental stage (HH16-30) is divided into four quadrants, the Right/Left Inflow which is the surface area before the midline of the cushion and the Right/Left outflow which is after the midline of the cushion out into the OFT.
RESULTS
Measurement of In vivo Cardiac Outflow Hemodynamics
Doppler and B-mode ultrasound was applied to quantify the mid-cushion OFT velocity and diameter profiles, respectively, in each embryo, and results are shown in Figure 2 A–E. Peak OFT velocities increased monotonically from 9.20 ± 0.09 cm/s to 41.62 ± 0.13. Peak lumen diameter steadily increased from .097 ± 0.01 mm to .13 ± 0.01 mm from stages HH16 to HH30. While all outflow profiles were generally unidirectional with a single ejection peak, a small amount of regurgitation occurs at the end of each cycle after HH16. Relating this velocity with its respective lumen diameter shows that regurgitation is less than 5% of the total flow at any stage.
Characterization of Stage Specific Outflow Hemodynamics
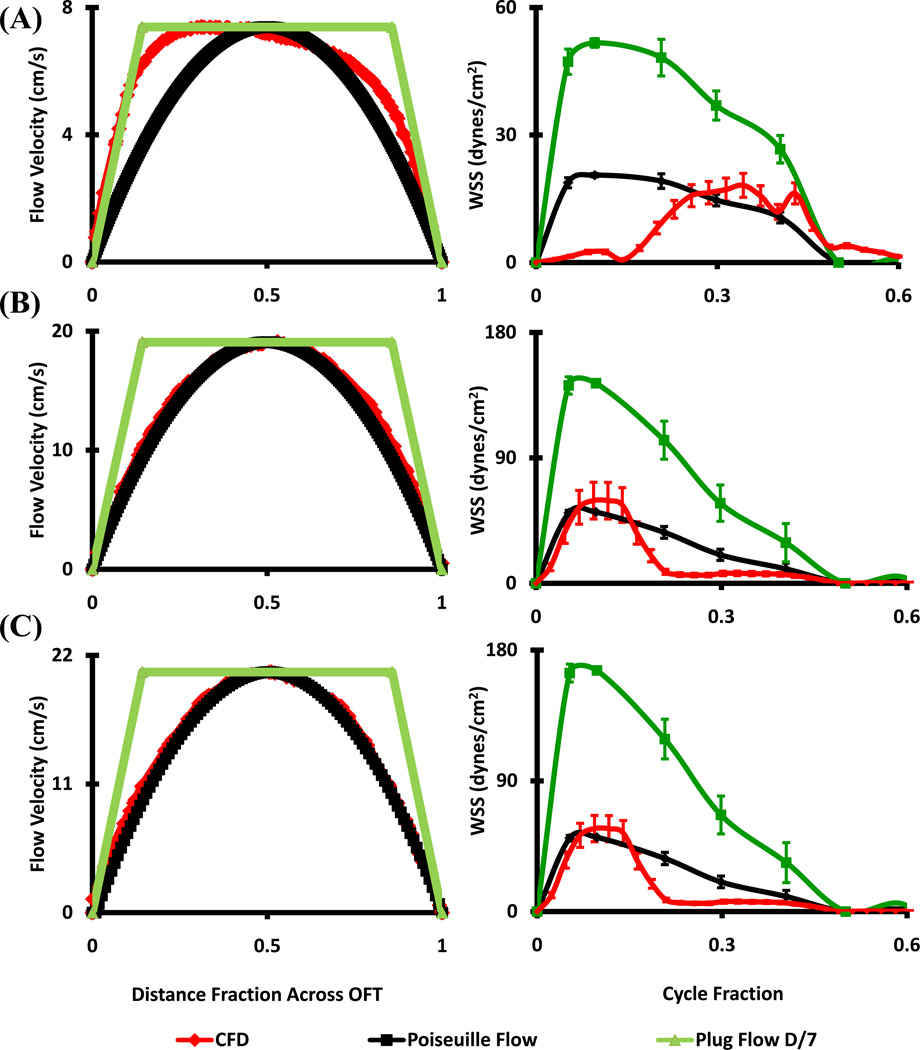
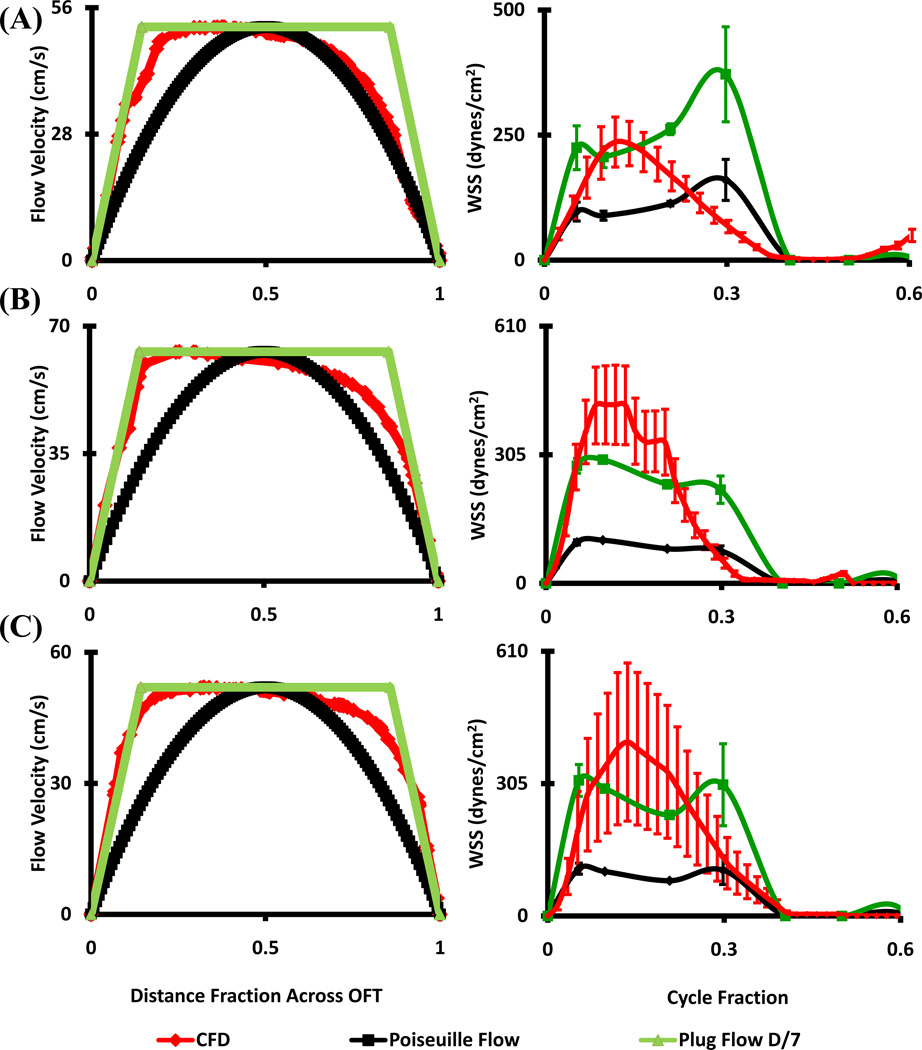
CFD simulated flow fields were compared with in vivo ultrasound measurements at the plane of the outflow cushions. Flow at HH16 matched Poiseuille flow for the second half of the cardiac cycle, but flow was undervalued by either approximation for the first half (Figure 3A). At HH23 however, both proximal and distal cushion regions resembled Poiseuille flow conditions (Figure 3B and C) in the first half of flow (including the peak), but undervalued in the second half by either approximation. HH27 and HH30 outflow cross-sectional velocity profiles deviated significantly from Poiseuille flow but closely matched Plug flow condition with boundary layer thickness approximately 1/7th of the lumen diameter (Figure 4). Plug or Poiseuille flow approximations incompletely mimicked the CFD simulated WSS profiles across the full cardiac cycle. The early to peak ejection phase WSS was better approximated as plug flow for HH27 and HH30, while WSS was undervalued for the latter half of the cycle. Collectively, these results suggest that in vivo OFT ejection hemodynamics can be reasonably approximated as Poiseuille flow up to HH23, and Plug flow for up to HH30.
Figure 3.
Stage specific OFT orifice flow profiles at peak velocity (left) and spatially averaged WSS throughout cardiac cycle (right) as calculated by CFD and from ultrasound data with Poiseuille and Plug Flow (boundary layer 1/7th of the diameter) assumptions. (A) HH16. (B) HH23 - Proximal. (C) HH23 - Distal.
Figure 4.
Stage specific OFT orifice flow profiles at peak velocity (left) and spatially averaged WSS throughout cardiac cycle (right) as calculated by CFD and from ultrasound data with Poiseuille and Plug Flow (boundary layer 1/7th of the diameter) assumptions. (A) HH27 (B) HH30 – RVOFT. (C) HH30 – LVOFT. RVOFT – Right ventricular outflow tract, LVOFT – Left ventricular outflow tract
CFD Simulations Results
Peak WSS increased monotonically from 18.16 ± 3.18 at HH16 OFT to 671.24 ± 211.46 at HH30 right ventricular OFT (RVOFT) and 400.93 ± 65.65 dynes/cm2 left ventricular OFT (LVOFT) (Table 1). This trend is also present in the spatially averaged WSS at peak velocity output, in which there was an increase from 9.55 ± 0.4 at HH16 to 226.67 ± 20.41 dynes/cm2 at HH30 LVOFT. Spatially and temporally averaged WSS through the cardiac cycle had a monotonic increase from 3.03 ± .11 at HH16 to 136.50 ± 17.82 dynes/cm2 at HH30 LVOFT, which is expected due to the increase in velocity output from the ventricles. Peak Reynolds numbers varied between 2.23 ± 0.19 and 16.63 ± 1.46 for all cases, consistent with a laminar streamline flow velocities. In addition, peak vorticity had a steady increase from 785.86 ± 71.01 to 25795.40 ± 9610.22 1/s from HH16 to HH30 RVOFT. Peak pressure values varied between 0.003mmHg and 3.68 mmHg
Table 1.
CFD Simulation Results, RVOFT – Right ventricular outflow tract, LVOFT – Left ventricular outflow tract
| Stage (HH) |
Peak WSS, (Dynes/cm2) |
Spatially Averaged WSS at Peak Velocity (Dynes/cm2) |
Spatially and Temporally Averaged WSS (Dynes/cm2) |
Peak Reynolds Number |
Peak Vorticity (1/s) |
Peak Pressure Drop (mmHg) |
|---|---|---|---|---|---|---|
| 16 | 18.16 (3.18) |
9.55 (0.40) |
3.03 (0.11) |
2.23 (0.19) |
785.86 (71.01) |
0.865 (0.006) |
| 23 Proximal |
59.36 (10.07) |
28.15 (7.47) |
4.23 (0.09) |
.003 (0.002) |
956.67 (287.22) |
0.083 (0.005) |
| 23 Distal |
57.12 (9.04) |
31.69 (7.48) |
7.05 (0.82) |
.003 (0.001) |
1540 (408.78) |
0.113 (0.051) |
| 27 | 236.07 (39.34) |
111.74 (21.7) |
39.49 (9.34) |
9.28 (0.367) |
10671.9 (2693.04) |
0.664 (0.038) |
| 30 RVOFT |
671.24 (211.46) |
184.36 (34.26) |
100.67 (27.82) |
16.63 (1.46) |
25795.4 (9610.22) |
0.003 (0.412) |
| 30 LVOFT |
400.93 (65.65) |
226.67 (20.41) |
136.50 (17.82) |
9.72 (0.72) |
13271.7 (1285.52) |
3.68 (1.167) |
HH16 Simulation Results
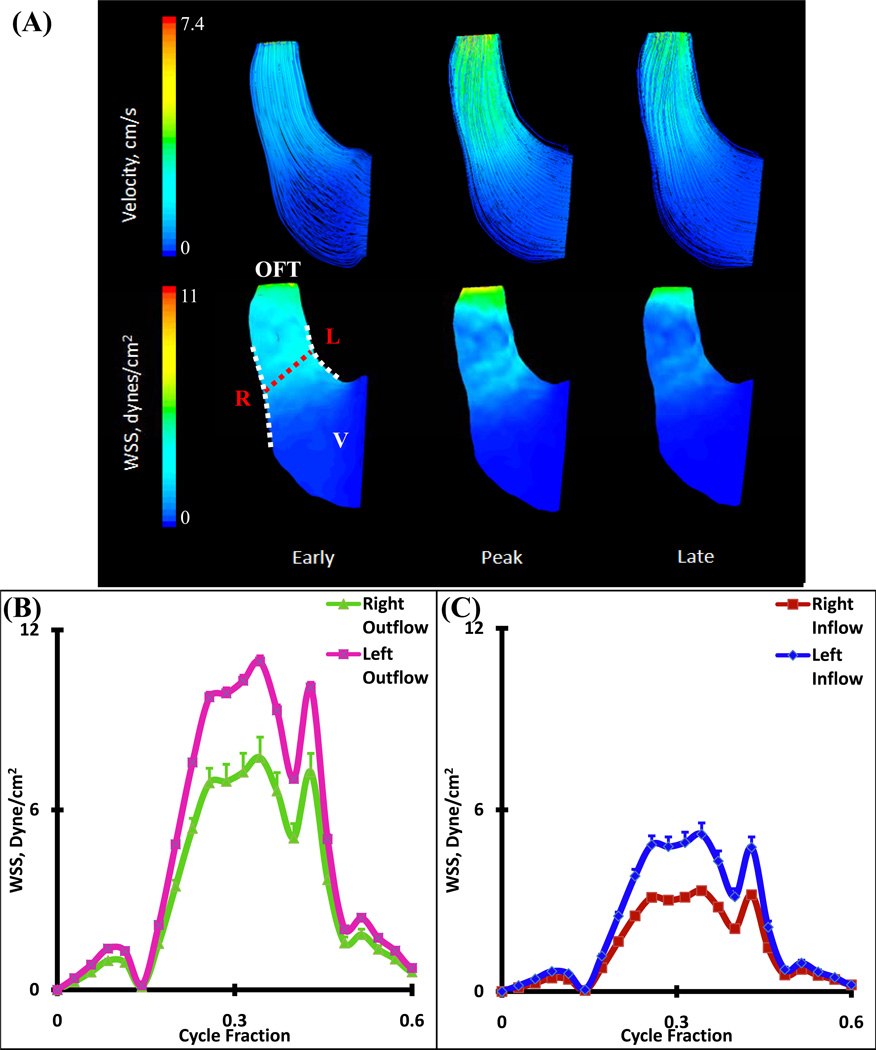
There are no valves or cushions present in the HH16 OFT, but it is lined with a gelatinous matrix (dubbed cardiac jelly) that acts as valves in concert with the suction pump motion of the muscular sheath17. CFD simulations demonstrated that the velocity pathlines are essentially parallel and unidirectional with low Reynolds numbers (Figure 5A and Table 1). Spatially averaged WSS on the right and left regions for the inflow and outflow sections of OFT were compared for one complete cardiac cycle (Figure 5B and C, see Figure 1 for traced regions). Simulations determined spatially averaged peak WSS of 7.75 ± 0.68 dynes/cm2 on the right vs. 10.95 ± 0.19 dynes/cm2 on the left segment in the outflow sections. Concurrently, peak WSS for the inflow sections were 3.33 ± 0.03 dynes/cm2 on the right vs. 5.19 ± 0.37 dynes/cm2 for the left segments. Peak WSS ranges occurred at the same time as peak velocity.
Figure 5.
(A) 3D hemodynamic environment in OFT region – Stage HH16. (B) Spatially averaged WSS on the Right and Left outflow regions (after mid cushion). (C) Spatially averaged WSS on the Right and Left inflow regions (before mid-cushion). Red Dotted Line – Mid-Cushion seperating inflow and outflow regions, R – Right region, L – Left region, White Dotted Line – Area of WSS data collected, OFT – Outflow Tract, V – Ventricle
HH23 Simulation Results
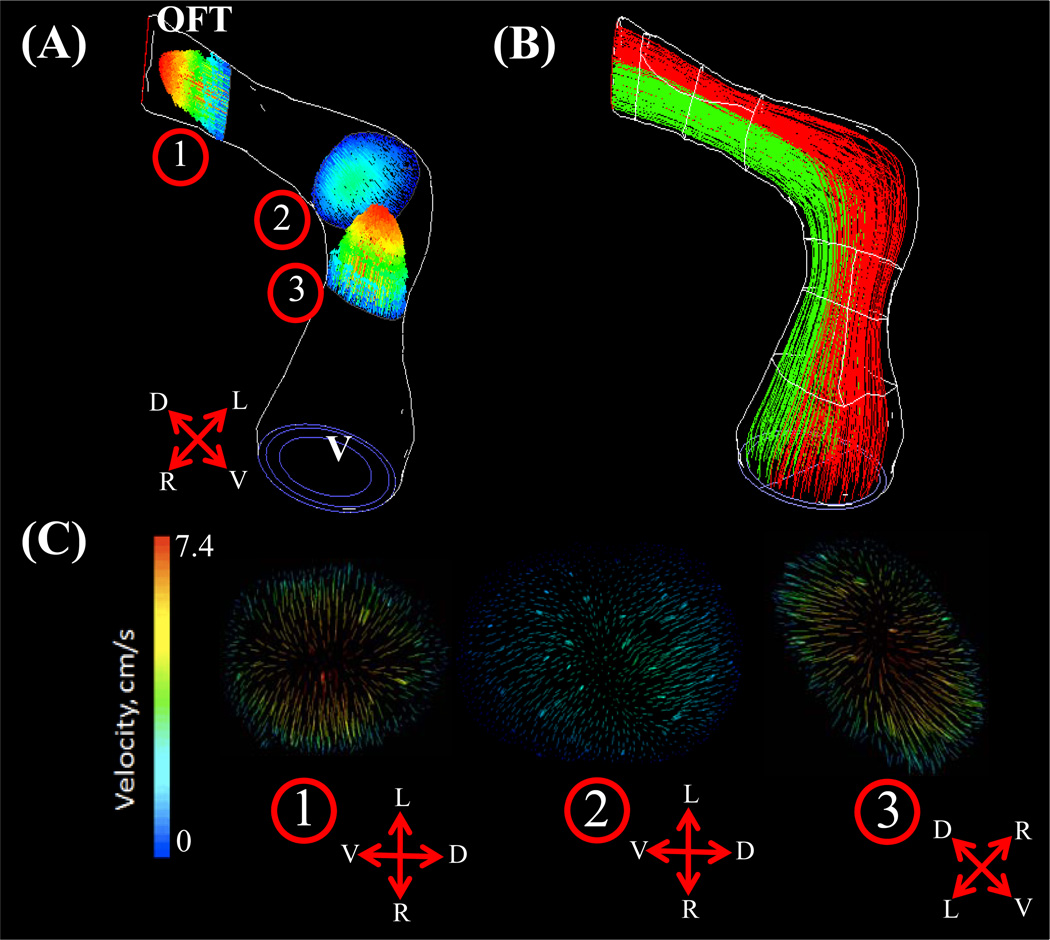
At HH23, the OFT possesses a characteristic dog-leg bend in its course from the right ventricle, dividing the OFT into the distinct proximal and distal portions. A pair of cellularized and expanded cardiac cushions develop at both proximal and distal outflow sites. Flow simulations show the inflow velocity streams in HH23 hearts are laminar and show an increase in velocity magnitudes over the proximal and distal cushion regions (Figure 6A). Spatially averaged WSS on the right and left surfaces of the outflow and inflow surfaces were compared throughout the cardiac cycle for both proximal and distal cushions (Figure 6B and C respectively, See Figure 1 for traced regions). For the proximal cushions, the spatially averaged peak WSS on the right and left regions for the outflow section were not significantly different (38.43 ± 14.04 dynes/cm2). Similarly, for inflow section of proximal cushions, the spatially averaged peak WSS on the right and left regions were not significantly different (18.40 ± 0.31 dynes/cm2). However, these values were significantly different between themselves, suggesting local variability rather than flow symmetry at those sections. On the other hand, WSS symmetry was observed in the distal cushion regions, with significantly indifferent spatially averaged peak outflow and inflow WSS of 30.56 ± 11.36 dynes/cm2 and 31.47 ± 3.12 dynes/cm2, respectively. Peak WSS and velocity both occurred at cushion locations. As shown in Figure 7, little lateral mixing of the flow occurs at this stage, which supports the very low Reynolds number flow (See also Supplemental Video 1 for velocity pathline animation for one cardiac cycle).
Figure 6.
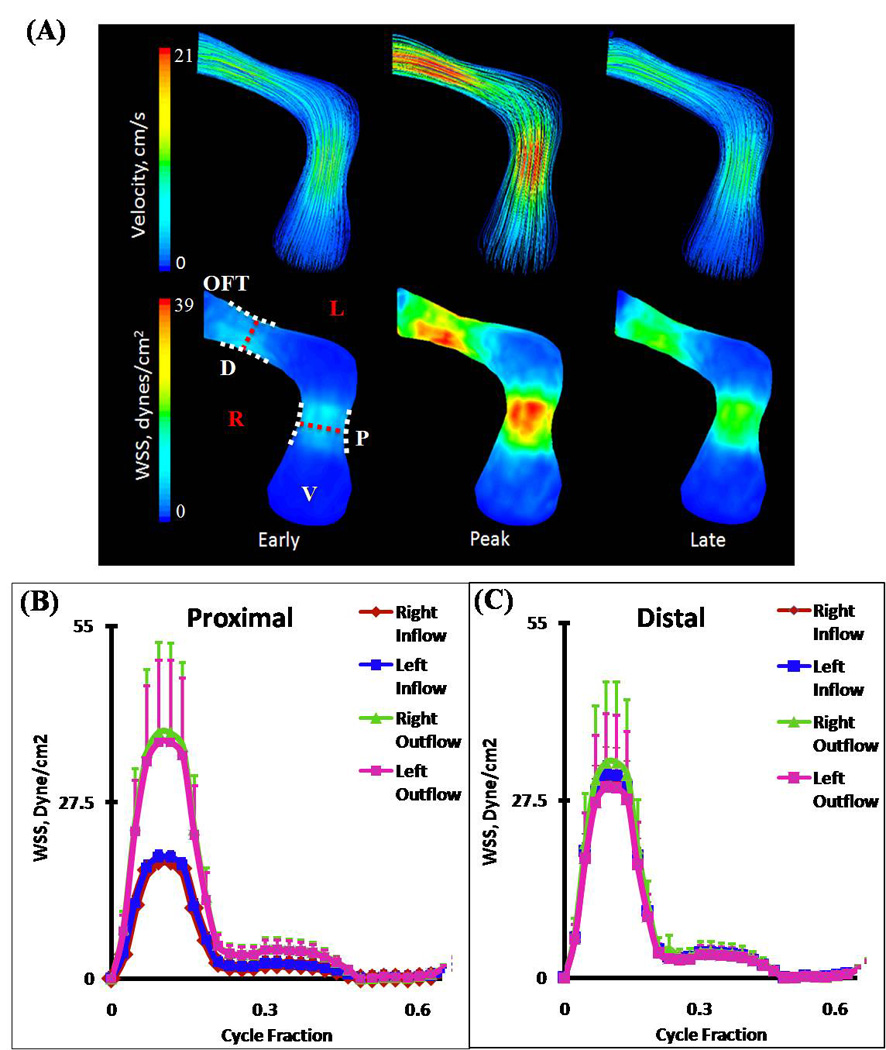
(A) 3D hemodynamic environment in OFT region – Stage HH23. (B) Spatially averaged WSS on proximal cushions, Red Dotted Line – Mid-Cushion seperating inflow and outflow regions. (C) Spatially averaged WSS on distal cushions, Red Dotted Line – Mid-Cushion seperating inflow and outflow regions. R – Right region, L – Left region, P – Proximal cushions, D – Distal cushions, White Dotted Line – Area of WSS data collected, OFT – Outflow Tract, V – Ventricle.
Figure 7.
Velocity planes at select OFT regions – Stage HH23. Pathlines colored by velocity magnitude. (A) Outline of complete wall geometry and associated locations of selected velocity planes. (B) Velocity path lines originating from Right and Left sides of the ventricle regions at peak velocity. (C) Velocity planes at (1) distal cushion, (2) dog leg bend, (3) proximal cushion, OFT – Outflow Tract, V – Ventricle. In direction arrows, L – Left, R – Right, V – Ventral, D – Dorsal.
HH27 Simulations
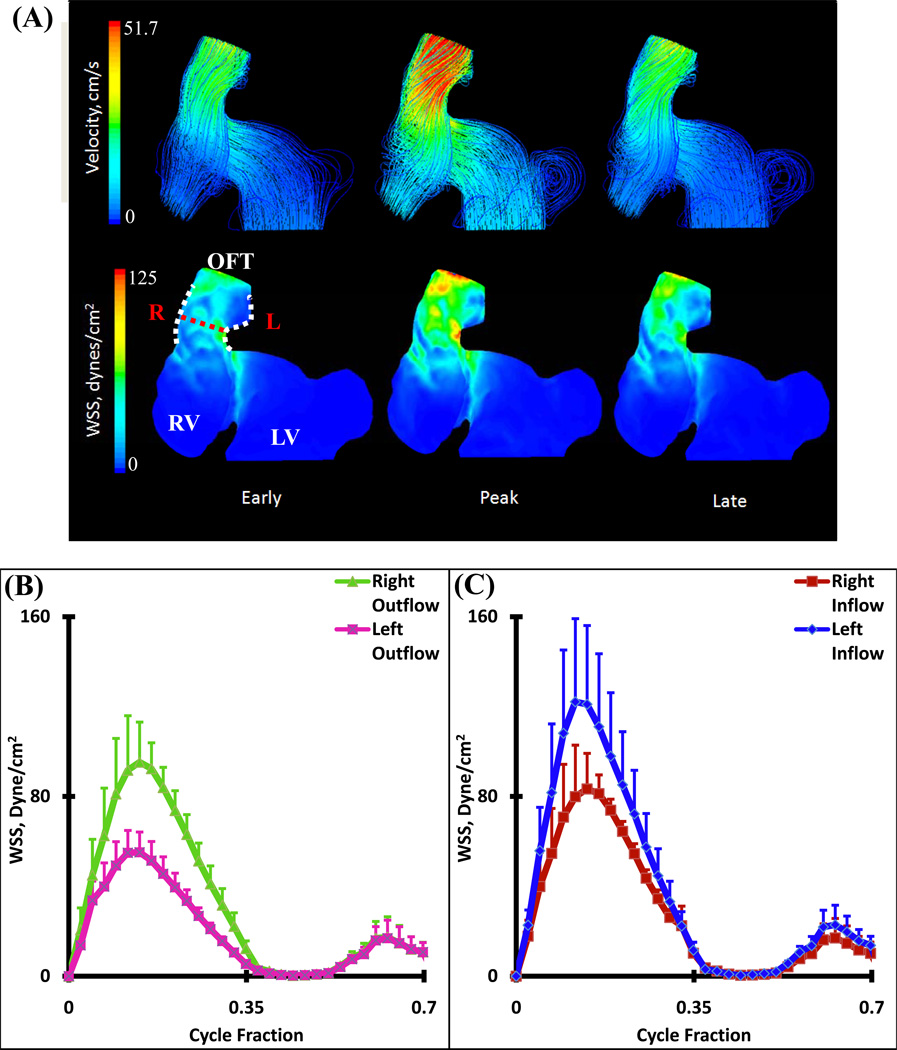
At this stage, fusion of the distal endocardial cushions has begun to take place, dividing the distal part of the OFT itself into the intrapericardial components of the aorta (following the inner myocardial wall from the left ventricle) and pulmonary trunk (right ventricle section)45. Two arterial limbs can now be traced from the aortopulmonary septum into the distal OFT, giving rise to a large degree of vorticity (mixing plane velocity streamlines). The blood pathlines from the upper half of the right ventricle and the left most half of the left ventricle created the central bolus in the cushion regions; with the outer mixing bolus being created by the lower half of the right ventricle and right most half of the left ventricle (Figure 8B, see also Supplemental Video 2 for velocity pathline animation for one cardiac cycle). CFD simulations showed a strong jet from the left and right ventricles into the distal cushions causing high shear stresses on the inflow cushion surfaces with flow separation from the outflow surface and myocardial walls. Blood rebounds off this wall from the left ventricle and OFT and spirals towards the limbs of the aortopulmonary septum (Figure 9A). Spatially averaged WSS on the right and left surfaces of the outflow and inflow surfaces were compared throughout the cardiac cycle for both distal cushions (Figure 9 B and C, See Figure 1 for traced regions). The spatially averaged peak WSS on the right and left outflow surfaces are 95.24 ± 17.87 dynes/cm2 and. 55.16 ± 9.01 dynes/cm2 respectively. For right and left inflow surfaces, the spatially averaged peak WSS values were 83.33 ± 15.88 dynes/cm2 and 122.10 ± 37.04 dynes/cm2, respectively (Figure 9C).
Figure 8.
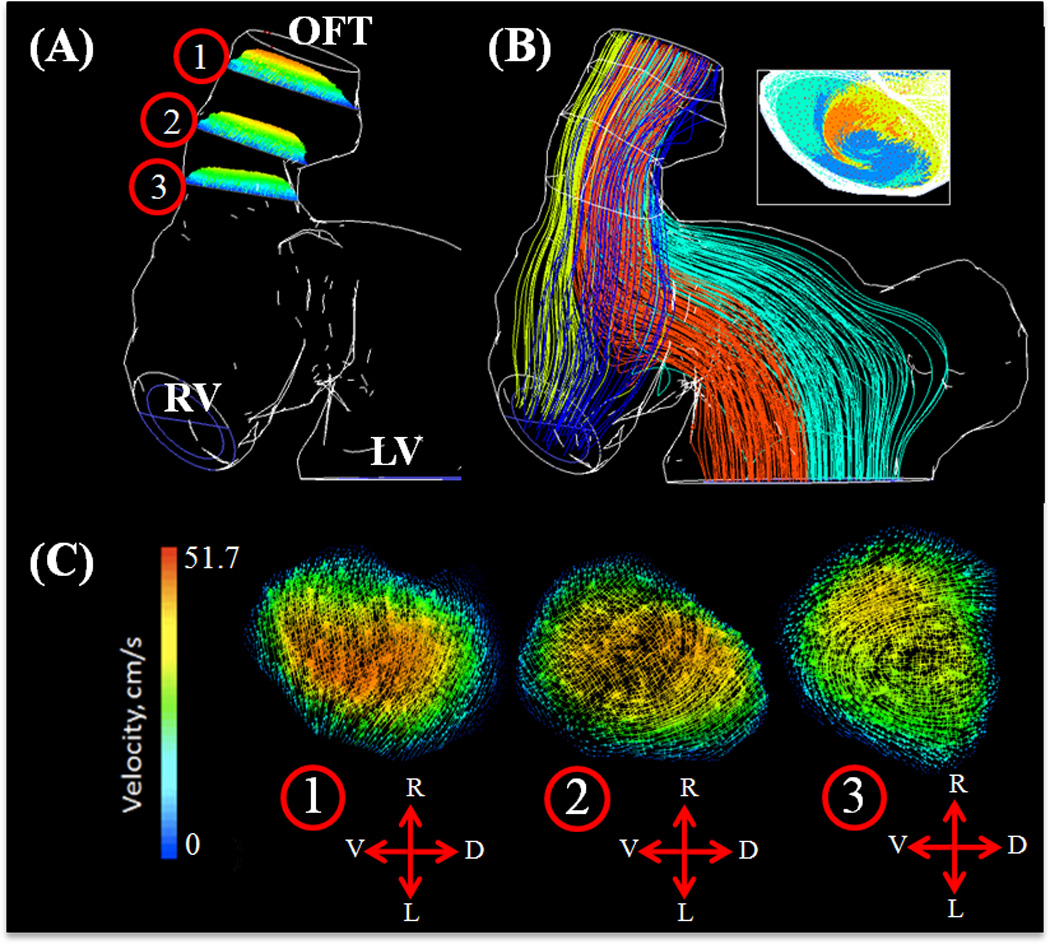
(A) Velocity planes at select OFT regions – Stage HH27. Pathlines colored by velocity magnitude. Outline of complete wall geometry and associated locations of selected velocity planes. (B) Velocity path lines originating from each ventricle region with inset showing outflow mixing at peak velocity. (C) Velocity planes at (1) End outflow segment, (2) Distal cushion, (3) Beginning inflow segment, OFT – Outflow Tract, RV – Right Ventricle, LV – Left Ventricle. In direction arrows L – Left, R – Right, V – Ventral, D – Dorsal.
Figure 9.
(A) 3D hemodynamic environment in OFT distal cushion region – Stage HH27. ((B) Spatially averaged WSS on the Right and Left outflow regions (after mid cushion). (C) Spatially averaged WSS on the Right and Left inflow regions (before mid-cushion). Red Dotted Line – Mid-Cushion seperating inflow and outflow regions, R – Right region, L – Left region, White Dotted Line – Area of WSS data collected, OFT – Outflow Tract, RV – Right Ventricle, LV – Left Ventricle
HH30 Simulations
At this stage, fusion of the distal ends of the distal cushions with one limb of the aortopulmonary septum and fusion of the posterior ends of the distal cushion with the other limb has taken place. The two limbs that could be traced from the aortopulmonary septum have fused with each other, splitting the distal dorsal cushion in half, and separating the developing aortic and pulmonary channels. Each OFT now contains three valvular cusp primordia. The changes in the wall of the distal segment of the OFT have now created distinct pulmonary and aortic trunks. At the distal segment, the arterial valves and the supporting sinus walls are beginning to develop through excavation of the distal cushions. More proximally, the cushions have begun to fuse in a proximal-distal direction thus, forming a septum between the developing subpulmonary and subaortic outlets. The pulmonic and aortic orifice areas were significantly larger at HH30, but the inflow velocity was also much greater. Blood streamlines at the opening of the ventricle begin to spiral back on themselves, leading to an increase in WSS at the pulmonary and aortic roots. The overall nature of the fluid is laminar (Figure 10 A). Spatially averaged shear stresses on the right (pulmonary) and left (aortic) outflow cushions were compared throughout cardiac cycle (Figure 10 B and C respectively, See Figure 1 for traced regions). CFD simulations show strong jets from left ventricle to aortic OFT and from right ventricle to pulmonary OFT. Aortic segments are exposed to higher stresses than pulmonary segments. Differences in the right vs. left segments arise from the fusing of the proximal cushions along the pulmonary and aortic walls. Interestingly, at this stage outflow cushion surfaces for both aortic and pulmonary segments are now exposed to higher stresses than inflow surfaces in contrast to HH27. For pulmonary OFT, spatially averaged peak WSS for right outflow and left outflow are 291.82 ± 95.81 dynes/cm2 and 252.09 ± 76.91 dynes/cm2 respectively and for right inflow and left inflow 85.87 ± 26.20 dynes/cm2 and 92.27 ± 22.59 dynes/cm2 respectively (Figure 10 B). For aortic OFT, spatially averaged peak WSS for right outflow and left outflow are 287.13 ± 51.55 dynes/cm2 and 400.93 ± 28.27 dynes/cm2 and for right inflow and left inflow 109.40 ± 16.68 dynes/cm2 and 109.23 ± 3.42 dynes/cm2 respectively (Figure 10C).
Figure 10.
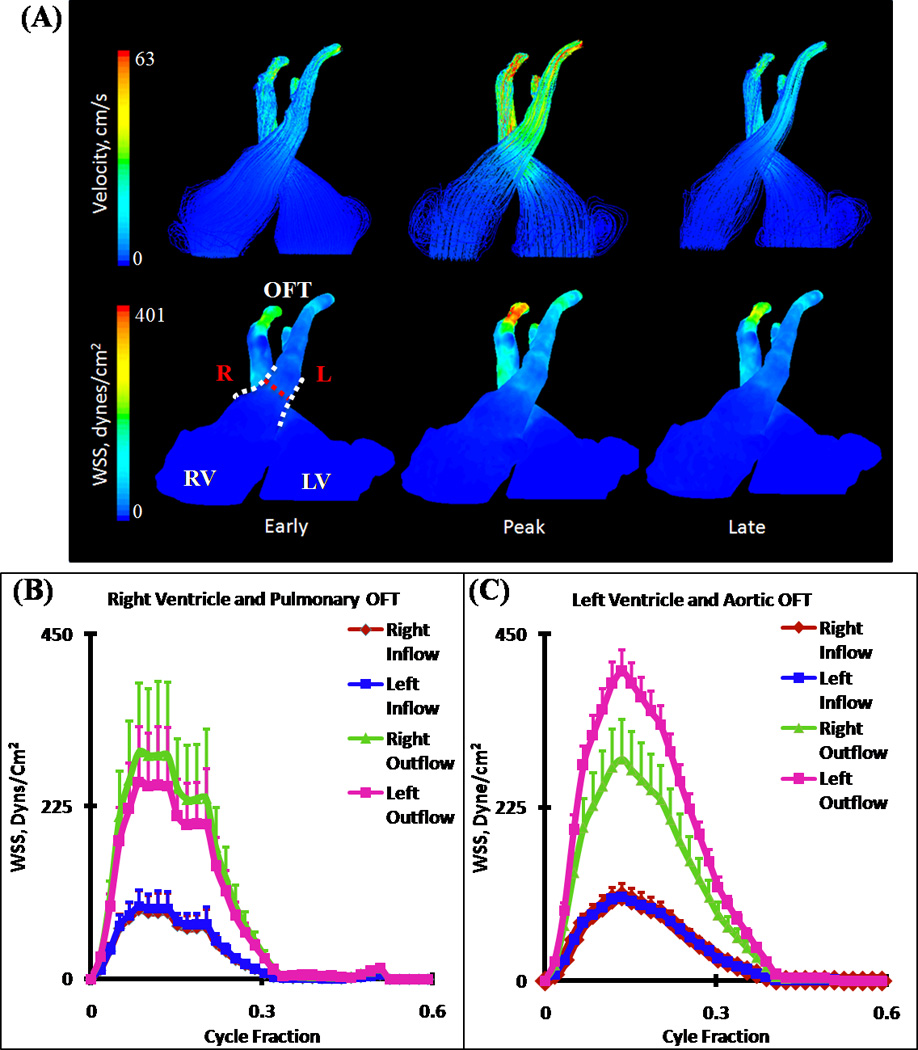
(A) 3D hemodynamic environment in Right and Left Ventricular OFT cushion regions – Stage HH30. (B) Spatially averaged WSS on the pulmonary OFT. (C) Spatially averaged WSS on the aortic OFT. Red Dotted Line – Mid-Cushion seperating inflow and outflow regions, R – Right region, L – Left region, White Dotted Line – Area of WSS data collected, OFT – Outflow Tract, RV – Right Ventricle, LV – Left Ventricle. (NOTE: Tracings of Left Ventricular OFT is shown in Figure 1)
DISCUSSION
Hemodynamics plays a vital role in driving and maintaining cardiovascular development23. Changes in normal blood flow during development can lead to myriad of CHD. Recent studies on aortic arch hemodynamics have been correlated to prognosis of CHD relatively late in cardiogenesis36,54. Furthermore, local changes in hemodynamics have the potential to change or modify the phenotype of a developing heart vessel, evidenced by studies on Zebrafish34,35. However, without actively quantifying the relevant local hemodynamic indices (e.g. WSS) imparted onto these mechanobiological specimens, our deeper understanding of the system and creating clinically relevant therapies are limited.
Previous in-vitro studies enabled to analyze the cellular responses to hemodynamic forces. An important area of study is the effect of blood flow on vascular endothelial cells. Endothelial cells (ECs), which line the entire vasculature in vertebrates, act as force sensors and transducers. Several experimental studies showed that ECs responded to varying levels of shear stress8,14,18. Olesen et al. found that the cells could sense levels of shear stress as low as 0.2 dyne/cm2 41. Cellular response depends on both the magnitude and direction of shear stress applied to the ECs, suggesting that hemodynamics may play a vital role in valve and vessel formation. In vivo studies focusing on embryonic development of CHD has also provided evidence for hemodynamic regulation of these diseases. Hogers et al. have shown that there are distinct streamlines in chick embryo hearts26. Mechanically interfering with cardiogenesis and disrupting these streams via experimental techniques like ligating the left atria15 or placing a tungsten needle behind the trunco-conal portion of the heart11 resulted in a variety of heart defects including OFT valvular and arterial abnormalities. Vitelline vein ligation altered shear stress responsive gene expression levels in valve forming regions suggesting both genetic and hemodynamic factors regulate heart development in concert21. As evidenced from clinical observations20, altered hemodynamics in OFT is thought to be an important source for CHD. This idea is supported by numerous in vivo studies. Hu et al. showed that left atrial ligation disrupts blood flow in OFT which results in pharyngeal arch abnormalities27. As shown by Yashiro, when Nodal signaling is disrupted by ablating the transcription factor Pitx2, altered hemodynamics caused by a morphological change result in OFT defects60. Therefore quantifying hemodynamics, especially WSS in developing OFT is very critical to complement findings form in vivo studies and clinical observations.
Direct in vivo measurements of local WSS within the small, rapidly moving and contracting chambers of developing embryonic hearts remain challenging. Advanced CFD simulations have been employed to estimate and predict hemodynamic parameters, utilizing in vivo blood characteristics and measurements, anatomically precise geometries and boundary layer conditions. Previous studies utilized magnetic resonance scans, angiocardiograms, and echocardiograms for 3D geometry reconstruction4 in addition to thin reconstruction of histological sections16. Many of these methods are limited to rendering simplified wall geometries and complexity at valve and cushion regions, providing hemodynamic data that may differ from its native state. A more accurate and direct method of measuring hemodynamic induced WSS is using particle image velocimetry (PIV)52. In a study utilizing this method, WSS and blood flow profiles were quantified in early embryonic OFT development, HH1744. However, complexity of hemodynamic flows in later gestation, tortuous geometries, and depth related optical inaccessibility prevents extension of this method to older embryos. The current study extends our previous work in AV canal morphogenesis7 by analyzing high resolution (10 microns) 3D anatomical OFT geometries in embryonic chicks. As the bulk of hemodynamic interest focuses on ventricular ejection, simulations were conducted with static wall geometries. This was supported by the fact that blood velocity for most of the post-ejection flow was near zero. While our simulation methodology iterates the inflow condition to match in vivo measurements, predicted WSS values will be an upper bound because the walls were assumed to be completely rigid as opposed to compliant. As quantitative tools and more detailed understanding of the local embryonic heart tissue mechanics emerge5, 64, future simulations can expand in this regard. In addition, we have recently adapted Micro-CT for quantitative in vivo imaging of chick embryos22, which can address some of these challenging limitations.
Based upon our results for HH16, the blood flow is both unidirectional and laminar, with the left experiencing higher WSS than the right region throughout the cardiac cycle (Figure 5), confirmed by previous studies26. The high degree of differentiation of WSS between both regions may play a role in signaling pathways that include remodeling of the cushions, by shear sensitive myocardium and endocardial cushions; evidenced in the CFD simulations in the higher WSS values in the left region. High WSS values in left side of the heart may help sculpting and thinning of left valves. As shown by Sedmera et al.47, ligating left atria (most likely directs blood flow to right side of the heart) causing right atrioventricular valve to become more fibrous type which may be due to increased WSS and left valve to become more flap like morphology which may be due to decreased WSS. Structure of heart valves is usually abnormal in CHD which may be due to abnormal hemodynamics. In vitro experimentation will have to be done to test the mechanistic link between hemodynamic indices and myocardial and valvular signaling. The progression of cushion expansion at HH23 resulted in an increase in WSS in the inflow and outflow sections for both the distal and proximal ends. The WSS stress distribution was highly symmetrical along the length of the conotruncus, showing little to no stress variation between the right and left segments of the endocardial cushions (Figure 6). In an experiment by Clark et al.10, conotruncal banding (CTB) of chicken embryos produced a deformation in the alignment of the OFT, by increasing aortic-mitral separation and hemodynamic resistance. Based upon our results, this would increase WSS at both the proximal and distal ends at each cushion region. This afterload hemodynamic alteration gives a unique shear stress profile that is hard to predict in vivo and may be causing the mentioned abnormality. Future CFD studies on CTB will help to highlight the mechanisms.
Our results suggest that at HH23, flow streamlines from left and right side of OFT do not mix (Figure 7) but starting at HH27 a divergent mixing and spiraling vortex zones are present (Figure 8, 9A). Vortices are created by the mixing of the blood from the left and right ventricles that are beginning to see the limbs of the aorticopulmonary septum that spirals through the OFT lumen with anticlockwise rotation of the OFT, later separating into the pulmonary and aortic trunks, with the role of cardiac jelly and endocardial cushions arising from this tissue in septation. This helps to sculpt and fuse the distal cushion sections of the OFT that will later become the OFT walls of HH30. Circulating flows were shown to be important in zebrafish cardiogenesis53. Our results extend this finding to higher order chicken cardiogenesis as well.
HH30 also sees spiraling phenomena to some degree, as the initial inflow jet begins to spiral back onto itself however becoming laminar when reaching the mid-cushion regions of the valves (Figure 10A). Unlike HH27, WSS is now significantly less on the ventricular walls (inflow sections) than OFT walls (outflow sections) and similar to earlier stages left OFT experience higher stresses than right OFT (Figure 10B and C). The consistent increase in outflow WSS segments, as well as mixing of streamlines at later stages, occurs alongside the increase in ventricular lumen expansion, which suggest it may help sculpt the outflow lumen and thin valve leaflets11.
In conclusion, this study summarizes quantified important hemodynamic indices within the developing OFT region for chick embryos. Here we identify several previously unrecognized correlations between shear stress and circulatory flows with cardiac morphogenesis which suggest that hemodynamics may be an important stimulator for cardiac development and slight variations in normal hemodynamics may have drastic consequences leading to heart defects. In the future, complimentary in vivo studies that can alter local hemodynamics precisely as well as in vitro studies to investigate cellular response mechanisms should be performed to better understand CHD origination and propagation.
Supplementary Material
Supplemental Video 1: Pathlines animation for one cardiac cycle - Stage HH23. Velocity scale bar unit is m/s
Supplemental Video 2: Pathlines animation for one cardiac cycle - Stage HH27. Velocity scale bar unit is m/s
ACKNOWLEDGEMENTS
This research was supported in part by grants from the American Heart Association (0830384N, to J.T.B), National Institutes of Health (HL110328, to JTB), the Leducq Foundation (JTB), The Hartwell Foundation (JTB), European Union Seventh Framework Marie Curie Actions International Reintegration Program (IRG-276987 to HCY), and Dogus University (BAP-2010_11_D1-07 to HCY). HCY thanks to Prof. Dr. Ahmet Ceranoglu, Mechanical Engineering Department Head at Dogus University for his support of collaborative works with Cornell University.
Abbreviations
- OFT
outflow tract
- EndMT
endocardial-to-mesenchymal transformation
- CHD
congenital heart defects
- CFD
computational fluid dynamics
- Micro-CT
micro-computed tomography
- WSS
wall shear stress
- ECs
endothelial cells
- LVOFT
left ventricular outflow tract
- RVOFT
right ventricular outflow tract
- CTB
conotruncal banding
REFERENCES
- 1.Bajolle F, Zaffran S, Kelly RG, Hadchouel J, Bonnet D, Brown NA, Buckingham ME. Rotation of the myocardial wall of the outflow tract is implicated in the normal positioning of the great arteries. Circ. Res. 2006;98:421–428. doi: 10.1161/01.RES.0000202800.85341.6e. [DOI] [PubMed] [Google Scholar]
- 2.Berenson GS, Srinivasan SR, Bao W, Newman WP, 3rd, Tracy RE, Wattigney WA. Association between multiple cardiovascular risk factors and atherosclerosis in children and young adults. The Bogalusa Heart Study. N. Engl. J. Med. 1998;338:1650–1656. doi: 10.1056/NEJM199806043382302. [DOI] [PubMed] [Google Scholar]
- 3.Birchall D, Zaman A, Hacker J, Davies G, Mendelow D. Analysis of haemodynamic disturbance in the atherosclerotic carotid artery using computational fluid dynamics. Eur. Radiol. 2006;16:1074–1083. doi: 10.1007/s00330-005-0048-6. [DOI] [PubMed] [Google Scholar]
- 4.Bove EL, Migliavacca F, de Leval MR, Balossino R, Pennati G, Lloyd TR, Khambadkone S, Hsia TY, Dubini G. Use of mathematic modeling to compare and predict hemodynamic effects of the modified Blalock-Taussig and right ventricle-pulmonary artery shunts for hypoplastic left heart syndrome. J. Thorac. Cardiovasc. Surg. 2008;136:312.e2–320.e2. doi: 10.1016/j.jtcvs.2007.04.078. [DOI] [PubMed] [Google Scholar]
- 5.Buskohl PR, Gould RA, Butcher JT. Quantification of embryonic atrioventricular valve biomechanics during morphogenesis. J. Biomech. 2011 doi: 10.1016/j.jbiomech.2011.11.032. [DOI] [PMC free article] [PubMed] [Google Scholar]
- 6.Butcher JT, Markwald RR. Valvulogenesis: the moving target. Philos. Trans. R. Soc. Lond. B. Biol. Sci. 2007;362:1489–1503. doi: 10.1098/rstb.2007.2130. [DOI] [PMC free article] [PubMed] [Google Scholar]
- 7.Butcher JT, Sedmera D, Guldberg RE, Markwald RR. Quantitative volumetric analysis of cardiac morphogenesis assessed through micro-computed tomography. Dev. Dyn. 2007;236:802–809. doi: 10.1002/dvdy.20962. [DOI] [PubMed] [Google Scholar]
- 8.Caro CG, Fitz-Gerald JM, Schroter RC. Atheroma and arterial wall shear. Observation, correlation and proposal of a shear dependent mass transfer mechanism for atherogenesis. Proc. R. Soc. Lond. B. Biol. Sci. 1971;177:109–159. doi: 10.1098/rspb.1971.0019. [DOI] [PubMed] [Google Scholar]
- 9.Clark EB, Hu N. Developmental hemodynamic changes in the chick embryo from stage 18 to 27. Circ. Res. 1982;51:810–815. doi: 10.1161/01.res.51.6.810. [DOI] [PubMed] [Google Scholar]
- 10.Clark EB, Hu N, Rosenquist GC. Effect of conotruncal constriction on aortic-mitral valve continuity in the stage 18, 21 and 24 chick embryo. Am. J. Cardiol. 1984;53:324–327. doi: 10.1016/0002-9149(84)90447-8. [DOI] [PubMed] [Google Scholar]
- 11.Colvee E, Hurle JM. Malformations of the semilunar valves produced in chick embryos by mechanical interference with cardiogenesis. An experimental approach to the role of hemodynamics in valvular development. Anat. Embryol. (Berl) 1983;168:59–71. doi: 10.1007/BF00305399. [DOI] [PubMed] [Google Scholar]
- 12.Combs MD, Yutzey KE. Heart valve development: regulatory networks in development and disease. Circ. Res. 2009;105:408–421. doi: 10.1161/CIRCRESAHA.109.201566. [DOI] [PMC free article] [PubMed] [Google Scholar]
- 13.Cruz MD, Markward R, editors. Living Morphogenesis of the Heart. Boston: Birkhäuser; 1998. [Google Scholar]
- 14.Culver JC, Dickinson ME. The effects of hemodynamic force on embryonic development. Microcirculation. 2010;17:164–178. doi: 10.1111/j.1549-8719.2010.00025.x. [DOI] [PMC free article] [PubMed] [Google Scholar]
- 15.deAlmeida A, McQuinn T, Sedmera D. Increased ventricular preload is compensated by myocyte proliferation in normal and hypoplastic fetal chick left ventricle. Circ. Res. 2007;100:1363–1370. doi: 10.1161/01.RES.0000266606.88463.cb. [DOI] [PubMed] [Google Scholar]
- 16.DeGroff CG, Thornburg BL, Pentecost JO, Thornburg KL, Gharib M, Sahn DJ, Baptista A. Flow in the early embryonic human heart: a numerical study. Pediatr. Cardiol. 2003;24:375–380. doi: 10.1007/s00246-002-0343-9. [DOI] [PubMed] [Google Scholar]
- 17.Forouhar AS, Liebling M, Hickerson A, Nasiraei-Moghaddam A, Tsai HJ, Hove JR, Fraser SE, Dickinson ME, Gharib M. The embryonic vertebrate heart tube is a dynamic suction pump. Science. 2006;312:751–753. doi: 10.1126/science.1123775. [DOI] [PubMed] [Google Scholar]
- 18.Fry DL. Acute vascular endothelial changes associated with increased blood velocity gradients. Circ. Res. 1968;22:165–197. doi: 10.1161/01.res.22.2.165. [DOI] [PubMed] [Google Scholar]
- 19.Galindo A, Mendoza A, Arbues J, Graneras A, Escribano D, Nieto O. Conotruncal anomalies in fetal life: accuracy of diagnosis, associated defects and outcome. Eur. J. Obstet. Gynecol. Reprod. Biol. 2009;146:55–60. doi: 10.1016/j.ejogrb.2009.04.032. [DOI] [PubMed] [Google Scholar]
- 20.Gomez-Fifer C. Hypoplastic left heart syndrome in the fetus: Diagnostic features prior to birth and their impact on postnatal outcome. Prog Ped Card. 2006;22:53–60. [Google Scholar]
- 21.Groenendijk BC, Hierck BP, Vrolijk J, Baiker M, Pourquie MJ, Gittenberger-de Groot AC, Poelmann RE. Changes in shear stress-related gene expression after experimentally altered venous return in the chicken embryo. Circ. Res. 2005;96:1291–1298. doi: 10.1161/01.RES.0000171901.40952.0d. [DOI] [PubMed] [Google Scholar]
- 22.Henning AL, Jiang MX, Yalcin HC, Butcher JT. Quantitative three-dimensional imaging of live avian embryonic morphogenesis via micro-computed tomography. Dev. Dyn. 2011;240:1949–1957. doi: 10.1002/dvdy.22694. [DOI] [PMC free article] [PubMed] [Google Scholar]
- 23.Hierck BP, Van der Heiden K, Poelma C, Westerweel J, Poelmann RE. Fluid shear stress and inner curvature remodeling of the embryonic heart. Choosing the right lane! Scientific World Journal. 2008;8:212–222. doi: 10.1100/tsw.2008.42. [DOI] [PMC free article] [PubMed] [Google Scholar]
- 24.Hoffman JI. Incidence of congenital heart disease: II. Prenatal incidence. Pediatr. Cardiol. 1995;16:155–165. doi: 10.1007/BF00794186. [DOI] [PubMed] [Google Scholar]
- 25.Hoffman JI, Kaplan S. The incidence of congenital heart disease. J. Am. Coll. Cardiol. 2002;39:1890–1900. doi: 10.1016/s0735-1097(02)01886-7. [DOI] [PubMed] [Google Scholar]
- 26.Hogers B, DeRuiter MC, Baasten AM, Gittenberger-de Groot AC, Poelmann RE. Intracardiac blood flow patterns related to the yolk sac circulation of the chick embryo. Circ. Res. 1995;76:871–877. doi: 10.1161/01.res.76.5.871. [DOI] [PubMed] [Google Scholar]
- 27.Hu N, Christensen DA, Agrawal AK, Beaumont C, Clark EB, Hawkins JA. Dependence of aortic arch morphogenesis on intracardiac blood flow in the left atrial ligated chick embryo. Anat. Rec. (Hoboken) 2009;292:652–660. doi: 10.1002/ar.20885. [DOI] [PubMed] [Google Scholar]
- 28.Hu N, Clark EB. Hemodynamics of the stage 12 to stage 29 chick embryo. Circ. Res. 1989;65:1665–1670. doi: 10.1161/01.res.65.6.1665. [DOI] [PubMed] [Google Scholar]
- 29.Ilbawi AM, Spicer DE, Bharati S, Cook A, Anderson RH. Morphologic study of the ascending aorta and aortic arch in hypoplastic left hearts: surgical implications. J. Thorac. Cardiovasc. Surg. 2007;134:99–105. doi: 10.1016/j.jtcvs.2007.01.070. [DOI] [PubMed] [Google Scholar]
- 30.Jones EA, Baron MH, Fraser SE, Dickinson ME. Measuring hemodynamic changes during mammalian development. Am. J. Physiol. Heart Circ. Physiol. 2004;287:H1561–H1569. doi: 10.1152/ajpheart.00081.2004. [DOI] [PubMed] [Google Scholar]
- 31.Kim JS, Min J, Recknagel AK, Riccio M, Butcher JT. Quantitative three-dimensional analysis of embryonic chick morphogenesis via microcomputed tomography. Anat. Rec. (Hoboken) 2011;294:1–10. doi: 10.1002/ar.21336. [DOI] [PubMed] [Google Scholar]
- 32.Kirby ML. Molecular embryogenesis of the heart. Pediatr. Dev. Pathol. 2002;5:516–543. doi: 10.1007/s10024-002-0004-2. [DOI] [PubMed] [Google Scholar]
- 33.Lammer EJ, Chak JS, Iovannisci DM, Schultz K, Osoegawa K, Yang W, Carmichael SL, Shaw GM. Chromosomal abnormalities among children born with conotruncal cardiac defects. Birth Defects Res. A. Clin. Mol. Teratol. 2009;85:30–35. doi: 10.1002/bdra.20541. [DOI] [PMC free article] [PubMed] [Google Scholar]
- 34.Lawson ND, Weinstein BM. Arteries and veins: making a difference with zebrafish. Nat. Rev. Genet. 2002;3:674–682. doi: 10.1038/nrg888. [DOI] [PubMed] [Google Scholar]
- 35.le Noble F, Fleury V, Pries A, Corvol P, Eichmann A, Reneman RS. Control of arterial branching morphogenesis in embryogenesis: go with the flow. Cardiovasc. Res. 2005;65:619–628. doi: 10.1016/j.cardiores.2004.09.018. [DOI] [PubMed] [Google Scholar]
- 36.Lenz F, Chaoui R. Changes in pulmonary venous Doppler parameters in fetal cardiac defects. Ultrasound Obstet. Gynecol. 2006;28:63–70. doi: 10.1002/uog.2796. [DOI] [PubMed] [Google Scholar]
- 37.Liu A, Nickerson A, Troyer A, Yin X, Cary R, Thornburg K, Wang R, Rugonyi S. Quantifying blood flow and wall shear stresses in the outflow tract of chick embryonic hearts. Comput. Struct. 2011;89:855–867. doi: 10.1016/j.compstruc.2011.03.003. [DOI] [PMC free article] [PubMed] [Google Scholar]
- 38.Liu A, Rugonyia S, Pentecostb JO, Thornburgb KL. Finite element modeling of blood flow-induced mechanical forces in the outflow tract of chick embryonic hearts. Computers and Structures. 2007;85:727–738. [Google Scholar]
- 39.McQuinn TC, Bratoeva M, Dealmeida A, Remond M, Thompson RP, Sedmera D. High-frequency ultrasonographic imaging of avian cardiovascular development. Dev. Dyn. 2007;236:3503–3513. doi: 10.1002/dvdy.21357. [DOI] [PubMed] [Google Scholar]
- 40.Mjaatvedt CH, Nakaoka T, Moreno-Rodriguez R, Norris RA, Kern MJ, Eisenberg CA, Turner D, Markwald RR. The outflow tract of the heart is recruited from a novel heart-forming field. Dev. Biol. 2001;238:97–109. doi: 10.1006/dbio.2001.0409. [DOI] [PubMed] [Google Scholar]
- 41.Olesen SP, Clapham DE, Davies PF. Haemodynamic shear stress activates a K+ current in vascular endothelial cells. Nature. 1988;331:168–170. doi: 10.1038/331168a0. [DOI] [PubMed] [Google Scholar]
- 42.Oosterbaan AM, Ursem NT, Struijk PC, Bosch JG, van der Steen AF, Steegers EA. Doppler flow velocity waveforms in the embryonic chicken heart at developmental stages corresponding to 5–8 weeks of human gestation. Ultrasound Obstet. Gynecol. 2009;33:638–644. doi: 10.1002/uog.6362. [DOI] [PubMed] [Google Scholar]
- 43.Pierpont ME, Basson CT, Benson DW, Jr, Gelb BD, Giglia TM, Goldmuntz E, McGee G, Sable CA, Srivastava D, Webb CL American Heart Association Congenital Cardiac Defects Committee, Council on Cardiovascular Disease in the Young. Genetic basis for congenital heart defects: current knowledge: a scientific statement from the American Heart Association Congenital Cardiac Defects Committee, Council on Cardiovascular Disease in the Young: endorsed by the American Academy of Pediatrics. Circulation. 2007;115:3015–3038. doi: 10.1161/CIRCULATIONAHA.106.183056. [DOI] [PubMed] [Google Scholar]
- 44.Poelma C, Van der Heiden K, Hierck BP, Poelmann RE, Westerweel J. Measurements of the wall shear stress distribution in the outflow tract of an embryonic chicken heart. J. R. Soc. Interface. 2010;7:91–103. doi: 10.1098/rsif.2009.0063. [DOI] [PMC free article] [PubMed] [Google Scholar]
- 45.Qayyum SR, Webb S, Anderson RH, Verbeek FJ, Brown NA, Richardson MK. Septation and valvar formation in the outflow tract of the embryonic chick heart. Anat. Rec. 2001;264:273–283. doi: 10.1002/ar.1162. [DOI] [PubMed] [Google Scholar]
- 46.Rothenberg F, Fisher SA, Watanabe M. Sculpting the cardiac outflow tract. Birth Defects Res. C. Embryo. Today. 2003;69:38–45. doi: 10.1002/bdrc.10007. [DOI] [PubMed] [Google Scholar]
- 47.Sedmera D, Pexieder T, Rychterova V, Hu N, Clark EB. Remodeling of chick embryonic ventricular myoarchitecture under experimentally changed loading conditions. Anat. Rec. 1999;254:238–252. doi: 10.1002/(SICI)1097-0185(19990201)254:2<238::AID-AR10>3.0.CO;2-V. [DOI] [PubMed] [Google Scholar]
- 48.Sivanandam S, Glickstein JS, Printz BF, Allan LD, Altmann K, Solowiejczyk DE, Simpson L, Perez-Delboy A, Kleinman CS. Prenatal diagnosis of conotruncal malformations: diagnostic accuracy, outcome, chromosomal abnormalities, and extracardiac anomalies. Am. J. Perinatol. 2006;23:241–245. doi: 10.1055/s-2006-939535. [DOI] [PubMed] [Google Scholar]
- 49.Srivastava D, Olson EN. A genetic blueprint for cardiac development. Nature. 2000;407:221–226. doi: 10.1038/35025190. [DOI] [PubMed] [Google Scholar]
- 50.Tanner K, Sabrine N, Wren C. Cardiovascular malformations among preterm infants. Pediatrics. 2005;116:e833–e838. doi: 10.1542/peds.2005-0397. [DOI] [PubMed] [Google Scholar]
- 51.Towbin JA, Belmont J. Molecular determinants of left and right outflow tract obstruction. Am. J. Med. Genet. 2000;97:297–303. doi: 10.1002/1096-8628(200024)97:4<297::aid-ajmg1280>3.0.co;2-o. [DOI] [PubMed] [Google Scholar]
- 52.Vennemann P, Kiger KT, Lindken R, Groenendijk BC, Stekelenburg-de Vos S, ten Hagen TL, Ursem NT, Poelmann RE, Westerweel J, Hierck BP. In vivo micro particle image velocimetry measurements of blood-plasma in the embryonic avian heart. J. Biomech. 2006;39:1191–1200. doi: 10.1016/j.jbiomech.2005.03.015. [DOI] [PubMed] [Google Scholar]
- 53.Vermot J, Forouhar AS, Liebling M, Wu D, Plummer D, Gharib M, Fraser SE. Reversing blood flows act through klf2a to ensure normal valvulogenesis in the developing heart. PLoS Biol. 2009;7 doi: 10.1371/journal.pbio.1000246. e1000246. [DOI] [PMC free article] [PubMed] [Google Scholar]
- 54.Wang Y, Dur O, Patrick MJ, Tinney JP, Tobita K, Keller BB, Pekkan K. Aortic arch morphogenesis and flow modeling in the chick embryo. Ann. Biomed. Eng. 2009;37:1069–1081. doi: 10.1007/s10439-009-9682-5. [DOI] [PubMed] [Google Scholar]
- 55.Weinstein BM, Stemple DL, Driever W, Fishman MC. Gridlock, a localized heritable vascular patterning defect in the zebrafish. Nat. Med. 1995;1:1143–1147. doi: 10.1038/nm1195-1143. [DOI] [PubMed] [Google Scholar]
- 56.Wilcox DC. Basic Fluid Mechanics. La Caftada, California: DCW Industries, Inc.; 1997. [Google Scholar]
- 57.Yalcin HC, Shekhar A, McQuinn TC, Butcher JT. Hemodynamic patterning of the avian atrioventricular valve. Dev. Dyn. 2011;240:23–35. doi: 10.1002/dvdy.22512. [DOI] [PMC free article] [PubMed] [Google Scholar]
- 58.Yalcin HC, Shekhar A, Nishimura N, Rane AA, Schaffer CB, Butcher JT. Two-photon microscopy-guided femtosecond-laser photoablation of avian cardiogenesis: noninvasive creation of localized heart defects. Am. J. Physiol. Heart Circ. Physiol. 2010;299:H1728–H1735. doi: 10.1152/ajpheart.00495.2010. [DOI] [PubMed] [Google Scholar]
- 59.Yalcin HC, Shekhar A, Rane AA, Butcher JT. An ex-ovo chicken embryo culture system suitable for imaging and microsurgery applications. J. Vis. Exp. 2010;(44) doi: 10.3791/2154. pii: 2154. [DOI] [PMC free article] [PubMed] [Google Scholar]
- 60.Yashiro K, Shiratori H, Hamada H. Haemodynamics determined by a genetic programme govern asymmetric development of the aortic arch. Nature. 2007;450:285–288. doi: 10.1038/nature06254. [DOI] [PubMed] [Google Scholar]
- 61.Yelbuz TM, Waldo KL, Zhang X, Zdanowicz M, Parker J, Creazzo TL, Johnson GA, Kirby ML. Myocardial volume and organization are changed by failure of addition of secondary heart field myocardium to the cardiac outflow tract. Dev. Dyn. 2003;228:152–160. doi: 10.1002/dvdy.10364. [DOI] [PubMed] [Google Scholar]
- 62.Yoshida H, Manasek F, Arcilla RA. Intracardiac flow patterns in early embryonic life. A reexamination. Circ. Res. 1983;53:363–371. doi: 10.1161/01.res.53.3.363. [DOI] [PubMed] [Google Scholar]
- 63.Yoshida H, Manasek F, Arcilla RA. Intracardiac flow patterns in early embryonic life. A reexamination. Circ. Res. 1983;53:363–371. doi: 10.1161/01.res.53.3.363. [DOI] [PubMed] [Google Scholar]
- 64.Zamir EA, Srinivasan V, Perucchio R, Taber LA. Mechanical asymmetry in the embryonic chick heart during looping. Ann. Biomed. Eng. 2003;31:1327–1336. doi: 10.1114/1.1623487. [DOI] [PubMed] [Google Scholar]
- 65.Zarins CK, Zatina MA, Giddens DP, Ku DN, Glagov S. Shear stress regulation of artery lumen diameter in experimental atherogenesis. J. Vasc. Surg. 1987;5:413–420. [PubMed] [Google Scholar]
Associated Data
This section collects any data citations, data availability statements, or supplementary materials included in this article.
Supplementary Materials
Supplemental Video 1: Pathlines animation for one cardiac cycle - Stage HH23. Velocity scale bar unit is m/s
Supplemental Video 2: Pathlines animation for one cardiac cycle - Stage HH27. Velocity scale bar unit is m/s


