

Summary
The BioCyc database collection at BioCyc.org integrates genome and cellular network information for more than 500 organisms. This method article describes Web-based tools for browsing metabolic and regulatory networks within BioCyc. These tools allow visualization of complete metabolic and regulatory networks, and allow the user to zoom-in on regions of the network of interest. The user can find objects of interest such as genes and metabolites within the networks, and can selectively examine the connectivity of the network.
The EcoCyc database within the BioCyc collection has been extensively curated. The descriptions within EcoCyc of the Escherichia coli metabolic network and regulatory network were derived from thousands of publications. Other BioCyc databases received moderate levels of curation, or no curation at all. Those databases receiving no curation contain metabolic networks that were computationally inferred from the annotated genome sequences of each organism.
Keywords: Regulatory Network, Metabolic Network, Cellular Network, Web Interface, Highlighting, Regulatory Subnetwork, Browsing, Genome Database, Metabolic Database
1 Introduction
Network visualization tools are among the most powerful known mechanisms for allowing scientists to rapidly comprehend the complexities of biological networks. Here we explain the usage of a set of Web-based tools for the visualization and interrogation of both metabolic and regulatory networks. These tools are in use both for the BioCyc [1] collection of Pathway/Genome Databases (PGDBs) available from SRI International at BioCyc.org,1 and for a growing number of other PGDBs available around the Web for organisms such as mouse and yeast, and for many plants and bacteria. A summary of those additional PGDBs is available at [2].
Several considerations shaped the design of our network visualization tools. (1) Because of the large number of databases to which the tools are applied, and because of the fact that multiple visualizations of the same network at different magnification levels are desired, the visualizations must be produced by fast automatic layout algorithms as opposed to by manual positioning of elements within the diagram by the database authors. (2) Because regulatory and metabolic networks are very different biologically, and because biologists have in the past developed different visual conventions for how elements of such networks are drawn, we have chosen to develop different visualizations for these two types of networks. This approach is in contrast to approaches such as Cytoscape that use a single visual network style for all types of networks [3]. (3) Because these networks are large, complex, and highly connected, our tools do not initially show all connections within these networks. When all connections are shown, the resulting diagrams tend to be visually incomprehensible. Instead our approach is to allow the user to selectively add connections of interest to the diagram.
All BioCyc PGDBs contain metabolic network information because of the existence of predictive tools for metabolic networks [4]. However, no inference tools for regulatory networks are available for PGDBs, therefore regulatory network information must be defined through manual curation. To date, the only curated regulatory network available in BioCyc is that for EcoCyc [5]. However, additional regulatory-network curation projects are in progress and may be available soon. In addition, note that although Pathway Tools supports curation of many types of regulatory information, the regulatory network viewer (the Regulatory Overview) described here currently shows only the network of regulatory interactions resulting from regulation of transcription initiation. We plan to extend the Regulatory Overview to include other regulatory relationships in the future. Currently, other types of individual regulatory interactions, including substrate-level regulation of enzyme activity, regulation by small RNAs, and attenuation, are shown on gene pages and transcription unit pages within Pathway Tools based Web sites.
This article does not provide a complete description of how to use the BioCyc Web site. We focus here on the metabolic and regulatory network visualization tools, in part because these tools are quite new, and in part because they are among the more complex aspects of the Web site. The BioCyc Web site provides additional documentation on its usage under the Help item in the menu bar, and through Web tutorials [6]. The Pathway Tools software that powers the BioCyc Web site and Web sites for other PGDBs was described previously at [4].
Frequent users of BioCyc often install BioCyc PGDBs and the associated Pathway Tools software locally on their own computer [7] because local usage provides faster response and additional functionality not present in the Web version. A comparison of the Web and desktop modes of Pathway Tools is available at [8].
1.1 Design of the Regulatory Overview
A simple approach to analyze the transcriptional regulatory relationships between genes of a specific organism is to display these relationships using a network, that is, a graph where nodes represent genes and arcs represent the relationships from regulators to regulatees. We call the complete regulatory network visualization generated by our tools the Regulatory Overview.
One of the main issue in displaying a Regulatory Overview of an organism is the limited size of a computer window. For E. coli, around 2300 genes are involved in the Regulatory Overview because they are either transcriptional regulators or they are regulated by a transcriptional regulator according to EcoCyc. Compact layouts must be used to be able to fit this number of genes on a typical monitor size and still provide readability and structure. In particular, we have maintained the constraint that gene icons should not overlap.
We have used the following approach to make the Regulatory Overview more compact, and to add a new level of biological organization to the diagram. We partitioned the non-regulator genes into groups, such that two genes are in the same group if they are regulated by the same set of genes. Note that genes within a group may respond in different ways to these regulators — some positively and some negatively. Each group of non-regulatory genes is layed out compactly in a leaf shape with a short stem which gives the group a triangular look. Then the groups are spread around on a ellipse as wide and as high as the user's computer window would allow it. The remaining genes, the regulators, are layed out as ellipse too, inside this larger ellipse. We have chosen to use two such inner ellipses. The result can be seen for E. coli in Figure 1. This is the `nested ellipses' layout.
Figure 1.

The entire Regulatory Overview for E. coli after selecting the command Tools→Regulatory Overview. In this case, zoom level 2 was automatically selected as the best zoom level given the size of the browser window. The names of the genes are displayed for the inner-most ellipse, but not for the other two ellipses as not enough space is available for the names. This display uses the `nested ellipses' layout. The outer most ellipse has all the genes that do not regulate any gene but are regulated by at least one gene. Genes that are regulated by the same set of genes are grouped together, forming a leaf shape. The two inner ellipses contains the regulator genes. The inner-most ellipse has the genes that regulate the largest numbers of genes. They are displayed in ascending alphabetical order starting from the right side. This layout is not based on the locations of the genes on the genome. Each circle, square, minus, or plus icon represents a gene. A square represents a sigma factor, a plus represents a gene for which all its regulators are activators, a minus represents a gene for which all its regulators are inhibitors, and a circle represents a gene that has activators and inhibitors. No regulation relationships are shown in the diagram below. Relationship arrows can be added with the searching and highlighting operations.
We use a second layout, called `top to bottom', that in some cases is better at representing a regulatory network compared to the nested ellipses. An example, for the complete regulatory network of E. coli, is shown in Figure 2. It is actually more compact than the nested ellipses layout due to the very small size of the icons used for the bottom row representing the non-regulator genes.
Figure 2.

The entire Regulatory Overview of E. coli using the `top to bottom' layout. The gene name appears near an icon if space is available. No regulatory relationships are shown, that is, no arrows are displayed. This is the most compact overview available. The genes on the same row do not directly regulate each other. The bottom row has all the genes that do not regulate any gene but are regulated by at least one gene (this row corresponds to the outer most ellipse of the `nested ellipses' layout). The top row has the regulators that regulate the largest number of genes.
Since displaying all, or even most, relationships within the network would greatly clutter the display, our approach is to let the user select the genes for which relationships should be shown. Therefore, when first displayed, the Regulatory Overview does not show any regulatory relationships.
1.1.1 Study case 1: Displaying a Regulatory Subnetwork
It is likely that an analysis is done on a subset of the genes of an organism and not the complete regulatory network. A natural approach to select this subset is to first display the entire regulatory network then let the user select a subset of genes, using various search and highlighting commands. Then redisplay the regulatory network based only on the selected genes. In this case a subnetwork is displayed. Subsection 3.6.1 presents a concrete example to display such a subnetwork. It is based on Method 3 of Subsection 3.6 that introduces the various search and highlighting commands for the Regulatory Overview.
1.2 Design of the Cellular Overview
The Cellular Overview depicts the biochemical machinery of an organism as described in a database. Whereas the Regulatory Overview shows genes and the regulatory relationships between them, the Cellular Overview shows metabolites and the reactions, enzymes and pathways that interconvert them.
At low zoom level, the shapes of the metabolic icons represent different compound classes. The different shapes used are as follows:
Triangle: Amino Acids
Square: Carbohydrates and Derivatives
Diamond: Proteins and Modified Proteins
Vertical Ellipse: Purines
Horizontal Ellipse: Pyrimidines
T: tRNAs
Circle: All other compounds
Filled shape: Phosphorylated compound
At low zoom levels, each icon in the overview (such as the small circles or triangles) represents a single metabolite, and each blue connecting line represents a single bioreaction. Reactions are organized into pathways. Because some metabolites participate in multiple reactions, and some reactions belong to multiple pathways, a single metabolite or reaction may appear in multiple places in the diagram.
At higher zoom levels, the icons are replaced by the corresponding metabolite names, and more detailed information such as enzyme and pathway names appear in the diagram. Figure 3 shows the entire Cellular Overview diagram for E. coli at a low zoom level, and Figure 4 shows a section of the same diagram at a high zoom level. Users can pan the Cellular Overview to see different portions of it, but unlike the Regulatory Overview, the Cellular Overview does not support display of customized subnetworks (although the user can visit the detail page for each individual pathway).
Figure 3.

The Cellular Overview of E. coli right after selecting the command Tools→Cellular Overview. The zoom ladder is at level 1, the lowest level, so that we can see all the metabolic pathways. At this zoom level, not enough space is available to display the names of compounds, enzymes, and pathways.
Figure 4.

The Cellular Overview of E. coli at zoom level 7. Notice that the blue marker on the zoom ladder, on the left side of the Web page, is at step 7. The compound, enzyme, and pathway names are displayed at this zoom level. Due to the size of the entire overview, only a small portion can be seen at any one time. The user can scroll the overview to the left, right, down, or up, by holding the left mouse button and move the mouse in the direction you want the overview to move. This operation is called `panning'.
Pathways are grouped together into related clusters, such as all pathways involved in cofactor biosynthesis, or all pathways involved in amino acid degradation. Connections between pathways are not shown. In general, energy metabolism pathways, such as glycolysis and the TCA cycle, appear near the middle of the diagram, with anabolic pathways to the left and catabolic pathways to the right. The existence of anaplerotic pathways prevents rigid classification, however. If present, signal transduction pathways run along the bottom of the diagram. At the far right lies a collection of individual reactions that have not been assigned to any pathway.
Surrounding the diagram is a border representing the cellular membranes of the organism. For organisms that have both a plasma membrane and a periplasmic membrane, such as Gram-negative bacteria, a double border is shown. Transport reactions are shown crossing the appropriate membrane(s), and reactions that take place in the periplasm or extracellular region are drawn between or outside the membranes. In addition, icons for proteins that have not been annotated as enzymes but which have been curated with a location on the membrane or in the periplasmic or extracellular regions will be displayed in the appropriate location.
1.2.1 Study case 2: highlighting metabolic pathways based on genes
The Cellular Overview provides searching and highlighting of reactions, compounds, and pathways. Searching based on gene names is also provided but in this case a mapping is applied from genes to different metabolic objects. This study will demonstrate how to search and highlight based on gene names using the basic commands and a file containing gene names. This study is done in Subsection 3.7.2.
2 Material
2.1 Software
The network visualization tools for BioCyc and other Pathway Tools powered Web sites do not require any special software other than a Web browser such as Firefox, Safari, or Chrome. The network visualization tools are implemented in the commonly available JavaScript language running in such browsers. The Internet Explorer (IE) browser (versions 6 to 8) may exhibit a slow response due to its slower JavaScript engine, therefore we do not recommend use of IE when using the Regulatory and Cellular Overviews.
2.2 File formats
For the Cellular Overview, it is possible to highlight reactions, enzymes, and pathways based on a set of gene names listed in a file. Each line of the file must contain at most one gene name and the file must be a text file based on 8-bit ASCII encoding. Any gene name that cannot be recognized within the currently selected organism will be ignored. Subsection 3.7.2 shows a method to highlight pathways and enzymes using such a file.
3 Methods
The methods we will describe share some common operations to both overviews that are covered first. These are called “Procedure”. Procedure 1 is the common way to start a method. Procedures 2 and 3 are independent and applied to display a Regulatory Overview or the Cellular Overview. After the procedure descriptions, we present methods to browse, search, highlight, and create a regulatory subnetwork.
3.1 Procedure 1: Getting Started with Network Browsing
Access the Web site biocyc.org using a Web browser (See Note 1). We recommend Firefox, Safari, or Chrome. Internet Explorer works too, but it is slower than the other three browsers.
Select the organism whose networks you wish to browse using the “change” link located on the right side of the Web page. See Figure 5 for the location of the change link.
Make the main window of your browser as wide and as high as possible. The overviews are best viewed on large computer monitors.
Figure 5.

Near the top-right corner of BioCyc.org Web pages, the link labeled “change” allows the user to select a specific organism database. As of December 2009, more than 500 databases are available.
At this point you can either browse the Regulatory Overview (if available for the selected organism) or the Cellular Overview.
3.2 Procedure 2: Displaying a Regulatory Overview
Apply “Procedure 1” from Subsection 3.1.
Select the command Tools→Regulatory Overview to display the Regulatory Overview of the currently selected organism. If the selected organism has a Regulatory Overview the command is selectable otherwise it is grayed out and it cannot be selected. Currently, in December 2009, only E. coli K–12 substr. MG1655 has a Regulatory Overview. When the Regulatory Overview is displayed, it will be as wide and as high as the browser window will allow it.
The common browsing operations described in Subsection 3.4 are available at this point.
3.3 Procedure 3: Displaying a Cellular Overview
Apply “Procedure 1” from Subsection 3.1.
Select the command Tools→Cellular Overview to display the Cellular Overview of the currently selected organism. The lowest zoom level is automatically chosen and a complete Cellular Overview should be displayed. (See Figure 3 for an example using E. coli)
The common browsing operations described in Subsection 3.4 are available at this point.
3.4 Method 1: Browsing an Overview
Once an overview is displayed, the user can navigate through the network by zooming in or out, moving it, navigating to Web pages describing the objects of the overview. In this subsection we review the basic common operations to browse the Regulatory or Cellular Overview.
Open a Regulatory or Cellular Overview as described in Subsection 3.2 or 3.3.
Zoom-in or zoom-out the overview by using the zoom ladder on the left of the overview. (See Figure 6). This can be done in three ways: clicking the minus or plus icon, sliding the blue marker, or clicking a ladder step to go directly to a zoom level. Depending on the zoom level, more details are displayed such as gene names, for the Regulatory Overview (see Figure 7), or enzyme, compound, and pathway names, for the Cellular Overview (see Figure 4). Double-left-clicking in a blank area of the overview does also a zoom-in operation.
- You can interrogate and navigate the overviews using the following operations.
- Mousing over an icon reveals a tooltip window describing succinctly the object represented by the icon.
- Left-clicking on a icon such as a gene opens a new browser window (or tab, depending on your set of preferences in your browser) with information about the object represented by the icon. The resulting information page might describe a gene (Regulatory Overview), a pathway, a reaction, a compound, or an enzyme (Cellular Overview).
- Holding the left-button and moving the mouse left/right/up/down allows to pan the overview left, right, up, or down. You need to hold down the mouse button while moving the mouse to do the panning. You can also pan the overview by clicking the appropriate arrow above the zoom ladder shown in Figure 6.
- The menu bar commands Cellular Overview→Show Legend will display a legend explaining the meaning of the icons used in the cellular overview (Regulatory Overview→Show Legend performs the analogous operation) These commands are also available by right-clicking in a blank area of the window.
- Commands Cellular Overview→Help and Regulatory Overview→Help will open a new window (depending on your browser setting) containing a full documentation of how to use the overviews (also available from the right-click menu).
Figure 6.

The zoom ladder. This particular representation shows the zoom ladder at its lowest level. The current zoom level is identified by the blue marker. It is right above the minus icon near the bottom. To change the zoom level, you can either click the plus or minus icon, slide the blue marker along the ladder, or directly click on a ladder step. Above the zoom ladder are four directional buttons to pan right/left/down/up the entire overview. Panning can also be done by holding the left mouse button directly on the overview and moving it in the desired direction.
Figure 7.

A zoom-in to the last zoom level of E. coli and towards the outer most ellipse.
Next we focus on how to display a regulatory subnetwork using the searching and highlighting commands. The next section will review the searching and highlighting commands for the Cellular Overview.
3.5 Method 2: Searching and Highlighting within the Regulatory Overview
This method describes how to find genes of interest within the Regulatory Overview, and how to add regulatory relationships to the diagram.
Searching always entails highlighting since once the genes are found, they are highlighted. Searching might also involve adding relationship arrows between the genes found. This is user selectable for all searching.
Searching (and highlighting) based on a particular gene, entails, in most cases, adding relationship arrows. This type of search is done by right-clicking on a gene icon. Adding the relationships is actually the main intended purpose of the commands selectable from right-clicking on a gene icon.
In the following, we show the typical steps to seach, highlight and add relationship arrows in a Regulatory Overview.
Open a Regulatory Overview as described in Subsection 3.2.
- Apply a series of search and highlighting commands. For each highlighting command, one color is used to highlight the gene icons and, if any, the relationship arrows but a new color is used for each executed command. Two sets of commands are available, one set by right-clicking on a gene; the second set from the menu bar (or by right-clicking in a blank area of the overview). We first present the list of commands from the menu bar or right-click in a blank area.
- Regulatory Overview→Highlight Gene By Name or Frame ID highlights at most one gene. It is essentially a search command since you might not know the location of that gene in the regulatory network. Every object of each database at BioCyc.org has a unique identifier, called a “frame id”. You can see this frame id in the URL when visiting the Web page describing this object. So, a search based on a frame id is very precise.
- Regulatory Overview→Highlight Genes By Substring might highlight several genes. Selecting the command opens a panel by which you can enter a string of characters. Click the button labeled `Highlight' in the panel, the genes highlighted have a name that contains the given string (this is a case-insensitive search). The option Include Relationships Arrows Between the Genes Found adds relationship arrows between the highlighted genes.
- Regulatory Overview→Highlight Genes By Gene Ontology Terms enables you to select one or more Gene Ontology (GO) terms. The genes that produce proteins annotated with the selected GO terms will be highlighted. The option Include Relationships Arrows Between the Genes Found adds relationship arrows between the highlighted genes. (See Note 2)
Right-clicking on a gene will open a menu of highlighting commands specific to that gene. The menu may contain from one to seven commands. Since some genes do not have any regulators or/and any regulatees, this list of commands may vary from gene to gene. Here are the list of all possible commands available from this menu where name will be the gene name (e.g., trpA) on which the right-clicking was done. (See Figure 8)
Figure 8.

The right-clicking menu on a gene. This particular menu opened when the mouse was right-clicked on gene exuR. Since this gene has regulators and regulatees, all highlighting commands are provided. The user can select one command which would highlight the gene icon and the corresponding regulator and/or regulatee icons as well as displaying arrows to show the direction of regulation between them.
Highlight Gene name highlights only the selected gene.
Highlight Gene name and its Direct Regulatees highlights the selected gene and all its direct regulatees are highlighted and relationship arrows are displayed from the selected gene to its regulatees.
Highlight Gene name and its Direct Regulators highlights the selected gene and all its direct regulators are highlighted and relationship arrows are displayed from the regulator genes to the selected gene.
Highlight Gene name and its Direct Regulatees and Regulators combines the two previous commands.
Highlight Gene name and its Direct and Indirect Regulatees highlights the selected gene and all its direct regulatees and indirect regulatees are highlighted and relationship arrows are displayed from regulators to regulatees.
Highlight Gene name and its Direct and Indirect Regulators highlights the selected gene and all its direct regulators and indirect regulators are highlighted and relationship arrows are displayed from regulators to regulatees.
Highlight Gene name and its Direct and Indirect Regulatees and Regulators combines the two previous commands.
Finally, commands Cellular Overview→Clear All Highlighting and Regulatory Overview→Clear All Highlighting will clear all highlighted items in each overview (also available from the right-click menu). The e ects of these commands cannot be undone.
3.6 Method 3: Displaying a Regulatory Subnetwork
The Regulatory Overview enables you to display your own regulatory subnetwork of genes from the regulatory data. You cannot change the regulatory data, but you can select a subset of genes to display. The selection of the genes can be done in many different ways through highlighting and searching operations as described in Subsection 3.5.
Apply a series of searching and highlighting commands as describe in Subsection 3.5.
If during the previous highligthing operations you highlighted a set of genes you do not want to see part of your subnetwork, you can deactivate this set by using the switch panel on the right of the Web page (See Figure 9). You can easily activate or deactivate several sets of highlighted genes by ticking or unticking the square boxes.
Once you have the right sets of highlighted genes active, select the command Regulatory Overview→Redisplay Highlighted Genes Only (also accessible from right-clicking in a blank area of the overview). The server will generate a new regulatory network for this set of genes. All highlighting will remain active.
You can always redisplay the entire overview by selecting the command Regulatory Overview→Display Complete Regulatory Overview, reactivate some highlighting or add more highlighted genes, then use the Redisplay Highlighted Genes Only command again. In this manner you can iterate this method until you have a satisfactory subnetwork corresponding to the set of genes to analyze.
Figure 9.
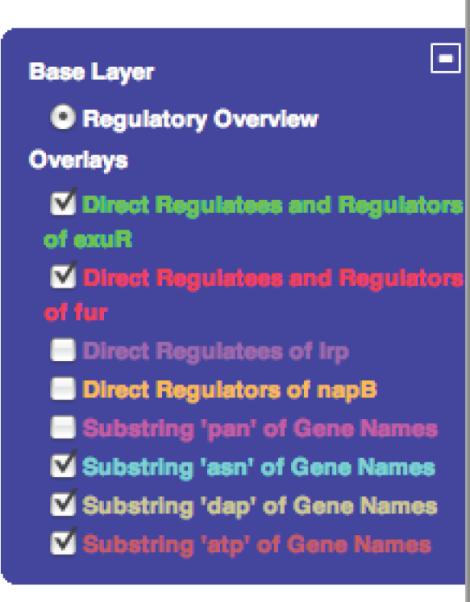
This is a particular switch panel after highlighting several groups of genes in the Regulatory Overview. Each entry under `Overlays' can be activated or deactivated by ticking the corresponding white square. A tick mark indicates that the overlay is active. When an overlay is not active, all its genes are not highlighted and do not participate in the command “Redisplay Highlighted Genes Only”. An inactive overlay is not destroyed and can be activated again by simply reticking the square box. To remove all overlays, use the command Clear All Highlighting available under the menu bar Regulatory Overview or from right-clicking in a blank area of the overview. Removing all highlighting (i.e., overlays) cannot be undone. To close the panel, click the minus icon (a plus icon will replace the panel), to (re)open it, click the plus icon.
3.6.1 Study case 1: Displaying a Regulatory Subnetwork
We will show a specific example of displaying a regulatory subnetwork based on specific sets of genes for E. coli. The result will be the subnetwork shown in Figure 10.
Figure 10.

The regulatory subnetwork resulting from the method of Section 3.6.
Apply “Procedure 2” from Subsection 3.2 and select the organism database Escherichia coli K-12 substr. MG1655 when doing the second step of “Procedure 1”.
The following three commands are accessible from the menu bar and by right-clicking in a blank area of the overview. You can try right-clicking in a blank area now and you should get the menu as shown on the left of Figure 11.
Apply a substring search using the command Regulatory Overview→Highlight Genes By Substring and using the substring `rpo'. (This will highlight several sigma factors.)
Apply the search command Regulatory Overview→Highlight Genes By Gene Ontology Terms twice, one for GO term GO:0008289 (lipid binding) and one for GO term GO:0043167 (ion binding). Both of these GO terms are under category molecular function, subcategory binding. When searching by a GO term, it is usually more precise to select it by ticking its corresponding white square box on its left. You will probably need to expand the GO tree hierarchy to the desired term by clicking the plus icons. Note that clicking a GO term text in the GO tree do not select it, but rather, opens a Web page describing the term. (See Figure 12)
Apply the command Regulatory Overview→Redisplay Highlighted Genes Only. This will display a subnetwork based on the highlighted genes. At this point you do not have any regulatory relationships shown. The layout used is now `top to bottom' and no longer `nested ellipses'.
Using the switch panel, on the right of the Web page as shown in Figure 9, deactivate all the overlays by unticking each white square box. This will remove all highlighting of the gene nodes but without removing the overlays. We will add regulatory relationships using the following commands by right-clicking on specific genes.
Right click on genes modE and cueR and apply the command Highlight Gene name and its Direct Regulatees to each gene. You might need to zoom-in if you do not see the gene names modE or cueR. Use the zoom ladder to do so, or double-click in a blank area of the overview.
Right click on gene fur and apply the command Highlight fur Direct Regulatees and Regulators.
Apply the command Highlight rpoH Direct Regulators. You need to right-click on gene rpoH to access this command.
You should now have the subnetwork as shown in Figure 10.
Figure 11.
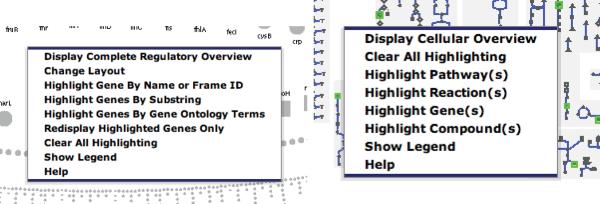
The general Regulatory Overview menu command on the left and the general Cellular Overview menu command on the right when right-clicking in a blank area of the overview. The commands are the same as the ones provided from the menu bar under “Regulatory Overview” and “Cellular Overview”, respectively.
Figure 12.
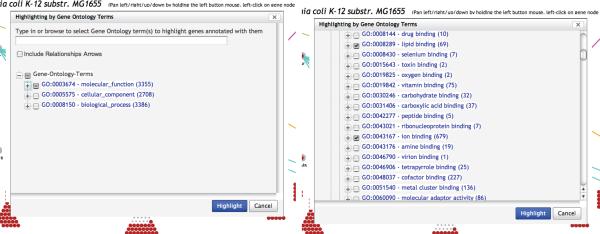
The ontology dialog for highlighting based on Gene Ontology terms. On the left, the dialog as it opens up from the command Highlight Genes By Gene Ontology Terms, on the right, after clicking two plus icons to expand the subcategory binding of category molecular fonction.
3.7 Method 4: Searching and Highlighting in the Cellular Overview
The Cellular Overview includes a variety of commands for searching and highlighting the multiple types of objects that the overview contains, including searching for pathways, reactions, compounds, genes, and proteins. Note that gene searches result in highlighting of reactions and proteins within the Cellular Overview because genes do not have their own graphical icons within this diagram.
As for the Regulatory Overview, the switch panel (see Figure 9), is used to show the highlighting operations that were done. Each highlighting operation creates a new overlay with its own color. The name of each overlay is based on the operation done. You can activate or deactivate an overlay by ticking or unticking, respectively, its corresponding white square box. Deactivating an overlay simply remove the corresponding highlighting in the overview. It does not remove the overlay since you can reactivate it. An individual overlay cannot be deleted. All overlays can be deleted at once by using the command Clear All Highlighting available under the menu bar “Cellular Overview” or by righ-clicking in the overview.
3.7.1 Highlighting in the Cellular Overview from Basic Commands
There are four major commands to search and highlight objects in the Cellular Overview. They are accessible from the menu bar and by right-clicking on the Cellular Overview (see right of Figure 11). These commands are
Cellular Overview→Highlight Pathway(s)
Cellular Overview→Highlight Reaction(s)
Cellular Overview→Highlight Gene(s)
Cellular Overview→Highlight Compound(s)
They all have the same two subcommands, namely By Name or Frame ID and By Substring. The command Highlight Gene(s), has a third subcommand, namely From File. This special subcommand will be covered in the next subsection.
The highlighting-by-name searches perform exact matching on the name that the user enters, such as the gene name “trpA”. The search is not case-sensitive. Every object of each database at BioCyc.org has a unique identifier, called a “frame id”. This identifier is shown in the URL when displaying the object page.
A By Substring search allows searching based on partial object names. It is not case-sensitive. Such a search might result in many objects being highlighted. For example, searching for “degradation” for pathways will usually result in several pathways being highlighted.
The highlighting based on gene names is special. The genes found, either by the subcommands By Name or Frame ID or By Substring, are mapped to enzymes and reactions. A gene is mapped to its product (according to its database data) and reactions catalyzed by these products. These products and reactions are highlighted. This is so, since no gene icons are shown in the Cellular Overview.
For example, here are the steps to highlight all compounds with the substring “hydro” for the organism Mycobacterium tuberculosis H37Rv.
Apply “Procedure 3” in Subsection 3.3 and select the organism database Mycobacterium tuberculosis H37Rv when doing the second step of “Procedure 1”.
By right-clicking in the Cellular Overview the menu as seen on the left of Figure 11 is shown.
Mouse over the command Highlight Compound(s). A submenu will open with the subcommands By Name or Frame ID and By Substring. Select the subcommand By Substring. A small dialog window opens up where you can enter a substring.
Enter the substring “hydro” in the text box of the dialog. Click the button “Highlight”. The dialog will disapear and all the compounds found will be highlighted with a specific color. See Figure 13 for the final result.
Figure 13.

The Cellular Overview of Mycobacterium tuberculosis H37Rv after highlighting all compounds that have `hydro' in their name.
3.7.2 Study case 2: highlighting metabolic pathways based on genes
Create a file of gene names. This can be done by simply typing the names of the genes (or their database identifiers) in a file using your favorite file editor. There must be one gene name per line. Choose a meaningful file name so that it is easy to remember. You must save the file on your computer for later access. (See Note 3).
Apply “Procedure 3” from Subsection 3.1. The organism, selected in the second step of “Procedure 1”, must be related to the gene names of your file.
Display a Cellular Overview as described in Subsection 3.3.
Select the command Highlight Genes→From File by right-clicking in a blank area. Type the name of your file (with a directory path) or use the browse button to find it on your local disk. Click the “Highlight” button. The file is transfered to the server who extracts the gene names and finds the enzymes and reactions associated with the gene names. Then, the reactions and enzymes found are highlighted.
4 Notes
You can access some specific databases by using different URLs. For example, EcoCyc is also available at ecocyc.org.
If you are displaying a subnetwork, instead of the complete regulatory network, the search for genes apply to the subnetwork. Therefore, it is possible that a message is displayed stating that no genes are found with the selected GO terms although some genes exist in the organism with the selected GO terms.
The gene names will be verified by the server once the file is uploaded. If it turns out that a gene name cannot be found, that gene will be ignored, but processing will proceed for the other gene names and highlighting will be done for all gene names that were found. Also note that the file cannot be a binary file but a text file based on 8-bit ASCII encoding. Most spreadsheet or word processing program such as Microsoft Word do not, by default, generate non-text file. You need to explicitly save your file as “text file” when using such program.
Acknowledgements
This work was supported by grant GM75742 from the National Institutes of Health. The contents of this article are solely the responsibility of the authors and do not necessarily represent the official views of the National Institutes of Health.
Footnotes
Some of the functionality described in this chapter is quite new and is not yet available at the public BioCyc.org server, but the reviewer can access a new experimental server at kaffir.ai.sri.com:1555.
References
- 1.Caspi R, Altman T, Dale J, Dreher K, Fulcher C, Gilham F, Kaipa P, Karthikeyan A, Kothari A, Krummenacker M, Latendresse M, Mueller L, Paley S, Popescu L, Pujar A, Shearer A, Zhang P, Karp P. The MetaCyc database of metabolic pathways and enzymes and the BioCyc collection of Pathway/Genome Databases. Nuc Acids Res. 2010;38 doi: 10.1093/nar/gkp875. Advanced access doi: 10.1093/nar/gkp875. [DOI] [PMC free article] [PubMed] [Google Scholar]
- 2.BioCyc Database Collection. http://BioCyc.org/otherpgdbs.shtml.
- 3.Shannon P, Markiel A, Ozier O, Baliga NS, Wang JT, Ramage D, Amin N, Schwikowski B, Ideker T. Cytoscape: A software environment for integrated models of biomolecular interaction networks. Genome Res. 2003;13(11):2498–2504. doi: 10.1101/gr.1239303. [DOI] [PMC free article] [PubMed] [Google Scholar]
- 4.Karp P, Paley S, Krummenacker M, Latendresse M, Dale J, Lee T, Kaipa P, Gilham F, Spaulding A, Popescu L, Altman T, Paulsen I, Keseler I, Caspi R. Pathway Tools version 13.0: Integrated Software for Pathway/Genome Informatics and Systems Biology. Briefings in Bioinformatics. 2009 doi: 10.1093/bib/bbp043. [[ http://bib.oxfordjournals.org/cgi/content/abstract/bbp043]]. [Doi: 10.1093/bib/bbp043] [DOI] [PMC free article] [PubMed] [Google Scholar]
- 5.Keseler I, Bonavides-Martinez C, Collado-Vides J, Gama-Castro S, Gunsalus R, Johnson DA, Krummenacker M, Nolan L, Paley S, Paulsen I, Peralta-Gil M, Santos-Zavaleta A, Shearer A, Karp P. EcoCyc: A comprehensive view of E. coli biology. Nuc Acids Res. 2009;37:D464–70. doi: 10.1093/nar/gkn751. [DOI] [PMC free article] [PubMed] [Google Scholar]
- 6.BioCyc Webinars. http://biocyc.org/webinar.shtml.
- 7.BioCyc Downloads. http://biocyc.org/download.shtml.
- 8.Comparison of BioCyc Desktop Mode and Web Mode. http://biocyc.org/desktop-vs-web-mode.shtml.