Abstract
G protein-Coupled Receptors (GPCRs) use a complex series of intramolecular conformational changes to couple agonist binding to the binding and activation of cognate heterotrimeric G protein (Gαβγ). The mechanisms underlying this long-range activation have been identified using a variety of biochemical and structural approaches and have primarily used visual signal transduction via the GPCR rhodopsin and cognate heterotrimeric G protein transducin (Gt) as a model system. In this chapter, we will review the methods that have revealed allosteric signaling through rhodopsin and transducin. These methods can be applied to a variety of GPCR-mediated signaling pathways.
Keywords: G protein coupled receptor, Heterotrimeric G proteins, Rhodopsin, Transducin, Receptor-mediated nucleotide exchange
1. Introduction
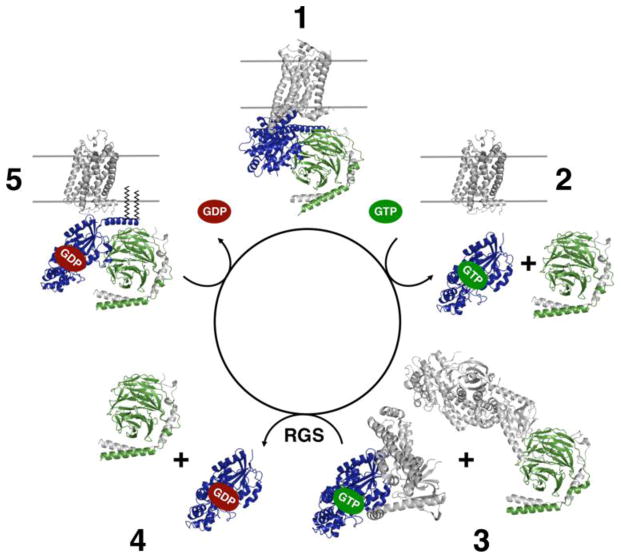
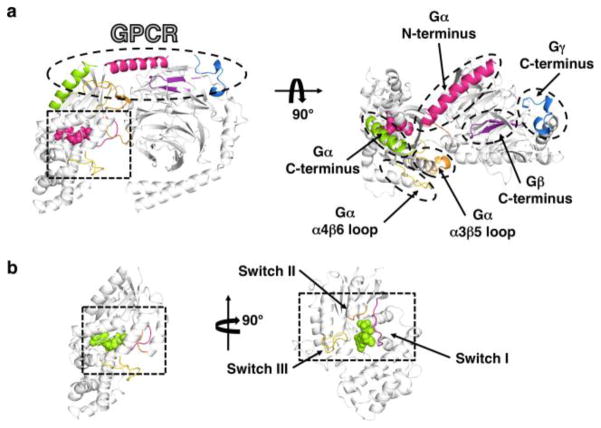
GPCRs regulate physical processes ranging from vision to olfaction to cardiac contractility to neurotransmission, yet these receptors likely act via a conserved signaling cycle (Figure 1). In this cycle, the activation states of GPCRs and cognate G proteins are encoded into protein conformations that influence the binding of partner signaling molecules. For example, agonist binding to a GPCR induces a conformational change that forms a binding site for heterotrimeric G proteins 25 Å away (Figure 2) (1, 2). The high affinity GPCR-G protein complex promotes exchange of GDP for GTP in the guanine nucleotide-binding pocket of the of the G protein α subunit (Gα) another 30 Å away from the proposed receptor-binding site (3, 4). The identity of the bound nucleotide then influences the formation of an effector-binding site, yet another 10 Å from bound GTP (Figure 3) (5–7). The activation steps in this complex series have been investigated by a number of complementary methods.
Figure 1. Summary of the G Protein Signaling Cycle.
GPCRs signal through soluble G proteins. In State 1, activated receptor binds to the GDP-bound heterotrimeric G protein and promotes release of GDP from the Gα subunit. Binding of GTP to the Gα subunit results in dissociation of this high-affinity complex into GTP-bound Gα, and Gβγ (State 2), each of which are now able to bind to downstream effectors (State 3) and elicit downstream responses. The Gα subunit has intrinsic GTPase activity which is enhanced by Regulators of G protein Signaling (RGS). Following hydrolysis of GTP, GDP-bound Gα subunits reassociate with Gβγ subunits (State 4) and traffic to the membrane, where they can interact with receptors in the next signaling cycle (State 5).
Figure 2. Differences in Conformation Changes Between Rhodopsin and Opsin.
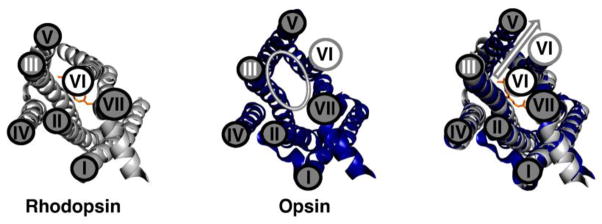
Left panel: Rhodopsin (PDBID 1U19; (54)) is shown in gray. Middle panel: Opsin (PDBID 3DQB; (1)) is shown in blue. Right panel: An overlay of the structures of rhodopsin and opsin highlights the differences in these structures. These two structures have a 7Å shift in the position of helix VI (arrow) that allows opsin to bind the C-terminus of Gαt in an intracellular binding pocket (1). The conformation of opsin is similar to the conformation proposed for rhodopsin upon light activation.
Figure 3. The binding regions of G proteins.
Heterotrimeric G proteins are composed of 3 subunits: the nucleotide-binding Gα and the dimeric Gβγ subunits. a) In the heterotrimer (PDBID 1GOT; (5)), the receptor-binding surface (oval) is composed of the N-terminus, C-terminus, α4β6 loop, α3β5 loop of the Gα subunit and the C-termini of the Gβ and Gγ subunits. The switch regions on the Gα subunit (box) are in conformations that do not bind to effectors. b) Interactions with activated receptors catalyzes nucleotide exchange in the guanine nucleotide binding site of the Gα subunit (PDBID 1TAD; (16)), and the heterotrimer disassociates into GTP-bound Gα and Gβγ The binding of GTP changes the conformation of the switch regions (box) and the disassociation of the complex leaves this surface unobstructed, allowing Switch II and the surrounding region to interact with effectors.
1.1 Introduction to Allostery in Receptor Activation
Each GPCR has incredible fidelity to a small set of cognate ligands that act as agonists, antagonists, or inverse agonists to promote different activation states (8). Despite this diversity, GPCRs all share a common architecture comprising seven transmembrane helices (9, 10), and several conserved sequence motifs believed to be critical for regulation of receptor activation (11–15). As a result, many of the general mechanisms of activation are assumed to be shared amongst all GPCRs.
The best-characterized GPCR, rhodopsin, is responsible for perception of light under low light conditions. Numerous properties of this photoreceptor have made it amenable to characterization by both in vivo and in vitro methods. Rhodopsin is naturally abundant (16), easily purified, stable in a variety of detergents, and has spectroscopic properties that provide a convenient method to monitor activation. In addition, rhodopsin covalently ligates an inverse agonist, 11-cis-retinal, that locks it into an inactive conformation, which decreases the conformational heterogeneity. Accordingly, rhodopsin was the first GPCR to be characterized by x-ray crystallography (17), and eight years elapsed before the structure of other GPCRs (18–22) verified the conserved arrangement of transmembrane helices in the family.
Cryoelectron microscopy (10, 23), site-directed spin labeling, and electron paramagnetic resonance spectroscopy (SDSL-EPR) (24, 25) suggested that large conformational changes accompany rhodopsin activation, the most dramatic of which is the rigid body movement of helix VI away from helix III (Figure 3). This helix movement has long been hypothesized to be required for the formation of a G protein-binding site, and the recent crystal structures of opsin (2) and opsin in complex with a high affinity peptide mimicking the C-αt subunit (1) confirmed this hypothesis.
1.2 Introduction to Allostery in Heterotrimeric G Proteins
Heterotrimeric G proteins comprise Gα, Gβ, and Gγ (26). Upon activation by GPCRs, heterotrimeric G proteins disassociate into GTP-bound Gα, and Gβγ, both of which can interact with effector proteins to regulate downstream signaling (Figure 1) (27). In humans, there are currently 18 known G α subtypes belonging to 4 subfamilies, 5 Gβ isoforms, and 12 Gγ isoforms. Each has differing binding specificities for both effectors and GPCRs (28).
Gα and Gβ γ can act on a diverse variety of effectors, but like their cognate GPCRs, their mechanisms of activation and deactivation are likely conserved throughout the family. Numerous x-ray crystal structures have revealed how the binding of GDP, GDP-AlF4− or GTP γS to the G α subunit influences the conformations of three nearby surface loops known as switches I–III ( 4, 6, 29). These switch regions form a contiguous surface for effector binding (Figure 3b) (30).
While rhodopsin is by far the most extensively characterized GPCR, its cognate G protein Gt does not heterologously express to levels sufficient for biochemical characterization, which limits techniques that require mutagenesis. However, the large quantities of endogenously expressed transducin in bovine retina has allowed the native protein to be studied and crystallized. For techniques requiring mutagenesis, the close homolog of the Gαt subunit, Gαi (with 67% identity and 82% similarity to Gαt) is frequently used to understand general mechanisms of heterotrimeric G protein activation (31–34). Gαi can be activated by rhodopsin, is easily expressed in bacteria, and can be reconstituted with Gβγ to form a fully functional chimeric system (4–6).
1.3 Introduction to Receptor-catalyzed Nucleotide Exchange
The rate-limiting step in GPCR signaling is receptor-catalyzed GDP release from the Gα subunit of the heterotrimer. A combination of site-directed mutagenesis (36–39), peptide-mapping (3, 40–43), and chemical crosslinking (42–45) demonstrated that the α4–β6 loop, α3–β5 loop, N-terminus, and C-terminus of the Gα subunit as well as the C-termini of the G β G γ subunits are implicated in binding to rhodopsin. While these motifs are distantly arranged in the primary sequence, they form a contiguous surface on the folded protein (Figure 3a) (46, 47).
The α5 helix, located at the C-terminus of the Gα subunit, is perhaps the best-studied region of receptor interaction and independently binds within a pocket on activated receptor (1). Multiple studies have suggested that receptor induced rotation and translation of the α5 helix is a requirement for GDP release from Gα (26), and movement of the α5 helix dipole may be important for weakening the interactions between the bound nucleotide and Gα (43).
Much less is understood about how receptor interactions with the Gβγ subunits contribute to G protein activation. Until recently, two major hypotheses existed: the gearshift model (50) and the lever-arm model (51). Mutagenesis was used to support both hypotheses. The gearshift model proposes that the Gβ subunit rotates into the GTP-binding domain of the Gα subunit and pushes the helical domain away from the bound nucleotide. In comparison, the lever-arm model proposes that nucleotide exchange is catalyzed by induced tilt of the Gβγ subunits, which act as a lever to open the binding pocket through interactions with switch II. New insights into the mechanism of G protein activation were revealed by two recent crystal structures of activated β2 adrenergic receptor (β2AR). The first structure was that of the activated form of the receptor stabilized by llama antibodies termed nanobodies (52). The second structure was that of the activated receptor stabilized by its physiologically-relevant signaling partner, the Gαsβγ heterotrimer (Gs) (53). Both structures exhibited conformational changes in transmembrane helices 5 and 6. The β2AR-Gs structure additionally confirmed the stabilizing effects of G αβγ association on the agonist-bound state of the receptor and the presence of a translation of the a5 helix of Gα. Unanticipated observations revealed by the β2AR-Gs structure include ordering of intracellular loop 2 on β2AR, a lack of extensive contacts between the receptor and the Gβγ subunits of Gαsβγ, and a large displacement of the helical domain relative to the Ras-like GTPase domain of Gαs. These data, taken together, offer a possible mechanism for receptor-catalyzed GDP release from Gαβγ that is largely consistent with the models suggested by biochemical and structural data obtained thus far.
2. Materials
2.1. Dark-adapted Rod Outer Segment (ROS) membrane isolation
200 Bovine retinas (see Note 1).
Isolation Buffer: 90 mM KCl, 30 mM NaCl, 2 mM MgCl2, 10 mM 3-(N-morpholino)propanesulfonic acid (MOPS), 0.1 mM ethylenediaminetetraacetic acid (EDTA), pH 8.0.
26% Sucrose Solution: Isolation Buffer containing 26% w/v sucrose, 1 mM dithiothreitol and 50 μM phenylmethylsulfonyl fluoride (PMSF) (see Notes 2, 3).
30% Sucrose Solution: Isolation Buffer containing 30% w/v sucrose, 1 mM DTT, and 50 μM PMSF
Gradient Solution 1: 0.84 M sucrose, 10 mM MOPS, 60 mM KCl, 30 mM NaCl, and 2 mM MgCl2.
Gradient Solution 2: 1.0 M sucrose, 10 mM MOPS, 60 mM KCl, 30 mM NaCl, and 2 mM MgCl2.
Gradient Solution 3: 1.14 M sucrose, 10 mM MOPS, 60 mM KCl, 30 mM NaCl, and 2 mM MgCl2.
10 mg/mL aprotinin.
10 mg/mL leupeptin.
2.5 mg/mL pepstatin.
2.2 Rhodopsin-Gt separation: ROS membrane urea wash
Dark-adapted ROS membranes isolated from retinas.
EDTA Buffer: 10 mM Tris(hydroxymethyl)aminomethane (Tris-Cl) (see Note 4), 1 mM ethylenediaminetetraacetic acid (EDTA), 1 mM DTT, pH 7.5 (see Note 2).
Urea Buffer: 10 mM Tris-Cl, 1 mM EDTA, 1 mM DTT, 6 M urea, pH 7.5.
Buffer A: 10 mM MOPS pH 7.5, 2 mM MgCl2, 200 mM NaCl, 1 mM DTT, 0.1 mM PMSF.
2.3 Rhodopsin extraction from native membranes
2.4 Purification of detergent extracted rhodopsin by ConA affinity chromatography
ConA Sepharose column (GE Healthcare).
ConA Binding Buffer: 20 mM Tris-Cl pH 7.4, 250 mM NaCl, 1 mM MgCl2, 1 mM CaCl2, 1 mM MnCl2 (see note 4).
Wash Buffer 1: ConA Binding Buffer containing 0.5 mM ANAGRADE DDM (Anatrace) (see notes 5 and 6).
Wash Buffer 2: 20 mM Tris-Cl pH 7.4, 100 mM NaCl, 0.5 mM ANAGRADE DDM (Anatrace), pH 7.4.
Elution Buffer 1: 20 mM Tris-Cl pH 7.4, 100 mM NaCl, 0.5 mM ANAGRADE DDM (Anatrace)400 mM α-D methylglucoside (Acros Organics), pH 7.4.
Elution Buffer 2: 20 mM Tris-Cl pH 7.4, 100 mM NaCl, 0.5 mM ANAGRADE DDM (Anatrace), 500 mM sucrose, pH 7.4.
Extra Meta II Exchange Buffer: 50 mM HEPES pH 8.0, 100 mM NaCl, 1 mM MgCl2, 0.5 mM DDM.
2.5 Determining the concentration of rhodopsin
Rhodopsin in native membranes or purified into detergent micelles.
20 mM hexadecyl-cetyltrimethylammonium chloride (HTAC) buffer (Sigma Aldrich).
2.6 Metarhodopsin II (meta II) assay
10 μM purified rhodopsin.
10 μM purified transducin.
Meta II Buffer: 50 mM HEPES pH 8.0, 100 mM NaCl, 1 mM MgCl2, 1 mM DTT (see Note 2).
2.7 Crystallization of rhodopsin
Pre-greased 24-well Linbro plates (Hampton Research).
Siliconized Glass or Plastic cover slips (Hampton Research) (see Note 7).
Refrigerant-based propelled compressed air cleaner, such as Dust-off.
2.8 Light-adapted ROS membrane isolation
200 Bovine retinas (see Note 1).
Isolation Buffer: 90 mM KCl, 30 mM NaCl, 2 mM MgCl2, 10 mM MOPS, 0.1 mM EDTA, pH 8.0.
26% Sucrose Solution: Isolation Buffer containing 26% w/v sucrose, 1 mM dithiothreitol (DTT), and 50 μM phenylmethylsulfonyl fluoride (PMSF) (see Notes 2 and 3).
30% Sucrose Solution: Isolation Buffer containing 30% w/v sucrose, 1 mM DTT, and 50 μM PMSF.
Gradient Solution 1: 0.84 M sucrose, 10 mM MOPS, 60 mM KCl, 30 mM NaCl, and 2 mM MgCl2.
Gradient Solution 2: 1.0 M sucrose, 10 mM MOPS, 60 mM KCl, 30 mM NaCl, and 2 mM MgCl2.
Gradient Solution 3: 1.14 M sucrose, 10 mM MOPS, 60 mM KCl, 30 mM NaCl, and 2 mM MgCl2.
10 mg/mL aprotinin.
10 mg/mL leupeptin.
2.5 mg/mL pepstatin.
2.9 Isolation and purification of Gt
Isotonic Buffer: 5 mM Tris-Cl, 130 mM KCl, 0.6 mM MgCl2, 1 mM EDTA, 5mM βME or 1 mM DTT, 0.1 mM PMSF, pH 8.0 (see Notes 2–4).
Hypotonic Buffer: 5 mM Tris-Cl, 0.6 mM MgCl2, 1 mM EDTA, 5mM βME or 1 mM DTT, 0.1 mM PMSF, pH 8.0.
Hypotonic buffer + GTP: Hypotonic Buffer containing 0.1 mM guanosine-5′-triphosphate (GTP) (see Note 8).
2.10 Expression of Gαi1
2X YT (Yeast-Tryptone) Media: 1.6% w/v Bacto-tryptone, 10% w/v Bacto-yeast extract, 0.5% w/v NaCl, autoclaved.
100 mg/mL ampicillin, filter sterilized (see Note 9).
Isopropyl-β-D-thiogalactopyranoside (IPTG), 1.0 M in distilled water, filter sterilized.
2.11 Purification of Gαi1
Lysis Plus Buffer: 50mM NaH2PO4, 300 mM NaCl, 5 mM β-mercaptoethanol (βME), 5mM imidazole pH 8.0. Add 5 mM βME or 1 mM DTT, 20 μM GDP, 0.1 mM PMSF, 10 μg/mL aprotinin, 10 μg/mL leupeptin, and 2.5 10 μg/mL pepstatin (see Notes 2 and 3).
Loading Buffer: 50 mM NaH2PO4, 300 mM NaCl, 5 mM βME or 1 mM DTT, pH 8.0.
Wash Buffer: 50 mM NaH2PO4, 300 mM NaCl, 5 mM βME or 1 mM DTT, 10 mM imidazole, pH 8.0.
Elution Buffer: 50 mM NaH2PO4, 300 mM NaCl, 5 mM βME or 1 mM DTT, 100 mM imidazole, pH 8.0.
Dialysis Buffer: 50 mM Tris-Cl pH 8.0, 50 mM NaCl, 1 mM MgCl2, 10% (v/v) glycerol (see Note 4). Add 0.1 mM PMSF, 5 mM βME or 1 mM DTT, and 20 μM GDP right before buffer is used.
Buffer A: 50 mM Tris-Cl pH 8.0, 50 mM NaCl, 2 mM MgCl2, 5mM βME or 1 mM DTT.
Buffer B: 50 mM Tris-Cl pH 8.0, 1 M NaCl, 2 mM MgCl2, 5mM βME or 1 mM DTT.
Storage Buffer: 50 mM Tris-Cl pH 8.0, 50 mM NaCl, 2 mM MgCl2, 5 mM βME or 1 mM DTT, 10 μM GDP
Collection Buffer: 50 mM Tris-Cl pH 8.0, 50 mM NaCl, 2 mM MgCl2, 5 mM βME or 1 mM DTT 100 μM GDP
Gαi Buffer: 50 mM Tris-Cl pH 8.0, 200 mM NaCl, 2 mM MgCl2, 1 mM EDTA pH 8.0, 1 mM DTT, 20 μM GDP.
TALON or Nickel NTA Resin (Clontech).
SOURCE™ 15Q Anion Exchange resin (GE Healthcare).
Superdex 200 GL 10/300 Gel Filtration Column (GE Healthcare).
2.12 Intrinsic tryptophan fluorescence assay
2.13 Determining the concentration of Gt or Gαi1
Quick Start™ Bradford Protein Assay Kit containing 1X dye reagent and seven BSA standards ranging in concentration from 0.125 – 2.0 mg/mL (BIORAD).
1:10 and 1:50 dilutions of purified Gt or Gαi1 sample.
1 mL quartz cuvettes.
2.14 Crystallization of Gt or Gαi1
Pre-greased 24-well Linbro plates (Hampton Research).
Siliconized Glass or Plastic cover slips (Hampton Research) (see Note 7).
Refrigerant-based propelled compressed air cleaner, such as Dust-off.
2.15 Chemical Crosslinking of Rhodopsin-Gt
2.16 In vitro Rho-Gt complex formation
2.17 Receptor-catalyzed GTPγS exchange assay
200 nM purified Gt
100 nM purified rhodopsin.
Gt Activation Buffer: 10 mM MOPS, 130 mM NaCl, 1mM MgCl2, pH 7.2.
10 μM GTPγS.
3. Methods
Large quantities of pure protein are essential for studying biophysical properties of GPCRs and heterotrimeric G proteins. Therefore, the identification of mechanisms of GPCR signaling has been facilitated by reproducible methods for obtaining and purifying rhodopsin, transducin, and Gαi. Spectroscopic monitoring is commonly used to follow the activation state in these proteins, while x-ray crystal structures have provided snapshots of stable signaling intermediates.
3.1 Dark-adapted Rod Outer Segment (ROS) membrane isolation
All steps are to be performed under dim red light and on ice or at 4°C.
Thaw bovine retinas from 200 bovine eyes on ice and decant into a 600 mL beaker. Wash the containers with 30% Sucrose Solution, pool the wash with the thawed retinas, and bring the final volume to 200 mL with 30% Sucrose Solution.
Stir the retina slurry for 1 hour at 4°C to separate the outer segments from the rod cell inner segments and basolateral membrane.
Evenly distribute approximately 30 mL of the retina slurry into eight Oak Ridge centrifuge tubes and balance with 30% Sucrose Solution. Cap and invert the tubes 2–3 times to evenly mix the solution. Centrifuge for 20 minutes at 4°C in a Sorvall SS-34 rotor at 4,000 rpm (or 2,000 rcf(max) in a similar rotor).
Carefully pour the supernatant into a beaker placed on ice and set aside (see Notes 12 and 17). Resuspend each pellet with a small volume of 30% Sucrose Solution. Evenly distribute the resuspended pellet into four clean Oak Ridge centrifuge tubes. Rinse the old centrifuge tubes with a small volume of 30% Sucrose Solution. Evenly distribute this wash solution into each of the new centrifuge tubes and balance with 30% Sucrose Solution. Cap and invert the tubes 2–3 times to evenly mix the solution. Centrifuge at 4°C for 4 minutes in a Sorvall SS-34 rotor at 6,000 rpm (or 4,300 rcf(max) in a similar rotor).
Carefully pool the supernatant with the supernatant from the previous round of centrifugation. The pellet may now be discarded. Evenly distribute the pooled supernatant into four, clean Oak Ridge centrifuge tubes and balance with Isolation Buffer. Cap and invert the tubes 2–3 times to evenly mix the solution. Centrifuge for 20 minutes at 4°C in a Sorvall SS-34 rotor at 19,000 rpm (or 43,000 rcf(max) in a similar rotor).
Discard the supernatant and resuspend the pellets with 1 mL of 26% Sucrose Solution for every two pellets. Pool the resuspended pellet slurry in a clean beaker placed on ice. Wash the centrifuge tubes with 1 mL of 26% Sucrose Solution for every two tubes. Pool the wash solution with the resuspended pellet slurry.
Prepare a sucrose gradient by layering each of the Sucrose Gradient Solutions (1–3) in six 36 mL Sorvall AH629 swinging bucket centrifuge tubes (or similar). To prepare this gradient, first use a large needle or pipette to carefully layer 7 mL of Sucrose Solution 1 on the bottom of each centrifuge tube. Next, using the same pipette, layer 7 mL of Solution 2 by inserting the pipette tip through Solution 1 and touching the bottom of the centrifuge tube below Solution 1. Dispensing Solution 2 will cause Solution 1 to rise. Finally, pipette 7 mL of Solution 3 below Solution 2 using the same technique. Dispensing Solution 3 will cause Solutions 1 and 2 to rise. The final order of the sucrose solutions is Sucrose Solution 3 on the bottom, Sucrose Solution 2 in the middle, and Sucrose Solution 1 on top (see Note 13).
Carefully layer the pellet slurry on top of each of each tube, balance with 26% Sucrose Solution, and centrifuge at 4°C for 30 minutes in a Sorvall AH-629 swinging bucket rotor at 25,000 rpm (or a similar rotor at 112,000 rcf(max)).
Once the spin is complete, there will be a gradient of different colored layers in each of the centrifuge tubes. The bottom layer will be somewhat translucent, the next layer will be opaque, and the top layer will, again, be translucent. The orange layer in the center is the ROS membrane layer. Carefully discard the upper layer using a pipette and collect the opaque layer in the middle (see Note 14).
Pool the ROS membrane layers, evenly distribute into clean Oak Ridge centrifuge tubes and balance with Isolation Buffer. Cap and invert the tubes 2–3 times to evenly mix the solution. Centrifuge for 20 minutes at 4 °C in a Sorvall SS-34 rotor at 19,000 rpm (or 43,000 rcf(max) in a similar rotor) to pellet the ROS membranes. During this centrifugation step, prepare 15 mL of Isolation Buffer containing 5 μg/mL pepstatin, 10 μg/mL aprotinin, and 10 μg/mL leupeptin.
Discard the supernatant and resuspend each pellet with 1 mL of freshly prepared Isolation buffer containing 2.5 μg/mL pepstatin, 10 μg/mL aprotinin, and 10 μg/mL leupeptin Thoroughly homogenize the resuspended ROS membranes by pipetting up and down. Pool the ROS membranes in a 15 mL conical tube placed on ice.
Wash the empty centrifuge tubes with enough of the remaining freshly prepared Isolation Buffer so that the final volume of ROS membranes does not exceed 15 mL. Dark-adapted ROS membranes can be stored in tubes wrapped in aluminum foil at −80°C for long-term storage.
3.2 Rhodopsin-transducin separation: dark-adapted ROS membrane urea wash
All steps are to be performed under dim red light and on ice or at 4°C.
Thaw dark-adapted ROS membranes on ice and transfer to a 40 mL glass homogenizer. Fill the homogenizer with EDTA Buffer and homogenize ROS membranes (see Note 15). Pour the homogenate into ultracentrifuge tubes and balance with EDTA buffer (see Note 16). Cap and invert the tubes 2–3 times to evenly mix the solution. Centrifuge for 30 minutes in a Ti-70 rotor at 30,000 rpm or 92,000 rcf (max) in a similar rotor.
Discard the supernatant. Resuspend each pellet with 1 mL EDTA Buffer, and transfer to a glass homogenizer. Rinse the tubes with a small volume of EDTA Buffer, pool with the resuspended pellets in the homogenizer, fill the homogenizer with EDTA Buffer, and homogenize (see Note 17). Evenly distribute the homogenate to new ultracentrifuge tubes and balance with EDTA Buffer. Cap and invert the tubes 2–3 times to evenly mix the solution. Centrifuge for 30 minutes in a Ti-70 rotor at 30,000 rpm (or 92,000 rcf (max) in a similar rotor).
Discard the supernatant and resuspend each pellet with 1 mL of Urea Buffer. Transfer the pellet resuspension to a glass homogenizer. Rinse the tubes with a small volume of Urea Buffer, pool with the resuspended pellets, fill the homogenizer with Urea Buffer, and homogenize. Evenly distribute the homogenate to clean ultracentrifuge tubes and balance with Urea Buffer. Cap and invert the tubes 2–3 times to evenly mix the solution. To pellet the membranes, centrifuge for 30 minutes in a Ti-70 rotor at 45,000 rpm (or 208,000 rcf (max) in a similar rotor).
Discard the supernatant and resuspend the pellets with Buffer A (see Note 17). Transfer the pellet resuspension to a glass homogenizer. Rinse the tubes with a small volume of Buffer A, pool with the resuspended pellets, fill the homogenizer with Buffer A, and homogenize. Evenly distribute the homogenate to clean ultracentrifuge tubes and balance with Buffer A. Cap and invert each tube 2–3 times to evenly mix the solution. Centrifuge for 30 minutes in a Ti-70 rotor at 30,000 rpm (or 92,000 rcf (max) in a similar rotor).
Discard the supernatant and resuspend each pellet with 1 mL of Buffer A by pipetting up and down with a pipette in the centrifuge tubes. Prepare 100 μL aliquots of the urea-washed, dark-adapted ROS membranes in 650 μL tubes, wrap in foil, and store at −80°C.
3.3 Rhodopsin extraction from native membranes
All steps are to be performed under dim red light and on ice or at 4°C.
Thaw 3–4 aliquots of urea washed, dark-adapted ROS membranes on ice and pool in a 1.5 mL tube. Use 400 μL of ConA Binding Buffer wash each tube and pool with the thawed membranes (see Note 18).
Centrifuge the membranes for 25 minutes at 4°C at top speed (20,000 RCF(max)) in a benchtop Eppendorf Centrifuge.
Discard the supernatant and resuspend the pellet with 400 μL Rhodopsin Solubilization Buffer (see Note 19) by pipetting up and down until the resuspension is no longer cloudy. Incubate the resuspended pellet on ice for 45 minutes. Mix the sample by pipetting every 15 minutes during the incubation.
After 45 minutes, centrifuge the sample for 25 minutes at 4°C at top speed (20,000 RCF(max)) in a benchtop Eppendorf Centrifuge.
Collect the supernatant (~500 μL) with a pipette and discard the pellet.
3.4 Purification of detergent extracted rhodopsin by ConA affinity chromatography
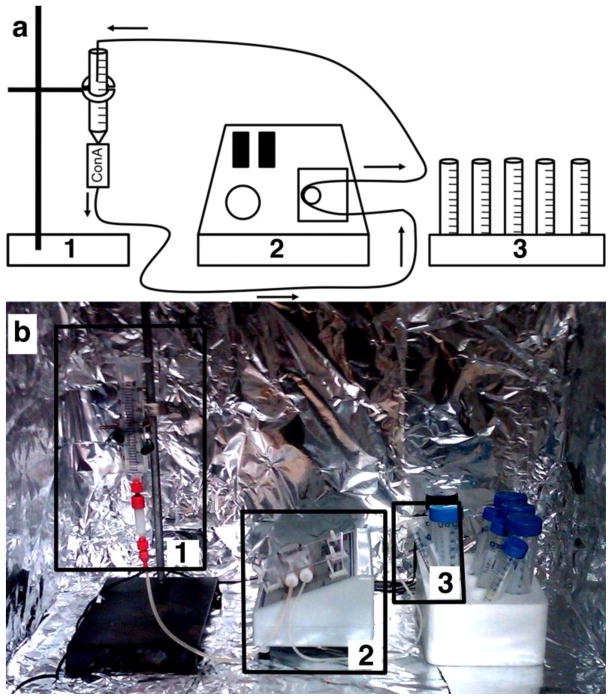
Assemble a light-protected “ConA Purification Hutch” in a 4°C environment to protect the purification apparatus from light. Place a clamp stand for the ConA Sepharose column, a peristaltic pump, and a tube rack inside of the hutch (see Figure 4).
Attach a 30 mL syringe to the top of a 1 mL ConA column for holding buffers (see Note 20). Load 10 mL of Wash Buffer 1 to wash off the ethanol-containing storage buffer in which the column is packed. Equilibrate the column in 30 mL of Wash Buffer 1 in a continuous loop using a peristaltic pump flowing at 0.3 mL/min for at least 48 hours (see Note 21).
Dilute ~500 μL of detergent-extracted rhodopsin (see Subheading 4) to a total volume of 10 mL with ConA Binding Buffer (see Note 22). When the volume of Wash Buffer 1 in the syringe is ≤ mL, load the rhodopsin fraction. Flow the rhodopsin load fraction in a continuous loop over the column using a peristaltic pump flowing at 0.3 mL/min for 4 hours (see Note 23).
Collect the flowthrough and all subsequent fractions for later analysis of the purification by SDS-PAGE (see Figure 5 for expected results). When the volume of loaded protein in the syringe is ≤ mL, load 10 mL of Wash Buffer 1 and collect the flowthrough as Wash 1.
When the volume of loaded Wash Buffer 1 in the syringe is ≤ mL, load 5 mL of Wash Buffer 2 and collect the flowthrough as Wash 2.
When the volume of loaded Wash Buffer 2 in the syringe is ≤ mL, load 50 mL of Elution Buffer 1 and collect the flowthrough as Elution 1. This fraction contains ConA purified rhodopsin.
When the volume of loaded Elution Buffer 1 in the syringe is ≤ mL, load 5 mL of Elution Buffer 2 and collect the flowthrough as Elution 2. This fraction should also contain ConA purified rhodopsin and can be pooled with Elution 1.
Concentrate the pooled Elution fractions in a 30 kDa molecular weight cutoff Amicon concentrator wrapped in aluminum foil. Centrifuge the concentrator in a benchtop centrifuge at 4°C at 1,600 rcf(max) in 20 minute intervals until the total volume is ~2 mL (see Note 24).
Using the same concentrator, buffer exchange the concentrated, ConA purified rhodopsin by diluting to 50 mL in Extra Meta II Exchange Buffer and serial centrifugation at 4°C and 1,600 rcf(max) in 20 minute intervals. Concentrate the sample to a volume of ~200–500 μL and measure the concentration using the rhodopsin concentration assay (see Subheading 5).
Figure 4. ConA Purification Hutch.
a) A schematic showing the contents of a ConA purification hutch. b) A simple cardboard box lined with aluminum foil and sealable flaps is sufficient for creating a dark-adapted environment for ConA purification of rhodopsin. Box 1 highlights the 1 mL ConA Sepharose Column (GE Healthcare) attached to a 30 mL syringe. Both are held to a ring stand with a standard clamp. Box 2 shows the peristaltic pump with two leads, one of which remains connected to the bottom end of the ConA Sepharose Column. Depending on the requirement of the protocol, the second lead can either rest in a collection tube (Box 3) or can be secured in place inside of the syringe (Box 1) for flowing solutions over the column in a continuous loop (i.e., while loading the column with rhodopsin or while pre-equilibrating the column with detergent).
Figure 5. ConA Purification Fractions Analyzed by SDS-PAGE.
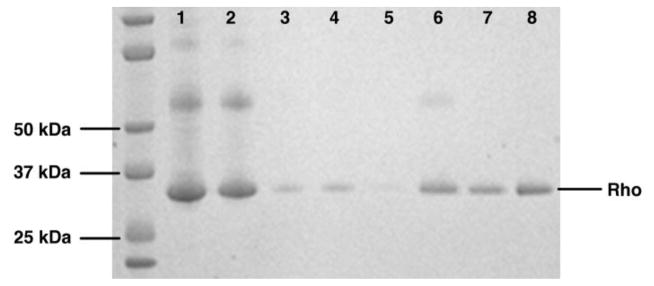
Fractions from a ConA purification of dark-adapted rhodopsin are shown on a 10–12% gradient polyacrylamide gel (Invitrogen). Lanes 1 and 2: Load Fraction, Lane 3: Flow Through, Lane 4: Wash 1, Lane 5: Wash 2, Lane 6: Elution 1, Lane 7: Elution 2, Lane 8: pooled Elution 1 and 2. Rhodopsin runs at an apparent molecular weight of ~34 kDa.
3.5 Determining the concentration of rhodopsin
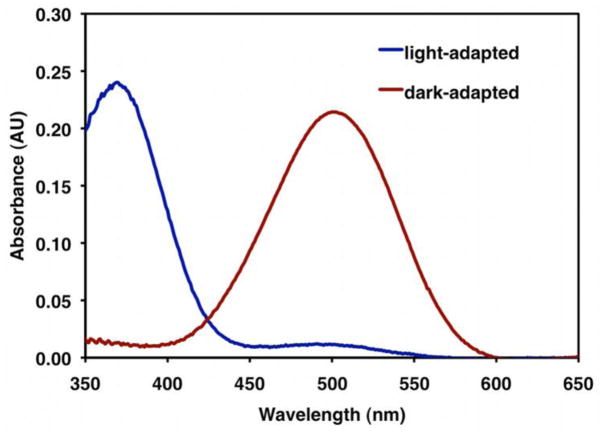
The concentration of solubilized rhodopsin is determined by measuring its absorbance at 500 nm and 650 nm both before and after photobleaching in the presence of 20 mM fluorescence enhancing detergent, HTAC.
Record an absorption spectrum from 350–650 nm for 96 μL of 20 mM HTAC buffer added to an appropriate cuvette. Use this measurement to establish a baseline.
Add 4 μL of a dark-adapted rhodopsin sample to 96 μL of HTAC buffer in the cuvette and mix thoroughly by pipetting up and down. Record a second absorption spectrum from 350–650 nm for the dark-adapted sample.
Photobleach the rhodopsin-containing sample in the cuvette by pulsing with a burst of light from a camera flash, such as a Vivitar 283. Thoroughly mix the sample by pipetting up and down in the cuvette, being careful to avoid generating air bubbles, and pulse the sample with light a second time (see Notes 25 and 27). Mix the sample again and record a third spectrum from 350–650 nm for the light-adapted sample.
- Calculate the difference in the absorbance between 650 nm and 500 nm for both the dark-adapted and light-adapted readings using Equation 1:
- Calculate the difference in this value between dark-adapted and light-adapted rhodopsin using Equation 2:
-
Use this value to then calculate the concentration with ‚Beer’s Law (Equation 3):
where A corresponds to the absorbance value, ε corresponds to the molar extinction coefficient for rhodopsin, b corresponds to the path length (in cm), and C corresponds to concentration (in units of molarity (mol/L)). The molar extinction coefficient is 42,000 M−1cm−1 for rhodopsin in ROS membranes and 40,600 M−1cm−1 for detergent-extracted rhodopsin. Use the latter value to determine the concentration of purified rhodopsin (see Note 26).
See Figure 6 for expected results.
Figure 6. Solubilized Rhodopsin Absorption Spectrum.
The dark-adapted spectrum is shown in red while the light-adapted spectrum is shown in blue. The concentration of rhodopsin is calculated as a function of the absorbance difference between dark-adapted and light adapted rhodopsin at 500 nm (see Equations 1–3). Upon light activation, there is an observable shift in the absorbance maxima to 380 nm, the wavelength characteristic of metarhodopsin II.
3.6 Metarhodopsin II (meta II) assay
The metarhodopsin II assay can be used to determined the stability of light-activated rhodopsin, meta II, in the conditions in which it has been purified. Chimeric, heterotrimeric G protein (Gαiβγ) can be substituted for Gt to characterize the contribution of mutations on protein complex stability.
Prepare a 10 μM sample of purified, dark-adapted rhodopsin (see Subheadings 4 and 5) in Meta II Buffer and mix with 10 μM purified Gt (see Subheadings 9 and 13) in Meta II Buffer.
Incubate the sample on ice for 15 minutes in the dark or under dim red light. Pipette the incubated sample into an appropriate cuvette, place in a spectrophotometer, and collect an absorption spectrum from 350–650 nm for the dark-adapted sample.
Light-activate the sample by pulsing with two bursts of light from a camera flash. Wait 1 minute to allow the sample to be completely activated, mix thoroughly by pipetting, and collect a second absorption spectrum from 350–650 nm for the light-adapted sample (see Note 27).
- To determine the signal contributed by meta II, calculate the difference in the absorbance between 380 nm and 440 nm for both the dark-adapted and light-adapted readings using Equation 4.
- Then determine the meta II signal by calculating the difference in ΔA380–440 between dark-adapted and light-adapted rhodopsin using Equation 5.
See Figure 7 for expected results.
Figure 7. Metarhodopsin II Absorption Spectrum.
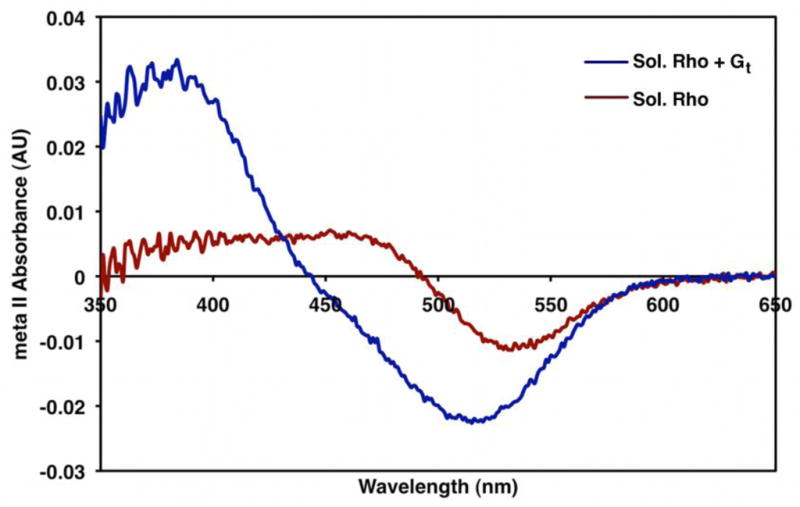
The absorbance spectra of detergent-solubilized rhodopsin (red) and detergent-solubilized rhodopsin in the presence of Gt (blue) after light activation. In the absence of GTP, Gt significantly increases the meta II signal (380 nm). This likely reflects the stabilization of the activated form of receptor by the heterotrimeric G protein.
3.7 Crystallization of Rhodopsin
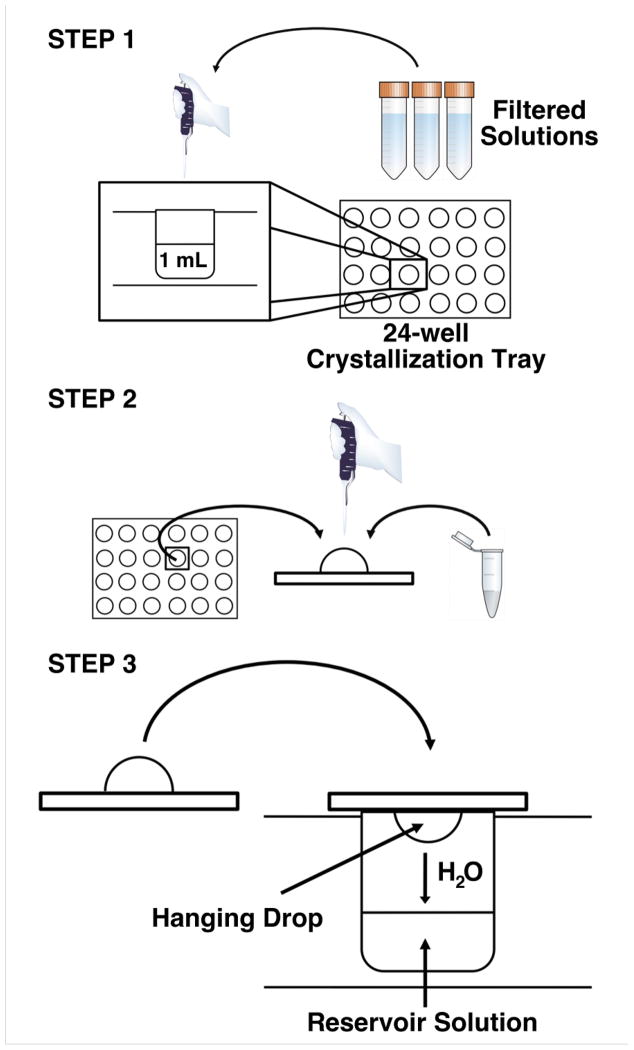
While multiple methods of crystallization exist (sitting drop, hanging drop, batch, etc), the hanging drop vapor diffusion method is the most commonly used (Figure 8). In this method, a closed system is designed in which a droplet of purified protein mixed with reservoir solution, usually in a 50:50 ratio, is allowed to equilibrate with a solution contained in a reservoir below. As water evaporates from the droplet hanging above the reservoir solution, the solubility of the purified protein decreases, the concentration of precipitant increases, and nucleation of crystals occurs. The system is then maintained at equilibrium until crystallization is complete.
Figure 8. Hanging Drop Vapor Diffusion.
Step 1: Prepare the reservoir solution by mixing appropriate volumes of filtered solutions in a single well of a 24-well crystallization tray. The final volume of reservoir solution is typically 1 mL. Step 2: Pipette equal volumes of the purified protein and the reservoir solution onto a siliconized cover slip. There is no need to mix the two components. A common starting volume for the hanging drop is 2 mu;L (1 μL protein + 1 μL of reservoir solution), but can range from <1μL to 10 μL. Step 3: Carefully invert the coverslip without disturbing the droplet and place over the corresponding well. Gently press down on the coverslip to ensure an air-tight seal between the coverslip and the well.
Filter all reagents to be used in the crystallization screen and equilibrate at the crystallization temperature (see Notes 28 and 29).
Mix 1 mL of reservoir solution in the bottom of each well of a pre-greased 24-well Linbro tray. Crystallization conditions for rhodopsin are given in Table 1. Place the tray on a rotating table or pipette reservoir solution up and down to mix the reagents.
Remove dust from siliconized cover slips using an air duster. Pipette 1–2 μL of purified protein onto the cover slip. Pipette an equal volume of reservoir solution on top of the protein drop (see Note 30). It is not necessary to mix this drop. Carefully invert the cover slip and place over the well from which the reservoir solution was taken. Gently push down on the cover slip to make sure the well is tightly sealed. There should be no gaps between the cover slip and silicone grease.
Allow the crystallization reactions to equilibrate without disruption in a vibration-free location at the appropriate temperature for at least 24 hours before monitoring (see Notes 31–33).
Adjust crystallization conditions based on the results of preliminary screens (see Notes 34 and 35).
Table 1.
Crystallization of Rhodopsin
| Rhodopsin (17) | Rhodopsin (54) | Squid Rhodopsin (20) | Meta II (55) | Meta II (55) | Opsin (2) | Opsin (1) | |
|---|---|---|---|---|---|---|---|
| PDB ID | 1F88 | 1U19 | 2Z73 | 3PXO | 3PQR | 3CAP | 3DQB |
| Space Group | P41 | P41 | P62 | H32 | H32 | H3 | H32 |
| Resolution | 2.8Å | 2.2Å | 2.5Å | 3.0Å | 2.85Å | 2.9Å | 3.2Å |
| Method | Hanging Drop | Hanging Drop | Sitting Drop | Hanging Drop | Hanging Drop | Hanging Drop | Hanging Drop |
| Protein Concentration | 10 mg/mL | 6–8 mg/mL | 8 mg/mL | 5 mg/mL | 5 mg/mL | 5 mg/mL | 7–10 mg/mL |
| Drop Size | 9–11 μL | 4–10 μL | 10 μL | 4μL | 4μL | 4μL | 4μL |
| Source | Bovine ROS | Bovine ROS | Microvillar membranes of photoreceptor rhabdoms from squid retina | Bovine ROS | Bovine ROS | Bovine ROS | Bovine ROS |
| Protein Buffer | MES or sodium acetate pH 6.3–6.4, 5–7 mM βME, 90–120 mM Zn(OAc)2, 0.50–0.65% heptane-1,2,3-triol, 2.2:1 ratio of nonyl glucoside: rhodopsin | 6–12 mM βME, 0.1–0.5% heptyl- thioglucoside, 0.5–0.7 M ammonium sulfate | 30 mM MES, pH 6.4, 30 mM Zn(OAc)2, ~100 mM β-D-octyl- glucopyranoside | 1% β-D-octyl- glucopyranoside, 0.02% n- dodecyl- β-D- maltopyranoside | 1% β-D-octyl- glucopyranoside, 0.02% n- dodecyl- β-D- maltopyranoside, GαCT2 peptide | 1% β-D-octyl- glucopyranoside | 1% β-D-octyl- glucopyranoside, GαCT peptide (4:1 ratio of protein:peptide) |
| Reservoir Solution | MES-buffered 3.0–3.4 M ammonium sulfate pH 6.0–6.1 | 20–30 mM MES pH 5.9–6.1, 2.5–3.0 M ammonium sulfate | 3.2 M ammonium sulfate, 32 mM MES pH 6.0–6.7, 38 mM EDTA, 10 mM βME | 3.0–3.4 M (NH4)2SO4, 0.1 M sodium acetate pH 5.0–5.8 | 3.0–3.4 M (NH4)2SO4, 0.1 M sodium acetate pH 5.0–5.8 | 2.8–3.2 M ammonium sulfate, 0.1 M MES or sodium acetate pH 5.6 | 3.2 M ammonium sulfate, 0.1 M MES or sodium citrate pH 6.0 |
| Drop Size | 3–5°C | 10°C | 4°C | 4°C | 4°C | 4°C | 4°C |
3.8 Light-adapted ROS membrane isolation
All steps should be performed under ambient light and on ice or at 4°C.
Thaw bovine retina preparations from 200 eyeballs on ice and decant into a 600 mL beaker. Wash the containers with 30% Sucrose Solution, pool the wash with the thawed retinas, and bring the final volume to 200 mL with 30% Sucrose Solution.
After diluting the retinal slurry to 200 mL with 30% Sucrose Solution, photobleach the retinal slurry without stirring for 30 minutes in order to allow for the formation of the high affinity Rhodopsin-Gt complex. After 30 minutes, continue to photobleach the retinal slurry for an additional 1 hour with stirring to separate the outer segments from the rod cell inner segments and basolateral membrane.
Repeat steps 4–13 as given in Subheading 1. It is not necessary to protect the purified membranes from the light.
3.9 Isolation and purification of transducin
All steps should be performed at 4°C or on ice.
Thaw light-adapted ROS membranes (see Subheading 8) and pour into a 40 mL glass homogenizer. Rinse the frozen ROS membrane container with Isotonic Buffer. Pool the wash solution with the thawed ROS membranes, fill the homogenizer with Isotonic Buffer, and homogenize.
Evenly distribute homogenate into ultracentrifuge tubes and balance with Isotonic Buffer (see Note 16). Cap and invert the tubes 2–3 times to evenly mix the solution. Centrifuge for 20 minutes in a Ti-70 rotor at 30,000 rpm (or 92,000 rcf(max) in a similar rotor).
Discard the supernatant and resuspend the pellets with a small volume of Isotonic Buffer. Transfer the resuspended pellets to the glass homogenizer. Rinse each centrifuge tube with Isotonic Buffer. Pool the wash solution with resuspended pellets, fill the homogenizer with Isotonic Buffer, and homogenize.
Repeat steps 3 and 4 twice, followed by step 3 a third time for a total of four washes with Isotonic Buffer.
After the fourth Isotonic Buffer wash, discard the supernatant and resuspend the pellets with a small volume of Hypotonic buffer. Transfer the resuspended pellets to a glass homogenizer. Rinse each centrifuge tube with Hypotonic Buffer, pool the wash solution with resuspended pellets, fill the homogenizer with Hypotonic Buffer, and homogenize.
Evenly distribute homogenate into ultracentrifuge tubes and balance with Hypotonic Buffer. Cap and invert the tubes 2–3 times to evenly mix the solution. Centrifuge for 20 minutes in a Ti-70 rotor at 30,000 rpm (or 92,000 rcf(max) in a similar rotor).
Repeat steps 6 and 7 for a total of two Hypotonic Buffer washes.
Prepare 400 mL of fresh Hypotonic Buffer containing 0.1 mM GTP (see Note 8). After the second Hypotonic Buffer wash, resuspend each pellet with 25 mL of Hypotonic Buffer containing 0.1 mM GTP. Transfer pellet resuspension to a glass homogenizer. Rinse each tube with a small-volume of the Hypotonic Buffer containing 0.1 mM GTP, and homogenize.
Evenly distribute homogenate into ultracentrifuge tubes and balance with Hypotonic Buffer containing 0.1 mM GTP. Cap and invert the tubes 2–3 times to evenly mix the solution. Centrifuge for 45 minutes in a Ti-70 rotor at 30,000 rpm (or 92,000 rcf(max) in a similar rotor).
Decant the supernatant into a clean container and store on ice. This supernatant contains Gt. Repeat steps 9 and 10 for a total of two washes with Hypotonic Buffer containing 0.1 mM GTP.
Pool the supernatant with the supernatant from the previous round of washing with Hypotonic Buffer containing 0.1 mM GTP. The pellet can now be discarded.
Concentrate Gt-containing supernatant to 1 mL. Particulate contaminants and any remaining membranes may be removed by spinning at top speed in a benchtop Eppendorf centrifuge at 4°C for 30 minutes (optional).
If the purified Gt is to be stored for use at a later time, add glycerol to a final concentration of 10% and freeze the purified protein at −20°C for short-term storage, or −80°C for long-term storage (see Note 36).
See Figure 9 for expected results of an SDS-PAGE analysis of Gt purification fractions.
Figure 9. Purification of Gt.
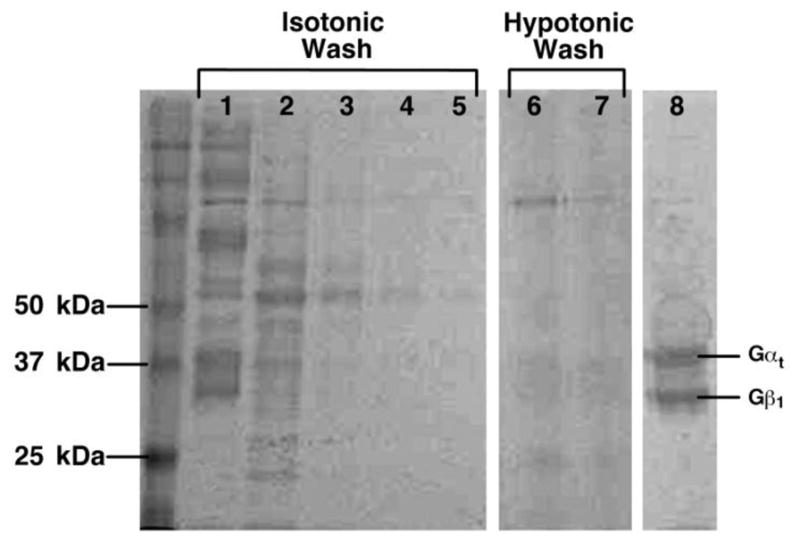
Fractions from a typical purification of Gt are shown on a 10% polyacrylamide gel. Lane 1: urea-washed, light-adapted ROS membranes, Lane 2: Isotonic Wash 1, Lane 3: Isotonic Wash 2, Lane 4: Isotonic Wash 3, Lane 5: Isotonic Wash 4, Lane 6: Hypotonic Wash 1, Lane 7: Hypotonic Wash 2, Lane 8: Concentrated, buffer-exchanged Gt. Gα runs on the 10% gel as a 38 kDa protein, while Gβ runs as a 36 kDa protein. Gγ is not observed on the gel.
3.10 Expression ofGαi1
Gαi subunits are usually expressed with hexahistidine-tags and from expression vectors with ampicillin-resistance. If your mutant is expressed using an alternative antibiotic resistance marker, use the appropriate antibiotic.
Transform BL21 cells with plasmid DNA encoding Gα and plate onto a luria-broth (LB) agar plate containing 100 μg/mL ampicillin. Incubate the plate overnight at 37°C to allow colonies to grow (see Note 37).
The day before you begin cell culture, prepare eight 2L baffled flasks containing 500 mL 2X YT media and one 500 mL baffled flask containing 150 mL of 2X YT media. Autoclave and cool the media to room temperature.
In the morning, prepare a starter culture by pipetting 2 mL 2X YT medium out of the 150 mL flask into a 14 mL cell culture tube and supplementing with 100 μg/mL ampicillin Inoculate this starter culture with a single colony from the overnight LB agar plate, by transferring on a sterile pipette tip or toothpick (see Note 38). Incubate this culture for 8 hours at 37°C while shaking.
After 8 hours, supplement the 500 mL baffled flask containing 150 mL 2X YT media with 100 μg/mL ampicillin and inoculate with your 2 mL starter culture. Incubate this culture overnight, at room temperature (22–25°C), while shaking.
On the following morning, supplement each 2 L baffled flask containing 500 mL 2X YT media with 100 μg/mL Ampicillin and inoculate with 10 mL of the 150 mL 2X YT overnight culture. Incubate the cultures at room temperature while shaking until optical density at 600 nm (OD600) reaches 0.3–0.4 (see Note 39).
Once the OD600 reaches the appropriate level, induce protein expression by adding 30 μM IPTG to each flask. Incubate the cultures at room temperature while shaking for 16–18 hours (see Note 40).
After 18 hours, stop the cell growth and harvest cells for purification (see Note 41).
3.11 Purification of Gαi1
Distribute overnight cultures (see Subheading 10) into 1L centrifuge bottles, balance each bottle, and pellet the cells by centrifuging for 15 minutes at 4°C at 5,000 rpm in Sorvall F9S rotor (or 4,500 rcf(max)).
Discard the supernatant and resuspend the cell pellets with 25 mL of Lysis Plus Buffer on ice. Pool the cell resuspension in a sonication beaker on ice and bring the total volume to 100 mL with Lysis Plus Buffer.
Lyse the cell resuspension by sonicating at 50% amplitude in 20 second intervals for a total of 4 minutes. Rest the cells for 40 seconds between each sonication cycle. Supplement the cell lysate with 0.1 mM PMSF after each minute of sonication. Add 0.1 mM GDP to the lysate, transfer to ultracentrifuge tubes (see Note 16), and balance the tubes with Lysis Plus Buffer. Cap and invert the tubes 2–3 times to mix the solution. Centrifuge at 4°C for 1 hour in a Ti-70 rotor at 50,000 rpm (or 257,000 rcf(max) in a similar rotor). During this time, begin to equilibrate the resin for affinity chromatography (step 5).
Collect the supernatant and discard the pellet. The supernatant is your cleared lysate. Supplement the lysate with 0.1 mM PMSF and store on ice if the resin for affinity chromatography is not fully prepared.
Equilibrate 5 mL of Ni-NTA resin or Co2+-TALON resin (10 mL of a 50% slurry) per 4 L of cell culture in Lysis Plus Buffer. To do this, add 5 mL slurry to each of two 50 mL conical tubes, fill each tube to 50 mL with Lysis Plus Buffer, and mix by gently inverting (see Note 42). Pellet the resin by centrifugation at 4°C and 700 rcf(max) for 2 minutes, discard supernatant, and resuspend each resin pellet with 25 mL (10 × column volume) of Lysis Buffer. Repeat centrifugation and resuspension steps 3–5 times (see Note 43).
Once equilibration of the resin is nearly complete, add DNase and RNase to the cleared lysate and incubate at room temperature for ~ 5–10 min to digest genomic DNA and decrease the viscosity of your lysate. Filter the lysate through a 0.45 μm filter.
Pellet the resin by centrifugation, discard the supernatant, and mix each 2.5 mL aliquot of equilibrated resin with 50 mL lysate in conical tubes for 1 hour at 4°C while rotating.
Pour each lysate-resin mixture into a separate 20 mL gravity flow column and collect the lysate flowthrough (see Note 44).
Wash the tubes containing the filtered lysate-resin mixture with 10 mL of Loading Buffer to recover any remaining protein or resin and add to the gravity flow columns.
Add 25 mL (10 × column volume) of Loading Buffer to each column and collect the flowthrough as Wash fraction 1 in a new collection tube.
Add 25 mL of Wash Buffer (10 × column volume) to each column and collect the flowthrough as a Wash fraction 2 in a new collection tube.
Add 5 mL of Elution Buffer (10 × column volume) to each column and collect the flowthrough as an Elution Fraction 1 in a new collection tube.
Pool the elution fractions, transfer to 10 kDa molecular weight cutoff dialysis tubing, and dialyze the sample in 1.8 L of Dialysis Buffer overnight at 4°C with stirring.
On the following morning, collected the dialyzed protein sample, and concentrate to 5 mL in a 10 kDa molecular weight cut off Amicon concentrator. Pass the concentrated, dialyzed protein sample through a 0.22 μm Whatman filter.
Connect a column packed with 5 mL of SOURCE™ 15Q resin (GE Healthcare) to an HPLC or FPLC system. Place one buffer inlet into Buffer A, and the other inlet into Buffer B. Wash the attached column with 15 mL (3 × column volume) of Buffer B.
Following Buffer B, wash the column with 30 mL (6 × column volume) of Buffer A. Load the filtered protein sample onto a 5 mL sample loop and flow Buffer A over the column at 1.0 mL/min until the entire volume of protein sample has been loaded. While the sample is loading, add 300 μL of Collection Buffer to pre -chilled test tubes (see Note 45 ).
Flow a linear gradient of Buffer B at 1.0 mL/min so that the final concentration of the buffer flowing over the column at the end of 30 minutes is 20% Buffer B and 80% Buffer A. Once the gradient reaches 20% Buffer B, flow Buffer B in a linear gradient at 1.0 mL/min so that the final concentration at the end of 10 minutes is 100% Buffer B and 0% Buffer A (see Note 46). Collect 500 μL fractions in the pre-chilled test tubes containing 300 μL of Collection Buffer until the gradient is complete.
Use the intrinsic tryptophan fluorescence assay to test the activity of each fraction (see Subheading 12). Pool fractions with a minimum of 40% increase in intrinsic tryptophan activation by AlF4-, and analyze purity by SDS-PAGE (see Note 47).
Subject pooled fractions to Bradford Assay (see Subheading 13) to determine the concentration of the pooled protein. If necessary, concentrate the pooled fractions to 2 mL using a 10 kDa molecular weight cutoff Amicon concentrator. Purified protein can be stored at −80°C as 0.5 mg protein aliquots in 10% glycerol or immediately purified by gel filtration chromatography.
For gel filtration chromatography, equilibrate a Superdex 200 10/300 GL gel filtration column in Gαi Buffer (see Notes 48 and 49).
Filter the protein sample using a 0.22 μm SpinX filter and load onto your column (see Note 50).
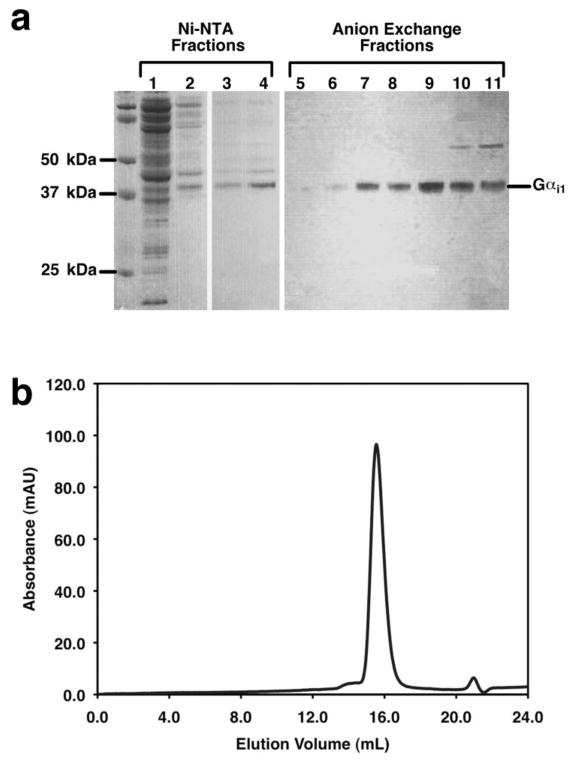
Collect 500 μL fractions corresponding to purified Gα, which is expected to elute 15.5 mL after sample injection onto a 24 mL Supderdex 200 10/300 GL gel filtration column (see Note 51). Analyze the fractions for purity by SDS-PAGE (see Note 52) and test for activity using the intrinsic tryptophan fluorescence assay (see Subheading 12). Pure, active protein fractions can then be pooled, concentrated, and frozen at −80°C for long-term storage.
See Figure 10 for expected results of an SDS-PAGE analysis of Gα purification fractions.
Figure 10. Purification of Gαi1.
The results from a typical purification of wild- type Gα i1 expressed in BL21-GOLD Codon Plus are shown here. a) SDS-PAGE of fractions from affinity chromatography and anion exchange chromatography separated on a 4–12% polyacrylamide gel (Invitrogen). Lane 1: Wash Fraction 1, Lane 2: Wash Fraction 2, Lane 3: Elution Fraction 1, Lane 4: Dialyzed protein. Lanes 5–11: Fractions from the anion exchange purification that were shown to have a 40% increase in their intrinsic tryptophan fluorescence signal. Protein fractions shown in lanes 7–10 were pooled and concentrated for further purification by gel filtration chromatography. b) Typical chromatogram of wild-type Gα i1 (100 μL of 1.3 mg/mL) separated on a Superdex 200 10/300 GL gel filtration column equilibrated in 50 mM Tris-Cl pH 8.0, 200 mM NaCl, 2 mM MgCl2, 1 mM EDTA, 1 mM DTT, and 20 μM GDP. Purified Gα i1 elutes as a well-defined Gaussian peak at 15.5 mL
3.12 Intrinsic Tryptophan Fluorescence Assay
Set excitation wavelength to 280 nm and emission wavelength to 340 nm on a spectrofluorometer.
Add 900 μL of Storage Buffer to a quartz cuvette and zero the spectrofluorometer.
Add 20 μL of purified protein (~200 nM) to 900 μL of Storage Buffer in the cuvette, mix thoroughly, and record basal fluorescence.
Add AlF4− by mixing 20 μL of 500 mM NaF (10 mM final concentration) and 8 μL of 10 mM AlCl3 (80 μM final concentration) simultaneously in the cuvette containing protein in Storage Buffer (see Note 53). Mix thoroughly by pipetting and record fluorescence emission at 340 nm.
- Calculate the percentage increase in fluorescence between the two readings using the following formula:
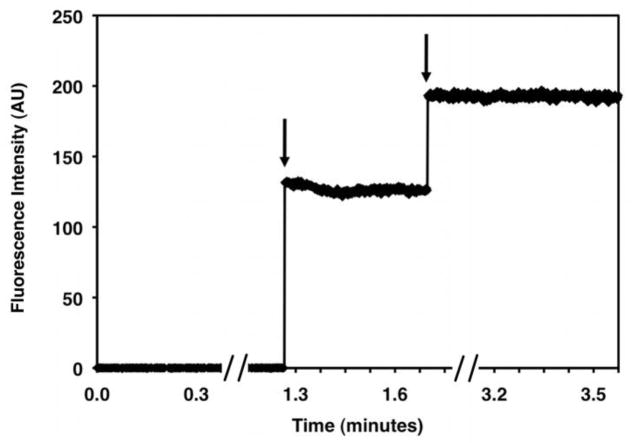
See Figure 11 for expected results.
Figure 11. Intrinsic Tryptophan Fluorescence of Heterologously Expressed G3 subunits.
The spectrum shows the fluorescence signal from ~200 nM of purified wild-type Gαi1 in a buffer containing 50 mM Tris-Cl pH 8.0, 50 mM NaCl, 2 mM MgCl2, 1 mM DTT, and 10 μM GDP before and after the addition of AIF4−. Purified protein added to Storage Buffer (50 mM Tris-Cl pH 8.0, 50 mM NaCl, 2 mM MgCl2, 1 mM DTT, and 10 μM GDP) results in basal fluorescence arrow at 1.3 minutes). AlF4− is added by bringing the concentration of NaF in the cuvette to 10 mM and AlCl3 to 50 μM. Binding of to GDP-Gα results in an increase in the fluorescence from Trp211 (arrow at 2 minutes). The increase in fluorescence is calculated as the percentage difference in the average fluorescence signal of GDP- versus GDP-AlF4−-bound Gαi1.
3.13 Determining the concentration of Gt or Gαi1
Warm 1X Quick Start ™ Bradford dye to room temperature (see Notes 54 and 55).
Add 20 μL of water or buffer for a blank standard, each BSA standard, and 1:10 or 1:50 dilutions of purified, soluble Gt or Gαi1 into 1 mL cuvettes (see Notes 56 and 57).
Add 1mL of room temperature 1X Quick Start™ dye to each cuvette.. Mix each sample by pipetting and incubate at room temperature for at least 5 minutes, but no more than 1 hour (see Note 58).
Measure the absorbance of each sample at 595 nm. Use the blank sample prepared with water or buffer to zero the instrument before recording the absorbance for the standards and purified Gαi1 or Gt.
-
Use a graphing program to plot the absorbance values and to fit the data to a line with the following equation:
where A595 corresponds to the absorbance at a wavelength of 595 nm for each standard, C corresponds to the concentration of each known standard, b is the y-intercept of the line fit to the data collected, and m is the slope of the line.
After determining the equation of the line that best fits the absorbance data collected for the known standards, use the recorded A595 collected for the protein sample of unknown concentration to determine its concentration (C).
3.14 Crystallization of Gα proteins
Table 2 summarizes the conditions used to determine the structures of a subset of 33 proteins known to interact with rhodopsin. These can be used to guide your own vapor diffusion experiment using Subheading 7.
Table 2.
Crystallization of G protein α-subunits
| Gαt-GDP(5) | Gαt-GDP-AlF−4(6) | Gαt - GTPγS(4) | Gαi1 -GDP-AlF−4 (31) | Gαi1 - GTPγS (31) | |
|---|---|---|---|---|---|
| PDB ID | 1TAG | 1TAD | 1TND | 1GFI | 1GIL |
| Space Group | I222 | P21 | P21 | P3221 | P3221 |
| Resolution | 1.8 Å | 1.7 Å | 2.2 Å | 2.2 Å | 2.3 Å |
| Method | Hanging Drop | Batch | Hanging Drop | Sitting Drop | Sitting Drop |
| Protein Concentration | 13.3 mg/m | 20 mg/mL | 20–25 mg/mL | 25–30 mg/mL | 25–30 mg/mL |
| Drop Size | 3–5 μL | 20 μL | 3–5 μL | 20 μL | 20 μL |
| Source | Bovine ROS | Bovine ROS | Bovine ROS | Heterologous expression in E. coli | Heterologous expression in E. coli |
| Protein Buffer | 10 mM Tris-Cl pH 7.5, 0.5 mM MgCl2, 50 μM AlCl3, 15 mM NaF, 10% gycerol, 100–200 mM NaCl, 0.1% βME |
10 mM Tris-Cl pH 7.5, 0.5 mM MgCl2, 50 μM AlCl3, 15 mM NaF, 10%> glycerol, 100–200 mM NaCl, 0.1% βME |
5 mM Tris-Cl pH 7.5, 10 mM MgCl2, 25 mM βME, 40% glycerol |
300 μM AlCl3, 5 mM NaF, 5 mM MgCl2, 10 mM DTT, 200 mM sodium acetate pH 6.0 |
300 μM GTPγS, 5 mM NaF, 5 mM MgCl2, 10 mM DTT, 200 mM sodium acetate pH 6.0 |
| Reservoir Soultion | 9% PEG 8000, 10% glycerol, 50 mM MES pH 7.5, 200 mM MgCl2, 0.1% βME | 20% PEG 8000, 200 mM CaCl2, 100 mM sodium cacodylate pH 6.0, 0.2% βME, 5 mM MgCl2, 100 μM AlCl3, 30 mM NaF, 40% glycerol | 5% PEG 8000, 250 mM sodium cacodylate pH 6.0, 350 mM CaCl2, 25 mM βME, 30% glycerol | 1.8–1.9 M ammonium sulfite | 1.8–1.9 M ammonium sulfite |
| Crystallization Temperature | 4°C | 4°C | −12.5°C | 21°C | 21°C |
3.15 Chemical Crosslinking of Rhodopsin to Gt
Determine the concentration of rhodopsin in dark-adapted ROS membranes that are not urea-washed and resuspend to 10 μM in Buffer A (see Note 59).
Light-activate the ROS-Gt sample by incubating on ice for 5 minutes under ambient light.
Add a 10-fold molar excess of DTSSP to the light activated ROS sample and incubate for 30 minutes on ice.
Add 1 M Tris-Cl pH 7.5 to a final concentration of 50 mM and incubate for 15 minutes at room temperature to terminate the crosslinking reaction.
Centrifuge the crosslinked sample at 100,000 rcf(max) for 15 minutes at 4°C, discard the supernatant, and resuspend the pellet with Buffer A. Repeat membrane pellet wash three times. This removes Gt that is not associated with rhodopsin.
After the third wash, resuspend the membrane pellet with Buffer A containing 100 μM GTPγS. Incubate the resuspended membranes for 5 minutes at 4°C.
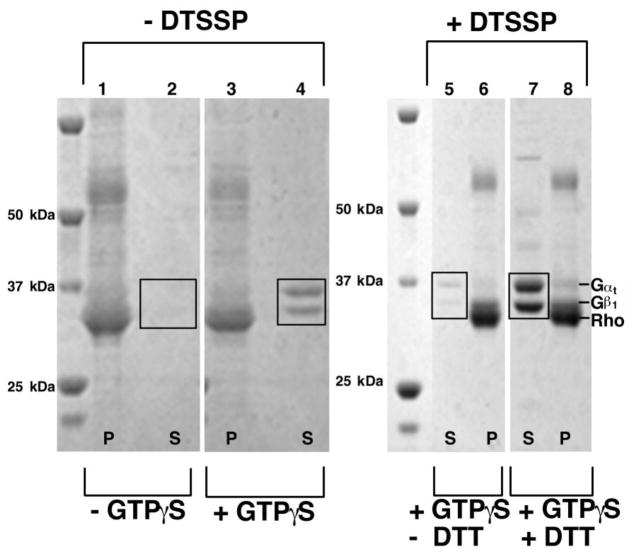
After 5 minutes, centrifuge the sample at 100,000 rcf(max) for 15 minutes at 4°C. Separate the supernatant from the pellet and analyze both by SDS-PAGE (see Figure 12 for expected results).
Figure 12. Chemical Crosslinking of Rhodopsin-Gt.
Dark-adapted ROS membranes were resuspended to 10 μM total protein and photoactivated to form the rhodopsin-Gt complex in the presence and absence of the crosslinking agent DTSSP. Samples were centrifuged to separate the membrane fraction from the soluble fraction and each analyzed by SDS-PAGE on a 4–12% gradient gel (Invitrogen). The cross-linked sample does not migrate into the gel, and the formation of the cross-link is verified by monitoring disappearance of the Gαt and Gβ1 bands. Lanes 1–4 contain samples that were prepared without the cross-linker DTSSP. Lanes 5 & 6 contain samples that were incubated with DTSSP. Lanes 7 & 8 contain samples that were incubated with DTSSP, but were cleaved with DTT. Lanes marked with S represent the supernatant fractions. Lanes marked with P represent the pellet fraction. Lane 1: dark-adapted ROS membranes. The bands corresponding to Gαt and Gβ1 are present but are obscured by other proteins. Lane 2: supernatant after 3 washes in Buffer A. Gαt and Gβ1 are not released into the supernatent as they are in a high-affinity complex with rhodopsin. Their expected position is noted in Box 1. Lane 3 ROS-membranes after three washes in Buffer A containing 100 μM GTPγS. These are now depleted of Gαt and Gβt. Lane 4: supernatant after three washes in Buffer A containing 100 μM GTPγS. The addition of GTPγS to light activated ROS disassociates the rhodopsin Gt complex. In the absence of a cross-linking agent, Gt is released into the supernatent, and Gαt and Gβ1 are observed on the gel (Box 2) Lane 5: supernatant from a DTSSP-treated sample after 3 washes in Buffer A containing 100 μM GTPγS. The covalent cross-link prevents disassociation of the complex after GTPγS, and Gt is released (Box 3). Lane 6: DTSSP-treated ROS membranes after three washes in Buffer A containing 100 μM GTPγS. Lane 7: supernatant of a DTSSP-treated sample after incubation with 50 mM DTT and 3 washes in Buffer A containing 100 μM GTPγS. As in lane 4, Gt is released from the complex upon treatment with GTPγS, and robust bands corresponding to Gαt and Gβ1 are observed on the gel (Box 4). Lane 8 DTSSP-treated ROS membranes after incubation with 50 mM DTT and 3 washes in Buffer A containing 100 μM GTPγS.
3.16 In vitro Rho-Gt complex formation
Mix stoichiometric amounts of dark-adapted ConA-purified rhodopsin with purified Gt and allow the sample to mix for 1 hour at 4°C in the dark.
Light-activate rhodopsin and induce complex formation by pulsing the sample with bursts of light from a camera flash. Mix the sample by pipetting up and down and expose to a second burst of light from a camera flash. Incubate the light-activated sample for 20 minutes on ice under ambient light.
Filter the sample through a 0.22 μm filter and load the activated complex on a Superdex 200 10/300 GL gel filtration column equilibrated with at least 10 column volumes of Rho-Gt Buffer (see Note 60).
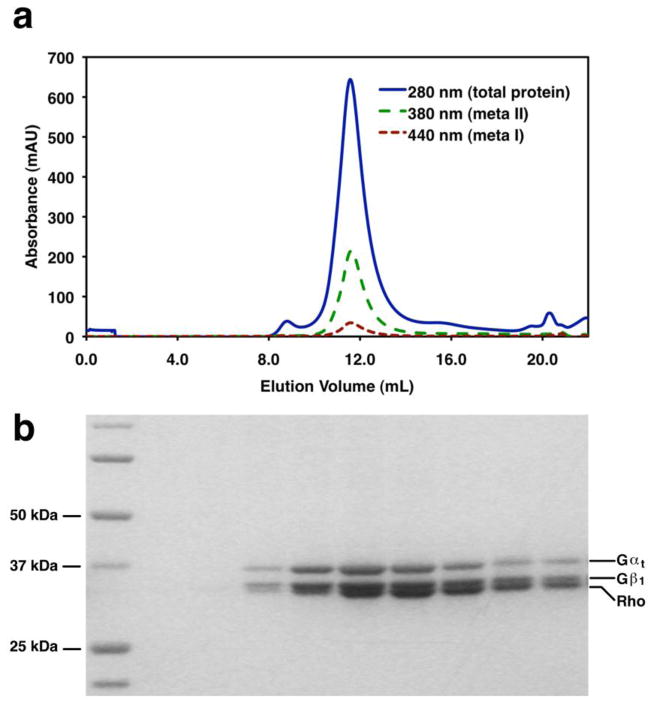
Monitor the absorbance of eluted species at 280 nm (total protein), 380 nm (meta II), and 440 nm (meta I) to quantify the completeness of rhodopsin activation and to separate heterogeneous species (see Figure 13a for expected results).
Collect 500 μL fractions corresponding to purified Rhodopsin-Gt complex. The 2:1 complex is expected to elute at 11.5 mL and the 1:1 complex is expected to elute at 12.6 mL on a Superdex 200 10/300 GL column equilibrated in Rho-Gt Buffer (see Note 61). Analyze the fractions by SDS-PAGE (see Figure 13b for expected results) to verify the purity and presence of all components of the complex (see Notes 52 and 62). Analyze the activity of the complex using the meta II assay (see Subheading 6 or the GTPγS exchange assay (see Subheading 17).
Figure 13. In vitro Formation of the Rhodopsin-Gt Complex.
Purified Gt and purified rhodopsin in 0.5 mM DDM were mixed in equimolar amounts. The sample was light activated, incubated under ambient light for 20 minutes, and analyzed by gel filtration chromatography on a Superdex 200 10/300 GL size exclusion column equilibrated in 50 mM HEPES pH 8.0, 100 mM NaCl, 1 mM MgCl2, 1 mM EDTA, and 0.5 mM DDM. A. The rhodopsin:Gt complex elutes as a homogeneous, Gaussian peak at 11.5 mL. B. Fractions collected across the peak in (A) analyzed on a 4–12% gradient polyacrylamide gel (Invitrogen). Rhodopsin, Gαt, and Gβ1 are observed.
3.17 Receptor-catalyzed GTP3S exchange assay
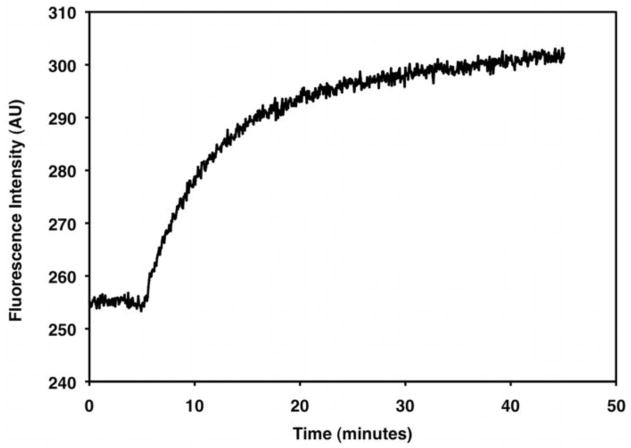
The rate of receptor-catalyzed nucleotide exchange can be measured by monitoring the increase in intrinsic tryptophan fluorescence in heterotrimeric G proteins in the presence of light activated rhodopsin. This assay can be applied to Gt or recombinant Gαi reconstituted with Gβγ (see Note 63 ).
Mix 200 nM Gt or 200 nM Gαi mixed with 200 nM Gβγ in a cuvette containing Activation Buffer (see Note 64).
Set the excitation wavelength to 280 nm and emission wavelength to 340 nm.
Add 10 μM GTPγS and 100 nM purified rhodopsin, mix thoroughly by pipetting, and collect the emission spectrum at 340 nm for 40 minutes at 21°C.
Normalize the data to the baseline (0%) and the fluorescence maximum (100%).
Fit the normalized data to an exponential association curve to determine the receptor-catalyzed nucleotide exchange rate (see Figure 14 for expected results).
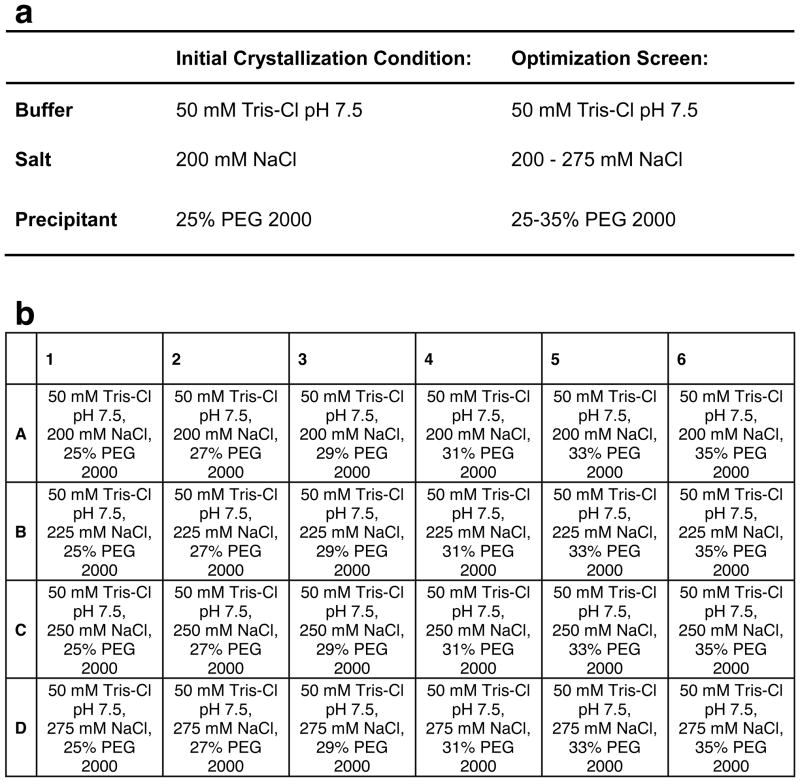
Figure 14. Example Optimization of a Crystallization Condition.
Small variations in stock solutions between individuals and lab-to-lab variations in temperature, and techniques often require that crystallization conditions undergo optimization if the crystals are to be replicated from a published protocol. Crystallization conditions are usually optimized by varying the concentration or identity of each crystallization component in a stepwise manner. a) Example crystallization conditions for a hypothetical protein. b) Example of a 24-well screen optimizing the crystallization conditions in (A). These conditions sample concentrations of reagents comprising the reservoir solution above and below those of the initial crystallization condition.
Figure 15. Receptor-Catalyzed GTPγS Exchange.
A fluorescence spectrum obtained for 200 nM Gt activated by 100 nM purified rhodopsin in the presence of 10 μM GTPγS. Excitation is at 280 nm, and emission is at 340 nm. The baseline is collected from 0–10 minutes (fluorescence in the absence of GTPγS). Upon addition 10 μM GTPγS, the fluorescence signal increases until Gt is maximally activated (~30 minutes).
Footnotes
Bovine eyes can be obtained from your local slaughterhouse.
All solutions that include volatile reagents (DTT or βME) or protease inhibitors with short half-lives (PMSF) should be prepared fresh each time the solution is made.
PMSF rapidly degrades in aqueous solutions where its half-life is approximately 110 minutes (56). Prepare stock solutions of this protease inhibitor in organic solvents such as acetone or isopropanol.
The pH of all buffers containing Tris-Cl listed in protocols throughout this chapter should be adjusted with HCl.
Many detergents are available in two grades. SOL-grade detergents are less pure and less expensive. These can be used for solubilization of membrane proteins but may be too heterogeneous to support crystallization. ANAGRADE detergents are of higher purity and should be used for techniques requiring homogenous solutions, like x-ray crystallography.
All buffers used for chromatographic techniques should be filtered to remove large particles and dust. Buffers containing detergents should be filtered in sufficiently large bottles (use a 1 L bottle for filtering 500 mL of buffer) so that the bubbles generated during filtering will not be suctioned into the vacuum pump. If you are using Millipore Centricon® filters, add DDM after filtering. DDM will concentrate in Millipore Centricon® filters, which can affect the final concentration of detergent in your buffer.
It is important to use high quality, siliconized or plastic cover slips versus non-siliconized glass cover slips. While more expensive, the hydrophobic surface of siliconized cover slips promotes protein droplets more conducive to crystallization.
GTP can be hydrolyzed in aqueous solutions. Prepare this buffer right before use and add GTP from a fresh stock.
Ampicillin is usually prepared as a 1000X (100 mg/mL) stock solution that can withstand long-term storage at −20°C. The stock solution can be made in either a water solution or a 70% ethanol solution. The latter will not freeze at −20°C, thus decreasing the wait time for thawing the reagent during experiments.
The rhodopsin-Gt complex is light sensitive. Protect the gel filtration column from ambient light by performing gel filtration experiment under dim red light or by wrapping column in aluminum foil.
The half-life of a rhodopsin-Gt complex in the presence of detergent micelles is approximately 30 minutes. Supplementing the gel filtration buffer or eluted protein fractions with all-trans retinal can improve the half-life of the complex (57).
If the volume of the retinal slurry exceeds the volume held by the maximum number of centrifuge tubes that will fit in your rotor, leave the pellet intact, layer remaining slurry on top of the pellet, and repeat the centrifugation step until all of the retinal slurry is centrifuged as described. Pool the fresh supernatant with supernatant from the previous round of centrifugation.
Sucrose Solution 1 is the least dense, while Sucrose Solution 3 is the densest. To ensure that you maintain a distinct interface, be slow to dispense each sucrose solution into each of the centrifuge tubes and slow to remove the pipette tip from the centrifuge tube once the solution has been dispensed.
The sucrose layer below the ROS membrane layer and the pellet at the bottom of the centrifuge tube contain contaminants. To avoid these contaminants, remove the top layer by pipetting slowly and without disrupting the gradient.
Homogenize all resuspended fractions by inserting and removing the plunger into the glass homogenizer at least 10 times. This will ensure adequate separation of the ROS membranes from other retinal components.
Extra caution is required when balancing ultracentrifuge tubes. The weight of each tube should be within 0.1 g of each other.
The pellet in this step of the purification contains the ROS membranes. It is very soft and may decant with the supernatant. Instead of decanting, pipette the supernatant off of the pellet to control the amount of pellet loss.
Detergent in this step of the membrane wash will extract rhodopsin from the membrane pellet and result in a loss of protein. It is important to use a solution without any detergent when washing this membrane pellet.
The volume of Solubilization Buffer should be proportional to the initial volume of urea-washed ROS membranes used in your ConA purification so that the final concentration of DDM after receptor solubilization is less than 40 mM.
Be careful to avoid getting air on the column, which can damage the resin and prevent the elution buffer from accessing the air pockets (thus decreasing yield). Attach the syringe to the column using a “wet-connect” technique by adding buffer to an adaptor connected to the top of the column and filling the syringe tube with a small volume of buffer once it is connected to the column before the column plug on the bottom end is removed.
It is important to equilibrate the ConA resin for at least 2 days in a buffer containing 0.5 mM (or more) DDM before it is used for the first time (SOL-GRADE detergent is acceptable for this). Most chromatography columns contain hydrophobic binding sites that will strip the detergent micelles from protein if they are not filled. This results in aggregation of membrane proteins and large decreases in yield.
The detergent concentration in the solubilized rhodopsin sample needs to be sufficiently decreased by dilution with ConA Binding Buffer. While the effects of high detergent concentrations on ConA affinity chromatography are unknown, it is possible that the high concentration of DDM may interfere with rhodopsin-ConA interactions.
The rhodopsin-containing load fraction needs to be looped over the conA column during the loading step because the kinetics of binding are slow.
ConA-purified rhodopsin samples contain the sugars α-D methylglucoside and sucrose, which can stick to concentrator filters. During concentration, wash the sides of the filter with the concentrated protein sample before refilling with unconcentrated, purified protein to minimize the amount of protein stuck to the filter.
While the sample is being light-activated with bursts of bright light, remember to close your eyes to preserve night-vision.
The concentration measured in this experiment is for 4 μL of protein diluted to 100 μL (1:25 dilution). Be sure to account for such dilution factors when calculating the concentration. Multiply the concentration obtained using equation 3 by 25 to obtain the actual rhodopsin concentration in your undiluted sample.
This photoactivation technique activates only 10% of the total rhodopsin population in your sample.
Filter all buffers and protein samples before using in the vapor diffusion experiment to remove dust particles.
The temperature of the reagents should match that of the crystallization system. Drastic changes in temperature often interfere with crystallization.
Be careful to avoid air bubbles during pipetting. Watching your pipette as solutions are dispensed and stopping before air is dispensed can prevent bubble formation in your protein drop. If you do introduce an air bubble into the crystallization reaction, these can be removed by touching the droplet gently with a clean, dry pipette tip.
Crystallization can be temperature sensitive. If you do not have a dedicated crystallization incubator, place the crystallization trays into a room with low temperature variation and away from windows, as sunlight can cause dramatic local temperature changes.
Physical vibrations, such as those from air compressors, can impair crystallization. Store crystallization trays in a room that lacks signification vibrations. Avoid disrupting trays for a least one day after having set them up.
Because rhodopsin undergoes a conformational change upon activation, dark-adapted rhodopsin crystals must be examined under dim red light, either by using a red filter fitted to a light microscope or with an infrared camera.
The crystallization condition for obtaining the highest quality crystals can be optimized by slightly varying the components in the condition. This includes testing alternative precipitants, alternative salts, buffer pH, temperature, concentrations of each chemical, protein concentrations, hanging drop size, and the method of crystallization used. For example, in the hanging drop vapor diffusion example given in Figure 14a, the buffer identity and concentration are held constant, but salt and precipitant concentrations are varied. Condition optimization is often performed in 24-well crystallization trays with each well containing a unique crystallization condition. Figure 14b is an example of a optimization screen.
While the majority of protein crystals exhibit the best diffraction when they are large, the best crystals of rhodopsin were very small and needle-shaped. The diffraction from rhodopsin crystals is inconsistent, with only a small percentage of optically equivalent crystals exhibiting reasonable diffraction.
If Gt is to be separated into GDP-bound Gαt and Gβγ, concentrate the Gt-containing supernatant to ~7–8 mL. Add MgSO4 to a final concentration of 40 mM and purify the protein sample on a Blue Sepharose gel filtration column (GE Healthcare). Collect the fractions corresponding to Gα and Gβγ separately, and analyze their purity by SDS-PAGE.
It is preferable to use cells that have been transformed with fresh plasmid DNA (less than 3 months old) immediately before cell expression. Both glycerol stocks of transformed cells and older DNA (even stored at −20 °C) commonly result in lower protein yields for unknown reasons.
Wrap parafilm around the bacterial plate, to keep moisture and air out, and store at 4°C. Colonies from this plate can be used for protein growths for up to 1 week. After 1 week, yields may be compromised.
Most cell cultures of Gα proteins expressed in BL-21 E. coli will reach an OD600 of 0.3–0.4 within 2–3 hours post-inoculation when grown at room temperature, however, this is dependent on the Gα mutant and expression system used. Monitor the absorbance carefully, as late induction can affect the yield.
Induction for longer than 18 hours decreases the yield.
Cell pellets can be stored at −80°C. Freezing and thawing the pellets has been shown to actually improve the protein yield by contributing to cell lysis.
When resuspending the resin, gently invert the bottle until all of the resin is in solution. Shaking can cause the resin to break apart into small pieces, called fines, which can clog fritted filters and interfere with affinity chromatography. To remove fines, re-mix the resin in the desired buffer and allow it to settle for ~5 minutes. This is enough time to allow the beads to settle, but the small particles remain in solution. Decant the resin supernatant, add fresh buffer, and re-mix by inverting. Repeat the process until the resin settles within 5 minutes and leaves behind a clear supernatant.
Commercially available resin is usually stored in ethanol, which will precipitate the protein if it is not completely exchanged prior to use. Perform 3–5 successive washes of the resin slurry using 10 column volumes of Loading Buffer per wash or by continuous flow of Loading Buffer over resin in a gravity flow column to remove the ethanol.
While G proteins are stable at room temperature, it is beneficial to perform all steps of purification at 4°C.
If anion exchange is performed at room temperature, be sure to collect protein fractions on ice.
A slow, low salt buffer gradient followed by a fast, high salt buffer gradient is needed to separate Gα proteins from contaminants by anion exchange chromatography.
Purified Gα is best resolved on 10% polyacrylamide gels.
Filter all buffers and protein samples prior to gel filtration chromatography as large particles and aggregates can irreversibly damage both the column and the instrument.. Small volumes of buffer or protein can be spin-filtered on a Spin-X column, while large volumes can be vacuum filtered.
Gα subunits more stable in Tris-Cl buffers than HEPES buffers. The inclusion of a guanine nucleotide is critical for the stability of the Gα subunit, and GDP is most frequently used.
For achieving the best resolution, use a sample volume of 500 μL or less for gel filtration purification of proteins on a 24 mL Superdex 200 10/300 GL gel filtration column.
Gαi purified on a column equilibrated in 50 mM Tris-Cl pH 7.5 buffer containing 200 mM NaCl will elute at 15.5 mL. This is not necessarily the case for Gαi purified in other buffers. If using other buffers, the gel filtration column should be calibrated in that buffer using standards.
The Gt heterotrimer and Gαi are both best resolved on a 10% polyacrylamide gel. Of the three Gt subunits, Gγ is the smallest (approximately 8 kDa) and is not observed on 10% acrylamide gels.
AlF4− is highly unstable in solution for extended periods of time, and must be formed by mixing AlCl3 and NaF immediately before intrinsic tryptophan fluorescence is measured.
In the case of limiting quantities of protein, this assay can also be performed in a 96-well plate using 5 μL of protein and 250 μL of 1X Quick Start™ Bradford dye.
Mix the dye thoroughly by inverting the bottle multiple times before use so that all samples develop evenly.
Use a clean pipette tip for each sample to avoid cross-contamination, as this will affect the fit of a regression line to your data.
In order to determine the appropriate dilution of your protein of unknown concentration, try loading different dilutions of the purified sample on a gel and analyze by SDS-PAGE. Compare the intensity of each dilution to that of a protein sample of known concentration. You will want to pick a dilution that falls into the range of the protein standard concentrations.
The Bradford dye is light sensitive. Keep the samples protected from ambient light during the incubation step.
If substituting buffers, do not use Tris-Cl or any buffer that contains a primary amine, as these will interfere with the cross-linking reaction.
For the reasons discussed in Note 21, it is important to equilibrate the gel filtration column in buffer containing detergent for a minimum of 48 hours prior to the first use. To save money on detergent, a fixed volume of buffer may be looped over the column.
The given elution volumes are for rhodopsin-Gt complexes purified on a Superdex 200 10/300 GL gel filtration column equilibrated in Rho-Gt Buffer. This is not necessarily the volume at which the complex will elute if purified in different buffers or different detergents.
Many membrane proteins will aggregate upon boiling in SDS-PAGE buffer. Room temperature incubation is sufficient.
To reconstitute Gt using recombinant Gα and GPγ, first mix purified proteins in equimolar amounts and incubate on ice for 10 minutes prior to addition to the sample cuvette containing buffer.
The Activation Buffer should not contain GDP. The presence of free GDP in solution will inhibit GTPγS binding.
References
- 1.Scheerer P, Park JH, Hildebrand PW, Kim YJ, Krauss N, Choe HW, Hofmann KP, Ernst OP. Crystal structure of opsin in its G-protein-interacting conformation. Nature. 2008;455:497–502. doi: 10.1038/nature07330. [DOI] [PubMed] [Google Scholar]
- 2.Park JH, Scheerer P, Hofmann KP, Choe HW, Ernst OP. Crystal structure of the ligand-free G-protein-coupled receptor opsin. Nature. 2008;454:183–187. doi: 10.1038/nature07063. [DOI] [PubMed] [Google Scholar]
- 3.Hamm HE, Deretic D, Arendt A, Hargrave PA, Koenig B, Hofmann KP. Site of G protein binding to rhodopsin mapped with synthetic peptides from the alpha subunit. Science. 1988;241:832–835. doi: 10.1126/science.3136547. [DOI] [PubMed] [Google Scholar]
- 4.Noel JP, Hamm HE, Sigler PB. The 2.2 A crystal structure of transducin-alpha complexed with GTP gamma S. Nature. 1993;366:654–663. doi: 10.1038/366654a0. [DOI] [PubMed] [Google Scholar]
- 5.Lambright DG, Sondek J, Bohm A, Skiba NP, Hamm HE, Sigler PB. The 2.0 angstrom crystal structure of a heterotrimeric G protein. Nature. 1996;379:311–319. doi: 10.1038/379311a0. [DOI] [PubMed] [Google Scholar]
- 6.Sondek J, Lambright DG, Noel JP, Hamm HE, Sigler PB. GTPase mechanism of Gproteins from the 1.7-A crystal structure of transducin alpha-GDP-AIF-4. Nature. 1994;372:276–279. doi: 10.1038/372276a0. [DOI] [PubMed] [Google Scholar]
- 7.Van Eps N, Oldham WM, Hamm HE, Hubbell WL. Structural and dynamical changes in an alpha-subunit of a heterotrimeric G protein along the activation pathway. Proc Natl Acad Sci U S A. 2006;103:16194–16199. doi: 10.1073/pnas.0607972103. [DOI] [PMC free article] [PubMed] [Google Scholar]
- 8.Millar RP, Newton CL. The year in G protein-coupled receptor research. Mol Endocrinol. 2010;24:261–274. doi: 10.1210/me.2009-0473. [DOI] [PMC free article] [PubMed] [Google Scholar]
- 9.Hargrave PA, McDowell JH, Curtis DR, Wang JK, Juszczak E, Fong SL, Rao JK, Argos P. The structure of bovine rhodopsin. Biophys Struct Mech. 1983;9:235–244. doi: 10.1007/BF00535659. [DOI] [PubMed] [Google Scholar]
- 10.Schertler GF, Villa C, Henderson R. Projection structure of rhodopsin. Nature. 1993;362:770–772. doi: 10.1038/362770a0. [DOI] [PubMed] [Google Scholar]
- 11.Sakmar TP, Franke RR, Khorana HG. The role of the retinylidene Schiff base counterion in rhodopsin in determining wavelength absorbance and Schiff base pKa. Proc Natl Acad Sci U S A. 1991;88:3079–3083. doi: 10.1073/pnas.88.8.3079. [DOI] [PMC free article] [PubMed] [Google Scholar]
- 12.Karnik SS, Sakmar TP, Chen HB, Khorana HG. Cysteine residues 110 and 187 are essential for the formation of correct structure in bovine rhodopsin. Proc Natl Acad Sci U S A. 1988;85:8459–8463. doi: 10.1073/pnas.85.22.8459. [DOI] [PMC free article] [PubMed] [Google Scholar]
- 13.Ballesteros JA, Jensen AD, Liapakis G, Rasmussen SG, Shi L, Gether U, Javitch JA. Activation of the beta 2-adrenergic receptor involves disruption of an ionic lock between the cytoplasmic ends of transmembrane segments 3 and 6. J Biol Chem. 2001;276:29171–29177. doi: 10.1074/jbc.M103747200. [DOI] [PubMed] [Google Scholar]
- 14.Shi L, Liapakis G, Xu R, Guarnieri F, Ballesteros JA, Javitch JA. Beta2 adrenergic receptor activation. Modulation of the proline kink in transmembrane 6 by a rotamer toggle switch. J Biol Chem. 2002;277:40989–40996. doi: 10.1074/jbc.M206801200. [DOI] [PubMed] [Google Scholar]
- 15.Mirzadegan T, Benko G, Filipek S, Palczewski K. Sequence analyses of G-protein-coupled receptors: similarities to rhodopsin. Biochemistry. 2003;42:2759–2767. doi: 10.1021/bi027224+. [DOI] [PMC free article] [PubMed] [Google Scholar]
- 16.Papermaster DS, Dreyer WJ. Rhodopsin content in the outer segment membranes of bovine and frog retinal rods. Biochemistry. 1974;13:2438–2444. doi: 10.1021/bi00708a031. [DOI] [PubMed] [Google Scholar]
- 17.Palczewski K, Kumasaka T, Hori T, Behnke CA, Motoshima H, Fox BA, Le Trong I, Teller DC, Okada T, Stenkamp RE, Yamamoto M, Miyano M. Crystal structure of rhodopsin: A G protein-coupled receptor. Science. 2000;289:739–745. doi: 10.1126/science.289.5480.739. [DOI] [PubMed] [Google Scholar]
- 18.Cherezov V, Rosenbaum DM, Hanson MA, Rasmussen SGF, Thian FS, Kobilka TS, Choi HJ, Kuhn P, Weis WI, Kobilka BK, Stevens RC. High-resolution crystal structure of an engineered human beta(2)-adrenergic G protein-coupled receptor. Science. 2007;318:1258–1265. doi: 10.1126/science.1150577. [DOI] [PMC free article] [PubMed] [Google Scholar]
- 19.Jaakola VP, Griffith MT, Hanson MA, Cherezov V, Chien EYT, Lane JR, Jzerman IAP, Stevens RC. The 2.6 Angstrom Crystal Structure of a Human A(2A) Adenosine Receptor Bound to an Antagonist. Science. 2008;322:1211–1217. doi: 10.1126/science.1164772. [DOI] [PMC free article] [PubMed] [Google Scholar]
- 20.Murakami M, Kouyama T. Crystal structure of squid rhodopsin. Nature. 2008;453:363–367. doi: 10.1038/nature06925. [DOI] [PubMed] [Google Scholar]
- 21.Warne T, Serrano-Vega MJ, Baker JG, Moukhametzianov R, Edwards PC, Henderson R, Leslie AGW, Tate CG, Schertler GFX. Structure of a beta(1)-adrenergic G-protein-coupled receptor. Nature. 2008;454:486–U482. doi: 10.1038/nature07101. [DOI] [PMC free article] [PubMed] [Google Scholar]
- 22.Wu B, Chien EY, Mol CD, Fenalti G, Liu W, Katritch V, Abagyan R, Brooun A, Wells P, Bi FC, Hamel DJ, Kuhn P, Handel TM, Cherezov V, Stevens RC. Structures of the CXCR4 chemokine GPCR with small-molecule and cyclic peptide antagonists. Science. 2010;330:1066–1071. doi: 10.1126/science.1194396. [DOI] [PMC free article] [PubMed] [Google Scholar]
- 23.Unger VM, Schertler GF. Low resolution structure of bovine rhodopsin determined by electron cryo-microscopy. Biophys J. 1995;68:1776–1786. doi: 10.1016/S0006-3495(95)80354-1. [DOI] [PMC free article] [PubMed] [Google Scholar]
- 24.Farrens DL, Altenbach C, Yang K, Hubbell WL, Khorana HG. Requirement of rigid-body motion of transmembrane helices for light activation of rhodopsin. Science. 1996;274:768–770. doi: 10.1126/science.274.5288.768. [DOI] [PubMed] [Google Scholar]
- 25.Altenbach C, Kusnetzow AK, Ernst OP, Hofmann KP, Hubbell WL. High-resolution distance mapping in rhodopsin reveals the pattern of helix movement due to activation. Proc Natl Acad Sci U S A. 2008;105:7439–7444. doi: 10.1073/pnas.0802515105. [DOI] [PMC free article] [PubMed] [Google Scholar]
- 26.Fung BK, Hurley JB, Stryer L. Flow of information in the light-triggered cyclic nucleotide cascade of vision. Proc Natl Acad Sci U S A. 1981;78:152–156. doi: 10.1073/pnas.78.1.152. [DOI] [PMC free article] [PubMed] [Google Scholar]
- 27.Gilman AG. G-Proteins - Transducers of Receptor-Generated Signals. Annual Review of Biochemistry. 1987;56:615–649. doi: 10.1146/annurev.bi.56.070187.003151. [DOI] [PubMed] [Google Scholar]
- 28.Downes GB, Gautam N. The G protein subunit gene families. Genomics. 1999;62:544–552. doi: 10.1006/geno.1999.5992. [DOI] [PubMed] [Google Scholar]
- 29.Oldham WM, Van Eps N, Preininger AM, Hubbell WL, Hamm HE. Mechanism of the receptor-catalyzed activation of heterotrimeric G proteins. Nature Structural & Molecular Biology. 2006;13:772–777. doi: 10.1038/nsmb1129. [DOI] [PubMed] [Google Scholar]
- 30.Tesmer JJ, Sunahara RK, Gilman AG, Sprang SR. Crystal structure of the catalytic domains of adenylyl cyclase in a complex with Gsalpha, GTPgammaS. Science. 1997;278:1907–1916. doi: 10.1126/science.278.5345.1907. [DOI] [PubMed] [Google Scholar]
- 31.Coleman DE, Berghuis AM, Lee E, Linder ME, Gilman AG, Sprang SR. Structures of active conformations of Gi alpha 1 and the mechanism of GTP hydrolysis. Science. 1994;265:1405–1412. doi: 10.1126/science.8073283. [DOI] [PubMed] [Google Scholar]
- 32.Mixon MB, Lee E, Coleman DE, Berghuis AM, Gilman AG, Sprang SR. Tertiary and quaternary structural changes in Gi alpha 1 induced by GTP hydrolysis. Science. 1995;270:954–960. doi: 10.1126/science.270.5238.954. [DOI] [PubMed] [Google Scholar]
- 33.Wall MA, Coleman DE, Lee E, Iniguez-Lluhi JA, Posner BA, Gilman AG, Sprang SR. The structure of the G protein heterotrimer Gi alpha 1 beta 1 gamma 2. Cell. 1995;83:1047–1058. doi: 10.1016/0092-8674(95)90220-1. [DOI] [PubMed] [Google Scholar]
- 34.Coleman DE, Sprang SR. Crystal structures of the G protein Gi alpha 1 complexed with GDP and Mg2+: a crystallographic titration experiment. Biochemistry. 1998;37:14376–14385. doi: 10.1021/bi9810306. [DOI] [PubMed] [Google Scholar]
- 35.Denker BM, Schmidt CJ, Neer EJ. Promotion of the GTP-liganded state of the Go alpha protein by deletion of the C terminus. J Biol Chem. 1992;267:9998–10002. [PubMed] [Google Scholar]
- 36.Denker BM, Boutin PM, Neer EJ. Interactions between the amino- and carboxyl-terminal regions of G alpha subunits: analysis of mutated G alpha o/G alpha i2 chimeras. Biochemistry. 1995;34:5544–5553. doi: 10.1021/bi00016a028. [DOI] [PubMed] [Google Scholar]
- 37.Grishina G, Berlot CH. A surface-exposed region of G(salpha) in which substitutions decrease receptor-mediated activation and increase receptor affinity. Mol Pharmacol. 2000;57:1081–1092. [PubMed] [Google Scholar]
- 38.Preininger AM, Parello J, Meier SM, Liao G, Hamm HE. Receptor-mediated changes at the myristoylated amino terminus of Galpha(il) proteins. Biochemistry. 2008;47:10281–10293. doi: 10.1021/bi800741r. [DOI] [PMC free article] [PubMed] [Google Scholar]
- 39.Kisselev OG, Ermolaeva MV, Gautam N. A farnesylated domain in the G protein gamma subunit is a specific determinant of receptor coupling. J Biol Chem. 1994;269:21399–21402. [PubMed] [Google Scholar]
- 40.Martin EL, Rens-Domiano S, Schatz PJ, Hamm HE. Potent peptide analogues of a G protein receptor-binding region obtained with a combinatorial library. J Biol Chem. 1996;271:361–366. doi: 10.1074/jbc.271.1.361. [DOI] [PubMed] [Google Scholar]
- 41.Rasenick MM, Watanabe M, Lazarevic MB, Hatta S, Hamm HE. Synthetic peptides as probes for G protein function. Carboxyl-terminal G alpha s peptides mimic Gs and evoke high affinity agonist binding to beta-adrenergic receptors. J Biol Chem. 1994;269:21519–21525. [PubMed] [Google Scholar]
- 42.Taylor JM, Jacob-Mosier GG, Lawton RG, Remmers AE, Neubig RR. Binding of an alpha 2 adrenergic receptor third intracellular loop peptide to G beta and the amino terminus of G alpha. J Biol Chem. 1994;269:27618–27624. [PubMed] [Google Scholar]
- 43.Taylor JM, Jacob-Mosier GG, Lawton RG, VanDort M, Neubig RR. Receptor and membrane interaction sites on Gbeta. A receptor-derived peptide binds to the carboxyl terminus. J Biol Chem. 1996;271:3336–3339. doi: 10.1074/jbc.271.7.3336. [DOI] [PubMed] [Google Scholar]
- 44.Itoh Y, Cai K, Khorana HG. Mapping of contact sites in complex formation between light-activated rhodopsin and transducin by covalent crosslinking: use of a chemically preactivated reagent. Proc Natl Acad Sci U S A. 2001;98:4883–4887. doi: 10.1073/pnas.051632998. [DOI] [PMC free article] [PubMed] [Google Scholar]
- 45.Cai K, Itoh Y, Khorana HG. Mapping of contact sites in complex formation between transducin and light-activated rhodopsin by covalent crosslinking: use of a photoactivatable reagent. Proc Natl Acad Sci U S A. 2001;98:4877–4882. doi: 10.1073/pnas.051632898. [DOI] [PMC free article] [PubMed] [Google Scholar]
- 46.Lichtarge O, Bourne HR, Cohen FE. Evolutionarily conserved Galphabetagamma binding surfaces support a model of the G protein-receptor complex. Proc Natl Acad Sci U S A. 1996;93:7507–7511. doi: 10.1073/pnas.93.15.7507. [DOI] [PMC free article] [PubMed] [Google Scholar]
- 47.Onrust R, Herzmark P, Chi P, Garcia PD, Lichtarge O, Kingsley C, Bourne HR. Receptor and betagamma binding sites in the alpha subunit of the retinal G protein transducin. Science. 1997;275:381–384. doi: 10.1126/science.275.5298.381. [DOI] [PubMed] [Google Scholar]
- 48.Marin EP, Krishna AG, Sakmar TP. Disruption of the alpha5 helix of transducin impairs rhodopsin-catalyzed nucleotide exchange. Biochemistry. 2002;41:6988–6994. doi: 10.1021/bi025514k. [DOI] [PubMed] [Google Scholar]
- 49.Preininger AM, Funk MA, Oldham WM, Meier SM, Johnston CA, Adhikary S, Kimple AJ, Siderovski DP, Hamm HE, Iverson TM. Helix Dipole Movement and Conformational Variability Contribute to Allosteric GDP Release in G alpha(i) Subunits. Biochemistry. 2009;48:2630–2642. doi: 10.1021/bi801853a. [DOI] [PMC free article] [PubMed] [Google Scholar]
- 50.Cherfils J, Chabre M. Activation of G-protein G alpha subunits by receptors through G alpha-G beta and G alpha-G gamma interactions. Trends in Biochemical Sciences. 2003;28:13–17. doi: 10.1016/s0968-0004(02)00006-3. [DOI] [PubMed] [Google Scholar]
- 51.Rondard P, Liu J, Huang S, Malhaire F, Vol C, Pinault A, Labesse G, Pin JP. Coupling of agonist binding to effector domain activation in metabotropic glutamate-like receptors. J Biol Chem. 2006;281:24653–24661. doi: 10.1074/jbc.M602277200. [DOI] [PubMed] [Google Scholar]
- 52.Rasmussen SG, Choi HJ, Fung JJ, Pardon E, Casarosa P, Chae PS, Devree BT, Rosenbaum DM, Thian FS, Kobilka TS, Schnapp A, Konetzki I, Sunahara RK, Gellman SH, Pautsch A, Steyaert J, Weis WI, Kobilka BK. Structure of a nanobody-stabilized active state of the beta(2) adrenoceptor. Nature. 2011;469:175–180. doi: 10.1038/nature09648. [DOI] [PMC free article] [PubMed] [Google Scholar]
- 53.Rasmussen SG, Devree BT, Zou Y, Kruse AC, Chung KY, Kobilka TS, Thian FS, Chae PS, Pardon E, Calinski D, Mathiesen JM, Shah ST, Lyons JA, Caffrey M, Gellman SH, Steyaert J, Skiniotis G, Weis WI, Sunahara RK, Kobilka BK. Crystal structure of the beta(2) adrenergic receptor-Gs protein complex. Nature. 2011 doi: 10.1038/nature10361. [DOI] [PMC free article] [PubMed] [Google Scholar]
- 54.Okada T, Sugihara M, Bondar AN, Elstner M, Entel P, Buss V. The retinal conformation and its environment in rhodopsin in light of a new 2.2 A crystal structure. J Mol Biol. 2004;342:571–583. doi: 10.1016/j.jmb.2004.07.044. [DOI] [PubMed] [Google Scholar]
- 55.Choe HW, Kim YJ, Park JH, Morizumi T, Pai EF, Krauss N, Hofmann KP, Scheerer P, Ernst OP. Crystal structure of metarhodopsin II. Nature. 2011;471:651–655. doi: 10.1038/nature09789. [DOI] [PubMed] [Google Scholar]
- 56.James GT. Inactivation of the protease inhibitor phenylmethylsulfonyl fluoride in buffers. Anal Biochem. 1978;86:574–579. doi: 10.1016/0003-2697(78)90784-4. [DOI] [PubMed] [Google Scholar]
- 57.Kaya AI, Thaker TM, Preininger AM, Iverson TM, Hamm HE. Coupling efficiency of rhodopsin and transducin in bicelles. Biochemistry. 2011;50:3193–3203. doi: 10.1021/bi200037j. [DOI] [PMC free article] [PubMed] [Google Scholar]


