

Abstract
There is an increasing interest in the potential of exhaled biomarkers, such as volatile organic compounds (VOCs), to improve accurate diagnoses and management decisions in pulmonary diseases. The objective of this manuscript is to systematically review the current knowledge on exhaled VOCs with respect to their potential clinical use in asthma, lung cancer, chronic obstructive pulmonary disease (COPD), cystic fibrosis (CF), and respiratory tract infections. A systematic literature search was performed in PubMed, EMBASE, Cochrane database, and reference lists of retrieved studies. Controlled, clinical, English-language studies exploring the diagnostic and monitoring value of VOCs in asthma, COPD, CF, lung cancer and respiratory tract infections were included. Data on study design, setting, participant characteristics, VOCs techniques, and outcome measures were extracted. Seventy-three studies were included, counting in total 3,952 patients and 2,973 healthy controls. The collection and analysis of exhaled VOCs is non-invasive and could be easily applied in the broad range of patients, including subjects with severe disease and children. Various research groups demonstrated that VOCs profiles could accurately distinguish patients with a pulmonary disease from healthy controls. Pulmonary diseases seem to be characterized by a disease specific breath-print, as distinct profiles were found in patients with dissimilar diseases. The heterogeneity of studies challenged the inter-laboratory comparability. In conclusion, profiles of VOCs are potentially able to accurately diagnose various pulmonary diseases. Despite these promising findings, multiple challenges such as further standardization and validation of the diverse techniques need to be mastered before VOCs can be applied into clinical practice.
Keywords: VOCs, Asthma, COPD, Lung cancer, Cystic fibrosis, Airway inflammation, Biomarkers
Review
Introduction
Background and aim
Pulmonary diseases are important causes of morbidity in both adults and children [1,2]. The diverse pulmonary diseases go along with clinical challenges. In adults, lung cancer is one of the leading causes of death worldwide. It is often diagnosed at an advanced stage when successful treatment is difficult [3]. Furthermore, chronic obstructive pulmonary disease (COPD) and asthma are prevalent lung diseases that account for a major burden on society in terms of morbidity and health care costs. Early diagnosis and close monitoring of both diseases are important for proper treatment decisions, optimal disease control and prognosis. However, the available clinical tools are not always fulfilling. In young children, a reliable asthma diagnosis is difficult as there are no tools available to discriminate between true asthmatics and children with transient, virus-induced symptoms. On account of these clinical challenges, there is a continuous search for techniques that can improve accurate diagnoses and management decisions. A potential non-invasive technique is the analysis of volatile biomarkers in exhaled breath, so called volatile organic compounds (VOCs). In this manuscript we systematically review the current knowledge on VOCs regarding their potential clinical use in pulmonary diseases.
The origin of exhaled volatile organic compounds
Asthma, COPD, Cystic Fibrosis (CF), and lung cancer are characterized by inflammation and oxidative stress. Monitoring of airway inflammation and oxidative stress can be helpful in the diagnosis and monitoring of these diseases. Current available techniques to directly measure inflammation and oxidative stress in the airways are bronchoscopy, bronchoalveolar lavage and biopsy. These techniques are too invasive for repeated routine use, especially in children. The need for non-invasive analysis of inflammation and oxidative stress in the lungs has led to increasing interest in exhaled breath analysis (Figure 1). Fractional exhaled Nitric Oxide (FeNO) is the most extensively studied marker in exhaled breath. Although the analysis of FeNO might be a helpful clinical tool in some pulmonary diseases, it has several limitations. For example in asthma, FeNO is especially a marker of allergic inflammation and therefore of limited use in non-allergic patients [4]. Consequently, additional exhaled biomarkers were studied. Next to non-volatile biomarkers that can be assessed in exhaled breath condensate, the analysis of exhaled VOCs gained popularity. VOCs are a diverse group of carbon-based chemicals that are volatile at room temperature. The source of exhaled VOCs can be exogenous or endogenous. Some VOCs can be taken up as pollutants from the environment via the skin or by inhalation or ingestion. Subsequently, these compounds are metabolized and exhaled. Other VOCs are formed in the body during several (patho)physiological processes [5,6]. An important group of endogenously formed VOCs are hydrocarbons that are formed by lipid peroxidation. During the inflammatory process, Reactive Oxygen Species (ROS) are produced by inflammatory cells. Subsequently, ROS react with lipid membrane structures and cause degradation of polyunsaturated fatty acids. As a result several stable breakdown products including hydrocarbons are formed [5,6]. Besides hydrocarbons, other VOCs can be identified, including nitrogen, oxygen or sulphur containing compounds. These VOCs can be formed by bacteria or during (patho)physiological processes in the liver, kidneys, and pancreas [5,6]. As soon as VOCs are formed, they are either further oxidized into smaller components due to enhanced activity of enzymes (such as cytochrome P450 oxidase), or they directly enter the bloodstream [7]. Subsequently, VOCs are excreted into breath. Early findings of distinct VOCs in diseased people (e.g. with diabetes or cirrhosis) compared to healthy controls stimulated investigators to elucidate the clinical potential of exhaled VOCs in pulmonary diseases [5]. Since exhaled VOCs are formed during inflammatory processes, the analysis of VOCs may be a promising non-invasive technique to directly monitor inflammation and oxidative stress in the airways. This information might be of help in the diagnosis and monitoring of pulmonary diseases.
Figure 1.

Techniques to assess airway inflammation and oxidative stress. There are various methods to measure airway inflammation and oxidative stress ranging from completely non-invasive (exhaled breath analysis) to very invasive (open lung biopsy).
Technical analysis of exhaled breath
There are multiple techniques described to collect, detect, and analyze exhaled VOCs [6,8,9]. The most commonly used techniques are gas chromatography (GC), which is the gold standard, and the electronic nose (eNose). With the GC-technique, exhaled breath is firstly collected and temporarily stored (e.g. in inert bags or sorption tubes). After a desorption phase, individual VOCs can be assessed by GC usually followed by mass spectrometry (GC-MS) or flame ionization detection (GC-FID) [6]. The diverse VOCs are first separated based on their chemical properties and consecutively ionized and separated by their mass-to-charge (m/z) ratio (Figure 2). Breath samples can also be analyzed using an eNose [9]. The eNose consists of an array of nanosensors. When these sensors are exposed to a mixture of VOCs, a change in their electrical resistance is induced, leading to the production of a ‘breath-print’ (Figure 3). This breath-print represents the complex mixture of exhaled VOCs and can be used for pattern-recognition algorithms in multiple diseases [10-13]. A limitation of the eNose is that it is unable to analyze individual VOCs. In addition to GC and the eNose, other techniques that are used to study VOCs in pulmonary diseases include; proton transfer reaction mass spectrometry (PTR-MS), selected ion flow tube mass spectrometry (SIFT-MS), ion mobility spectrometry (IMS), laser spectroscopy, colorimetric sensor array, and gold nano particles sensors (GNPs).
Figure 2.
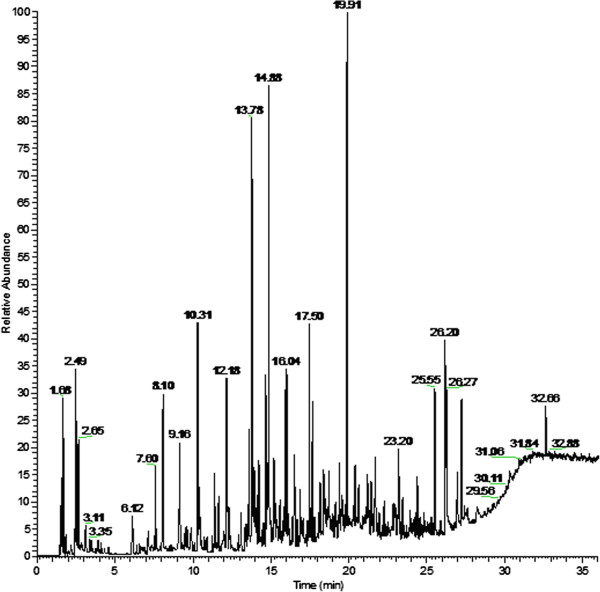
Breath-print of VOCs by gas chromatography. With the gas chromatography (GC) technique, exhaled breath is collected and temporarily stored in e.g. gas-tight syringes, glass bulbs, inert bags, or metal containers. Once the VOCs are collected and temporarily trapped, they can be released for analysis. This is often performed by solvent or thermal desorption. Subsequently, the analysis of individual molecular components can be assessed by GC usually followed by mass spectrometry (GC-MS) or flame ionization detection (GC-FID). The diverse VOCs are separated and quantified by using their specific compound characteristics. Distinct VOCs have dissimilar progression rates and reach the end of the GC column at different time points; the retention time. Based on their retention time, VOCs can be identified in a mass-spectra library. The figure demonstrates an example of a chromatogram of a breath sample analyzed with GC. The retention time (in minutes) is stated on the x axis, while the y axis shows the relative abundance of various compound signals. Published in Robroeks et al. Pediatr Res 2010 [14].
Figure 3.

Breath-print of VOCs by the electronic Nose. Breath samples can also be analyzed using an eNose. The eNose consists of an array of nanosensors. When these sensors are exposed to a mixture of VOCs, a change in their electrical resistance is induced, leading to the production of a ‘breath-print’. This breath-print represents the complex mixture of exhaled VOCs and can be used for pattern-recognition algorithms in multiple diseases. A limitation of the eNose is that it is unable to analyze individual VOCs. In the figure two exhaled breath-prints analyzed with the eNose are demonstrated (purple line represents sample 1, green line represents sample 2). The y axis represents the change in resistance (Δ R/Rt = 0) of each of the 28 sensors (1–28). Courtesy: Paul Brinkman, Niki Fens, Peter Sterk, University of Amsterdam, the Netherlands.
Materials and methods
Data sources and search criteria
A systematic literature search was performed until July 2012 in PubMed, EMBASE, and the Cochrane Central Register of Controlled trials. Keywords/Mesh terms included: asthma, chronic obstructive pulmonary disease, COPD, cystic fibrosis, lung cancer, pulmonary disease, respiratory infection, combined with: volatile organic compounds, VOC, VOCs, exhaled breath or electronic nose. Reference lists were reviewed for additional references.
Study selection and data extraction
Figure 4 illustrates a flow-chart of the study selection [16]. Controlled, clinical studies, with full text in English, exploring the diagnostic and monitoring value of VOCs in asthma, COPD, CF, lung cancer and respiratory tract infections were included. In vitro studies were excluded. Data on study design, setting, participant characteristics, VOCs techniques, and outcome measures were extracted. Due to expected heterogeneity of studies, no single scale was used for excluding studies on basis of quality. Instead, per study, criteria that are of importance to examine the validity are described in Table 1.
Figure 4.

Flow-chart of literature search. Summary of evidence search and selection according to the Prisma flow-chart [16]. Abbreviations: VOCs = Volatile Organic Compounds.
Table 1.
Characteristics of included studies on VOCs in pulmonary diseases
| Author (year) | Design | Comparison | Sample size | Setting | Technique | Outcome measure | Ref. |
|---|---|---|---|---|---|---|---|
| Caldeira (2011) |
Cross-sectional |
Asthma vs. controls |
35 children with asthma, 15 healthy controls |
Hospital D. Pedro, Aveiro (Portugal) |
GC-MS |
Set of 44 VOCs |
[17] |
| Caldeira (2012) |
Cross-sectional |
Asthma vs. controls |
32 children with allergic asthma, 27 healthy controls |
Hospital D. Pedro, Aveiro (Portugal) |
GC-MS |
VOCs profile |
[18] |
| Dallinga (2010) |
Cross-sectional |
Asthma vs. controls |
63 children with asthma, 57 healthy controls |
Maastricht University MC |
GC-MS |
VOCs profile |
[19] |
| (the Netherlands) | |||||||
| Dragonieri (2007) |
Cross-sectional |
Asthma vs. controls |
10 patients with mild asthma, 10 patients with severe asthma, 20 healthy controls |
Leiden University MC (the Netherlands) |
eNose |
VOCs profile |
[10] |
| Ibrahim (2011) |
Cross-sectional |
Asthma vs. controls |
35 patients with asthma, 23 healthy controls |
Wythenshawe Hospital, Manchester (UK) |
GC-MS |
VOCs profile |
[20] |
| Lärstad (2007) |
Cross-sectional |
Asthma vs. controls |
13 patients with asthma, 14 healthy controls |
Göteborg University (Sweden) |
GC-FID |
Ethane, Pentane, Isoprene |
[21] |
| Montuschi (2010) |
Cross-sectional |
Asthma vs. controls |
27 patients with asthma, 24 healthy controls |
Istituto Dermopatico dell’ Immacolata, Rome (Italy) |
eNose, GC-MS |
VOCs profile |
[22] |
| Olopade (1997) |
Cross-sectional Short follow-up in acute asthma |
Asthma vs. controls |
12 patients with acute asthma, 11 patients with stable asthma, 17 healthy controls |
University of Ilinois Hospital, Chicago (USA) |
GC-FID |
Pentane |
[23] |
| Paredi (2000) |
Cross-sectional |
Asthma vs. controls |
26 patients with asthma, 14 healthy controls |
National Heart and Lung Institute, Imperial College, London (UK) |
GC-FID |
Ethane |
[24] |
| Basanta (2010) |
Cross-sectional |
COPD vs. smokers |
20 patients with COPD, 6 healthy smokers |
Wytenshawe Hospital, Manchester (UK) |
GC-DMS |
VOCs profile |
[25] |
| Cristescu (2011) |
Cross-sectional |
Emphysema vs. No emphysema |
204 (former) smokers (43 with emphysema/COPD) |
Radboud University, Nijmegen (the Netherlands) |
PTR-MS |
Mass-spectra |
[26] |
| Fens (2009) |
Cross-sectional |
COPD vs. asthma vs. controls |
30 patients with COPD, 20 patients with asthma, 20 non-smoking controls, 20 smoking controls |
Academic MC Amsterdam; Haga Teaching Hospital, The Hague; Albert Schweitzer Hospital, Dordrecht (the Netherlands) |
eNose |
VOCs profile |
[15] |
| Fens (2011) |
Cross-sectional |
COPD vs. asthma |
40 patients with COPD, 21 patients with fixed asthma, 39 patients with classic asthma |
Academic MC Amsterdam; Haga Teaching Hospital, The Hague; Albert Schweitzer Hospital, Dordrecht (the Netherlands) |
eNose |
VOCs profile |
[27] |
| Hattesohl (2011) |
Cross-sectional Follow up after treatment |
COPD vs. controls |
10 patients with COPD with AAT deficiency, 23 patients with COPD without AAT deficiency, 10 healthy controls |
Phillipps University, Marburg (Germany) |
eNose |
VOCs profile |
[28] |
| Hauschild (2012) |
Cross-sectional |
COPD vs. controls |
30 patients with COPD, 54 patients with COPD + BC, 35 healthy controls |
Max Planck Institute for Informatics, Saarbrücken (Germany) |
IMS |
VOCs profile |
[29] |
| Paredi (2000) |
Cross-sectional |
COPD vs. controls |
22 patients with COPD, 14 healthy controls |
National Heart and Lung Institute, Imperial College, London (UK) |
GC-FID |
Ethane |
[30] |
| Phillips (2012) |
Cross-sectional |
COPD vs. controls |
119 patients with COPD, 63 healthy controls |
Swansea University, Swansea (UK) |
GC-MS |
VOCs profile |
[31] |
| Timms (2012) |
Cross-sectional |
COPD vs. asthma vs. controls |
17 patients with COPD, 20 patients with asthma, 7 healthy controls |
University of New South Wales, Sydney (Australia) |
eNose |
VOCs profile |
[32] |
| Van Berkel (2010) |
Cross-sectional |
COPD vs. controls |
66 patients with COPD, 15 steroid naïve COPD patients, 45 healthy controls |
Maastricht University MC (the Netherlands) |
GC-MS |
VOCs profile |
[33] |
| Barker (2006) |
Cross-sectional |
CF vs. controls |
20 patients with CF, 20 healthy controls |
Aachen CF center (Germany) |
GC-MS |
Set of 12 VOCs |
[34] |
| Enderby (2009) |
Cross-sectional |
CF vs. asthma |
16 patients with CF, 21 patients with asthma |
University Hospital of North Staffordshire,Stoke-on-Trent (UK) |
SIFT-MS |
Hydrogen cyanide |
[35] |
| Gilchrist (2012) |
Cross-sectional |
CF with- vs. CF without Ps. infection |
8 CF patients with Ps. infection, 7 CF patients without Ps. infection |
University Hospital of North Staffordshire,Stoke-on-Trent (UK) |
SIFT-MS |
Hydrogen cyanide |
[36] |
| Kamboures (2005) |
Cross-sectional |
CF vs. controls |
20 patients with CF, 23 healthy controls |
University of California, Irvine (USA) |
GC-MS |
Carbonyl sulphide, Dimethyl sulphide, Carbon disulphide |
[37] |
| McGrath (2000) |
Cross-sectional Follow up after treatment |
CF during- vs. CF after exacerbation vs. controls |
12 patients with CF, 12 healthy controls |
Queen’s University, Belfast (UK) |
GC-MS |
Isoprene |
[38] |
| Paredi (2000) |
Cross-sectional |
CF vs. controls |
23 patients with CF, 14 healthy controls |
National Heart and Lung Institute, Imperial College, London (UK) |
GC-FID |
Ethane |
[39] |
| Robroeks (2010) |
Cross-sectional |
CF vs. controls |
48 patients with CF, 57 healthy controls |
Maastricht University MC (the Netherlands) |
GC-MS |
VOCs profile |
[14] |
| Shestivska (2011) |
Cross-sectional |
CF vs. controls |
28 patients with CF, 9 healthy controls |
Academy of Science of the Czech Republic, Prague (Czech Republic) |
GC-MS |
Methyl thiocyanate |
[40] |
| Bajtarevic (2009) |
Cross-sectional |
LC vs. controls |
285 patients with LC, 472 healthy controls |
Innsbruck Medical University (Austria) |
PTR-MS, GC-MS |
VOCs profile |
[41] |
| Buszewski (2012) |
Cross-sectional |
LC vs. controls |
29 patients with LC, 44 healthy controls |
Nicolaus Copernicus University, Torun (Poland) |
GC-MS |
Set of multiple VOCs |
[42] |
| Crohns (2009) |
Cross-sectional Follow up after treatment |
LC vs. controls |
11 patients with LC, 30 healthy controls |
Tampere University Hospital (Finland) |
GC-MS |
Pentane |
[43] |
| D’Amico (2010) |
Cross-sectional |
LC vs. no LC vs. controls |
28 patients with LC, 28 patients with diverse lung diseases (e.g. COPD (n = 16), bronchitis), 36 healthy controls |
C. Forlanini Hospital, Rome (Italy) |
eNose (GC-MS) |
VOCs profile |
[44] |
| Di Natale (2003) |
Cross-sectional |
LC vs. controls |
35 patients with LC, 9 post-surgical LC patients, 18 healthy controls |
C. Forlanini Hospital, Rome (Italy) |
eNose (GC-MS) |
VOCs profile |
[11] |
| Dragonieri (2009) |
Cross-sectional |
LC vs. COPD vs. controls |
10 patients with NSCLC, 10 patients with COPD, 10 healthy controls |
Leiden University MC (the Netherlands) |
eNose |
VOCs profile |
[12] |
| Fuchs (2010) |
Cross-sectional |
LC vs. controls |
12 patients with LC, 12 healthy smokers, 12 healthy controls |
University Rostock (Germany) |
GC-MS |
Set of 10 volatile aliphatic aldehydes |
[45] |
| Gaspar (2009) |
Cross-sectional |
LC vs. controls |
18 patients with LC, 10 healthy controls |
University of Lisbon (Portugal) |
GC-MS |
VOCS profile |
[46] |
| Gordon (1985) |
Cross-sectional |
LC vs. controls |
12 patients with LC, 9 healthy controls |
Michael Reese Hospital, Chicago (USA) |
GC-MS |
Set of 22 VOCs |
[47] |
| Kischkel (2010) |
Cross-sectional |
LC vs. controls |
31 patients with LC, 31 healthy smokers, 31 healthy controls |
University of Rostock (Germany) |
GC-MS |
Set of 42 VOCs |
[48] |
| Ligor (2009) |
Cross-sectional |
LC vs. controls |
65 patients with LC, 31 healthy controls |
Innsbruck Medical University (Austria) |
GC-MS |
Set of 103 VOCs |
[49] |
| Machado (2005) |
Cross-sectional |
LC vs. no LC vs. controls |
28 patients with LC, 57 patients with diverse lung diseases (e.g. COPD (n = 12), asthma (n = 11), CBD), 50 healthy controls |
Cleveland Clinic (USA) |
eNose (GC-MS) |
VOCs profile |
[13] |
| Mazzone (2007) |
Cross-sectional |
LC vs. no LC vs. controls |
49 patients with NSCLC, 73 patients with diverse lung diseases (e.g. COPD (n = 18), sarcoidosis), 21 healthy controls |
Cleveland Clinic (USA) |
Colorimetric sensor array |
VOCs profile |
[50] |
| Mazzone (2012) |
Cross-sectional |
LC vs. controls |
92 patients with LC, 59 healthy smokers, 78 patients with diverse lung diseases (e.g. COPD (n = 8)) |
Cleveland Clinic (USA) |
Colorimetric sensor array |
VOCs profile |
[51] |
| Peng (2009) |
Cross-sectional |
LC vs. controls |
40 patients with LC, 56 healthy controls |
Rambam Health Care Campus, Haifa (Israel) |
GNPs GC-MS |
VOCs profile |
[52] |
| Peng (2010) |
Cross-sectional |
LC vs. controls |
30 patients with PLC, 22 healthy controls |
Rambam Health Care Campus, Haifa (Israel) |
GNPs GC-MS |
VOCs profile |
[53] |
| Phillips (1999) |
Cross-sectional |
LC vs. no LC |
108 patients with abnormal chest radiograph (60 patients with LC) |
Penn State MC, Hershey (USA); Hammersmith Hospital, London (UK); St. Vincent’s MC, New York (USA) |
GC-MS |
VOCs profile |
[54] |
| Phillips (2003) |
Cross-sectional |
LC vs. no LC vs. controls |
178 patients with abnormal chest radiograph (87 patients with LC), 41 healthy controls |
Charing Cross Hospital, London (UK); Columbia Presbyterian MC/New York University MC/St. Vincent’s MC, New York (USA); Penn State MC, Hershey (USA) |
GC-MS |
VOCs profile |
[7] |
| Phillips (2007–2008) |
Cross-sectional |
LC vs. controls |
193 patients with PLC, 211 (former) healthy smokers |
Harper Hospital, Detroit; New York University MC/Columbia University MC/Weill Medical College of Cornell University, New York (USA); University of California, Los Angeles; Danbury Hospital, Connecticut (USA). |
GC-MS |
VOCs profile |
[55], [56] |
| Poli (2005) |
Cross-sectional Short follow-up in LC |
LC vs. COPD vs. controls |
36 patients with NSCLC, 25 patients with COPD, 35 healthy smokers, 50 healthy non-smokers |
University of Parma (Italy) |
GC-MS |
Set of 13 VOCs |
[57] |
| Poli (2008) |
Follow-up |
LC before vs. after surgery |
36 patients with NSCLC, 50 healthy controls |
University of Parma (Italy) |
GC-MS |
Set of 12 VOCs |
[58] |
| Poli (2010) |
Cross-sectional |
LC vs. controls |
40 patients with NSCLC, 38 healthy controls |
University of Parma (Italy) |
GC-MS |
Set of 7 aldehydes |
[59] |
| Preti (1988) |
Cross-sectional |
LC vs. controls |
10 patients with LC, 16 healthy controls |
University Hospital Pennsylvania, Philadelphia (USA) |
GC-MS |
Aniline, o-Toluidine |
[60] |
| Rudnicka (2011) |
Cross-sectional |
LC vs. controls |
23 patients with LC, 30 healthy controls |
Nicolaus Copernicus University, Torun (Poland) |
GC-MS |
Set of 55 VOCs |
[61] |
| Skeldon (2006) |
Cross-sectional |
LC vs. no LC vs. controls |
12 patients with LC, 40 patients with diverse lung diseases, 58 healthy controls |
Ninewells Hospital, Dundee (UK) |
Laser absorption spectroscopy |
Ethane |
[62] |
| Song (2010) |
Cross-sectional |
LC vs. controls |
43 patients with NSCLC, 41 healthy controls |
Anhui Medical University, Hefei, Anhui (China) |
GC-MS |
1-butanol, 3-hydroxy-2-butanone |
[63] |
| Steeghs (2007) |
Cross-sectional |
LC vs. controls |
11 patients with LC, 57 healthy smokers |
Radboud University, Nijmegen (the Netherlands) |
PTR-MS |
Mass-spectra |
[64] |
| Ulanowska (2011) |
Cross-sectional |
LC vs. controls |
137 patients with LC, 143 healthy controls |
Nicolaus Copernicus University, Torun (Poland) |
GC-MS |
VOCs profile |
[65] |
| Wehinger (2007) |
Cross-sectional |
LC vs. controls |
17 patients with PLC, 170 healthy controls |
Innsbruck Medical University (Austria) |
PTR-MS |
Mass-spectra |
[66] |
| Westhoff (2009) |
Cross-sectional |
LC vs. controls |
32 patients with LC, 54 healthy controls |
Hemer Lung Hospital (Germany) |
IMS |
VOCs profile |
[67] |
| Chapman (2012) |
Cross-sectional |
MPM vs. ARD vs. controls |
20 patients with MPM, 18 patients with ARD, 42 healthy controls |
St Vincent and Prince of Wales Hospital, Sydney (Australia) |
eNose |
VOCs profile |
[68] |
| Gennaro (2010) Dragonieri (2012) |
Cross-sectional |
MPM vs. no MPM |
13 patients with MPM, 13 subjects with long-term asbestos exposure, 13 healthy controls |
University of Bari Aldo Moro, Bari (Italy) |
eNose, GC-MS |
VOCs profile |
[69], [70] |
| Chambers (2009) |
Cross-sectional |
A. fumigatus vs. controls |
32 patients with diverse lung diseases (e.g. asthma (n = 11), CF (n = 6), COPD (n = 3), 10 neutropenic patients, 14 healthy controls |
University of Christchurch (New Zealand) |
GC-MS |
2-Pentylfuran |
[71] |
| Hanson (2005) |
Cross-sectional |
VAP vs. no VAP |
19 patients with + VAP score, 19 patients with - VAP score |
University of Pennsylvania, Philadelphia (USA) |
eNose |
VOCs profile |
[72] |
| Hockstein (2004) |
Cross-sectional |
VAP vs. no VAP |
13 ventilated patients with VAP, 12 ventilated patients without VAP |
University of Pennsylvania, Philadelphia (USA) |
eNose |
VOCs profile |
[73] |
| Hockstein (2005) |
Cross-sectional |
VAP vs. no VAP |
15 patients with + VAP score, 29 patients with - VAP score |
University of Pennsylvania, Philadelphia (USA) |
eNose |
VOCs profile |
[74] |
| Kanoh (2005) |
Cross-sectional Short follow-up in ILD patients |
ILD vs. controls |
34 patients with ILD, 16 healthy controls |
National Defense Medical College, Saitama (Japan) |
GC-FID |
Ethane |
[75] |
| Kolk (2012) |
Cross-sectional |
TB vs. no TB |
171 patients suspected of TB |
Royal Tropical Institute, Amsterdam (the Netherlands); Desmond Tutu TB Centre, Cape Town (South Africa) |
GC-MS |
VOCs profile |
[76] |
| Phillips (2007) |
Cross-sectional |
TB vs. no TB vs. controls |
42 patients suspected of TB, 59 healthy controls |
Bellevue Hospital, New York (USA) |
GC-MS |
VOCs profile |
[77] |
| Phillips (2010) |
Cross-sectional |
TB vs. no TB |
226 patients suspected of TB |
University of California, San Diego (USA); University of Santo Tomas, Manila (Philippines), De La Salle University Hospital, Cavite (Philippines), East London Tuberculosis Service (UK) |
GC-MS |
VOCs profile |
[78] |
| Phillips (2012) |
Cross-sectional |
TB vs. controls |
130 patients with TB, 121 healthy controls |
University of Santo Tomas, Manila (Philippines); De La Salle University Hospital, Cavite (Philippines); Homerton University Hospital, London (UK); Hinduja Hospital, Mumbai (India) |
GC-SAW |
VOCs profile |
[79] |
| Syhre (2009) |
Cross-sectional |
TB vs. controls |
10 patients with TB, 10 healthy controls |
Otago University, Christchurch (New Zealand); Modilon Hospital, Madang (Papua New Guinea) |
GC-MS |
Methyl nicotinate |
[80] |
| Scholpp (2002) |
Cross-sectional |
Critically ill patients vs. controls |
65 critically ill patients (n = 19 with head injury, n = 13 with ARDS, n = 33 at risk of ARDS), 10 healthy controls |
University Hospital of Freiburg (Germany) |
GC-FID, GC-MS |
Acetone Isoprene, n-Pentane |
[81] |
| Schubert (1998) | Cross-sectional Short follow-up in VAP patients | ARDS vs. no ARDS | 19 critically ill patients with ARDS, 18 critically ill patients without ARDS | University Hospital of Freiburg (Germany) | GC-FID, GC-MS | Acetone Isoprene, n-Pentane | [82] |
Abbreviations: AAT deficiency = Alpha 1-antitrypsin deficiency; A. fumigatus = Aspergillus fumigatus; ARD = Benign Asbestos-Related Diseases; ARDS = Acute Respiratory Distress Syndrome; BC = Bronchial Carcinoma; CBD = Chronic pulmonary Beryllium Disease; CF = Cystic Fibrosis; Classic asthma = Asthmatics with reversible airway obstruction; COPD = Chronic Obstructive Pulmonary Disease; DMS = Differential Mobility Spectrometry; eNose = electronic Nose; FID = Flame Ionization Detector; Fixed asthma = Asthmatics with fixed airway obstruction; GC = Gas Chromatography; GNPs = Gold Nano Particles sensors; ILD = Interstitial Lung Disease (e.g. sarcoidosis, idiopathic pulmonary fibrosis, cryptogenic organizing pneumonia); IMS = Ion Mobility Spectrometry; LC = Lung Cancer; MC = Medical Centre; MPM = Malignant Pleural Mesothelioma; MS = Mass Spectrometry; NSCLC = Non-Small Cell Lung Cancer; OFD = On-Fiber-Derivatization; P. infection = Pseudomonas aeruginosa infection; PLC = Primary Lung Cancer; PTR-MS = Proton Transfer Reaction Mass Spectrometry; Ref. = Reference; SAW = surface acoustic wave; SIFT-MS = Selected Ion Flow Tube Mass Spectrometry; TB = pulmonary Tuberculosis; VAP = Ventilator Associated-Pneumonia; VOCs = Volatile Organic Compounds.
Data synthesis and analysis
Evidence data were pooled by study design; studies using: 1) single VOCs in diagnosing pulmonary diseases (Table 2); 2) VOCs profiles in diagnosing pulmonary diseases (Table 3); and 3) VOCs profiles in differential diagnosing pulmonary diseases (Table 4).
Table 2.
Studies using single VOCs for the diagnosis of various pulmonary diseases (diseased vs. healthy controls)
| Author (year) | Marker | Disease | N | Value | Unit | Diff. | Value marker | Unit | Controls | N | p-value | Ref. | |
|---|---|---|---|---|---|---|---|---|---|---|---|---|---|
| Lärstad (2007) |
Ethane |
Asthma |
13 |
N.S. |
|
= |
N.S. |
|
Controls |
14 |
p > 0.05 |
[21] |
|
| Pentane |
|
|
N.S. |
|
= |
N.S. |
|
|
|
p > 0.05 |
|||
| Isoprene |
|
|
113 |
ppb∞ |
< |
143 |
ppb∞ |
|
|
p < 0.05 |
|||
| Olopade (1997) |
Pentane |
Acute asthma |
12 |
8.4 ± 2.9 |
nmol/L* |
> |
2.6 ± 0.2 |
nmol/L* |
Controls |
17 |
p < 0.05 |
[23] |
|
| Pentane |
Stable asthma |
11 |
3.6 ± 0.4 |
nmol/L* |
= |
2.6 ± 0.2 |
nmol/L* |
Controls |
17 |
p > 0.05 |
|||
| Paredi (2000) |
Ethane** |
Steroid naïve asthma |
12 |
2.06 ± 0.30 |
ppb* |
> |
0.88 ± 0.09 |
ppb* |
Controls |
14 |
p < 0.01 |
[24] |
|
| Paredi (2000) |
Ethane** |
Steroid naïve COPD |
12 |
2.77 ± 0.25 |
ppb* |
> |
0.88 ± 0.09 |
ppb* |
Controls |
14 |
p < 0.05 |
[30] |
|
| Barker (2006) |
Pentane** |
CF |
20 |
0.36 (0.24-0.48) |
ppb# |
> |
0.21 (0.13-0.29) |
ppb# |
Controls |
20 |
p < 0.05 |
[34] |
|
| Dimethyl Sulphide** |
|
|
3.89 (2.24-5.54) |
ppb# |
< |
7.58 (5.73-9.43) |
ppb# |
|
|
p < 0.01 |
|||
| Ethane** |
|
|
0.39 (−0.04-0.82) |
ppb# |
= |
0.10 (−0.25-0.44) |
ppb# |
|
|
p > 0.05 |
|||
| Propane, methanol, ethanol, acetone, isoprene, benzene, toluene, limonene |
|
|
- |
|
= |
- |
|
|
|
p > 0.05 |
|||
| Kamboures (2005) |
Carbonyl sulphide** |
CF |
20 |
- 110 ± 60 |
pptv# |
> |
- 250 ± 20 |
pptv# |
Controls |
23 |
p < 0.001 |
[37] |
|
| Dimethyl sulphide |
|
|
4,780 ± 1,350 |
pptv# |
= |
3,920 ± 680 |
pptv# |
|
|
p > 0.05 |
|||
| Carbon sulphide** |
|
|
26 ± 38 |
pptv# |
> |
- 17 ± 15 |
pptv# |
|
|
p < 0.05 |
|||
| McGrath (2000) |
Isoprene |
CF during exacerbation |
12 |
125 ± 23 |
pmol·min·kg-1* |
< |
164 ± 20 |
pmol·min·kg-1* |
Controls |
12 |
p < 0.05 |
[38] |
|
| Isoprene |
CF after exacerbation |
12 |
188 ± 23 |
pmol·min·kg-1* |
= |
164 ± 20 |
pmol·min·kg-1* |
Controls |
12 |
p > 0.05 |
|||
| Paredi (2000) |
Ethane** |
Steroid naïve CF |
23 |
1.99 ± 0.20 |
ppb* |
> |
0.82 ± 0.09 |
ppb* |
Controls |
14 |
p < 0.05 |
[39] |
|
| Shestivska (2011) |
Methyl thiocyanate |
CF |
28 |
7 (2–21) |
ppbv~ |
= |
8 (5–8) |
ppbv°° |
Controls |
9 |
p > 0.05 |
[40] |
|
| Bajtarevic (2009) |
Isoprene |
LC |
220 |
81.5 |
ppb∞ |
< |
105.2 |
ppb∞ |
Controls |
441 |
p < 0.01 |
[41] |
|
| Acetone |
|
|
458.7 |
ppb∞ |
< |
627.5 |
ppb∞ |
|
|
p < 0.01 |
|||
| Methanol |
|
|
118.5 |
ppb∞ |
< |
142.0 |
ppb∞ |
|
|
p < 0.05 |
|||
| Buszewski (2012) |
Acetone |
LC |
29 |
34.57-390.60 |
ppb° |
? |
44.20-531.45 |
ppb° |
Controls |
44 |
p < 0.05 |
[42] |
|
| Benzene |
|
|
1.29-3.82 |
ppb° |
? |
1.38-14.97 |
ppb° |
|
|
p < 0.05 |
|||
| Butanal |
|
|
1.32-2.55 |
ppb° |
> |
1.35-1.87 |
ppb° |
|
|
p < 0.01 |
|||
| 2-Butanone |
|
|
1.35-2.86 |
ppb° |
? |
1.35-3.18 |
ppb° |
|
|
p < 0.01 |
|||
| Ethyl acetate |
|
|
3.98-22.89 |
ppb° |
> |
1.12-8.22 |
ppb° |
|
|
p < 0.01 |
|||
| Ethyl benzene |
|
|
1.45-3.16 |
ppb° |
? |
2.22-18.38 |
ppb° |
|
|
p < 0.01 |
|||
| 2-Pentanone |
|
|
3.25-8.77 |
ppb° |
> |
1.80-4.11 |
ppb° |
|
|
p < 0.01 |
|||
| Propanal |
|
|
1.56-3.74 |
ppb° |
> |
1.56-3.44 |
ppb° |
|
|
p < 0.01 |
|||
| 1-Propanol |
|
|
4.37-13.15 |
ppb° |
> |
N.S. |
ppb° |
|
|
p < 0.01 |
|||
| 2-Propanol |
|
|
3.32-7.19 |
ppb° |
> |
3.21-4.17 |
ppb° |
|
|
p < 0.01 |
|||
| 2-Propenal |
|
|
6.84-94.36 |
ppb° |
> |
5.10-9.57 |
ppb° |
|
|
p < 0.05 |
|||
| Other VOCs |
|
|
N.S. |
ppb° |
= |
N.S. |
ppb° |
|
|
p > 0.05 |
|||
| Crohns (2009) |
Pentane** |
LC |
11 |
1.73 (1.05-2.86) |
ng/L# |
> |
0.83 (0.61-1.13) |
ng/L# |
Controls |
30 |
p < 0.05 |
[43] |
|
| Fuchs (2010) |
Pentanal** |
LC |
12 |
0.019 (0.011-0.031) |
nmol/Lˆ |
> |
0.002 (0.000-0.011) |
nmol/Lˆ |
Controls |
12 |
p < 0.05 |
[45] |
|
| Hexanal** |
|
|
0.010 (0.008-0.026) |
nmol/Lˆ |
> |
0.000 (0.000-0.001) |
nmol/Lˆ |
|
|
p < 0.05 |
|||
| Octanal** |
|
|
0.052 (0.026-0.087) |
nmol/Lˆ |
> |
0.011 (0.004-0.028) |
nmol/Lˆ |
|
|
p < 0.05 |
|||
| Nonanal** |
|
|
0.239 (0.128-0.496) |
nmol/Lˆ |
> |
0.033 (0.021-0.096) |
nmol/Lˆ |
|
|
p < 0.05 |
|||
| Acetaldehyde**, Propanal, butanal**, heptanal, decanal** |
|
|
- |
|
= |
- |
|
|
|
p > 0.05 |
|||
| Kischkel (2010) |
Dimethyl sulphide** |
LC |
31 |
0.27 (0.00-0.27) |
nmol/Lˆ |
< |
0.30 (0.00-0.31) |
nmol/Lˆ |
Controls |
31 |
p < 0.01 |
[48] |
|
| Dimethyl formamide** |
|
|
1855 (0.00-3340.88) |
(counts)ˆ |
> |
0.00 (0.00-2954.13) |
(counts)ˆ |
|
|
p < 0.05 |
|||
| Butane** |
|
|
0.00 (0.00-0.11) |
nmol/Lˆ |
> |
0.18 (0.00-0.52) |
nmol/Lˆ |
|
|
p < 0.01 |
|||
| Butanal** |
|
|
1.07 (0.38-3.51) |
nmol/Lˆ |
> |
0.32 (0.00-1.40) |
nmol/Lˆ |
|
|
p < 0.001 |
|||
| Other VOCs (N = 38) |
|
|
N.S. |
|
|
N.S |
|
|
|
p > 0.05 |
|||
| Poli (2005) |
2-Methylpentane |
NSCLC |
36 |
139.5 (65.7-298.8) |
10-12Mˆ |
> |
27.7 (3.4-50.3) |
10-12Mˆ |
Controls |
50 |
p < 0.001 |
[57] |
|
| Pentane |
|
|
647.5 (361.3-1112.5) |
10-12Mˆ |
> |
268.0 (107.7-462.7) |
10-12Mˆ |
|
|
p < 0.001 |
|||
| Ethylbenzene |
|
|
24.0 (13.6-32.6) |
10-12Mˆ |
> |
13.6 (10.8-15.1) |
10-12Mˆ |
|
|
p < 0.01 |
|||
| Xylenes |
|
|
68.9 (43.6-108.4) |
10-12Mˆ |
> |
31.1 (21.1-56.4) |
10-12Mˆ |
|
|
p < 0.001 |
|||
| Trimethylbenzene |
|
|
14.9 (9.3-22.1) |
10-12Mˆ |
> |
6.2 (4.7-11.0) |
10-12Mˆ |
|
|
p < 0.01 |
|||
| Toluene |
|
|
158.8 (118.7-237.5) |
10-12Mˆ |
> |
80.8 (58.9-140.0) |
10-12Mˆ |
|
|
p < 0.001 |
|||
| Benzene |
|
|
94.5 (62.2-132.2) |
10-12Mˆ |
> |
44.7 (27.7-68.6) |
10-12Mˆ |
|
|
p < 0.001 |
|||
| Decane |
|
|
568.0 (277.9-1321.6) |
10-12Mˆ |
> |
208.7 (14.3-405.5) |
10-12Mˆ |
|
|
p < 0.001 |
|||
| Octane |
|
|
61.0 (22.4-112.9) |
10-12Mˆ |
> |
20.2 (4.0-50.8) |
10-12Mˆ |
|
|
p < 0.001 |
|||
| Pentamethylheptane |
|
|
2.5 (1.2-9.7) |
10-12Mˆ |
> |
0.9 (0.1-2.6) |
10-12Mˆ |
|
|
p < 0.001 |
|||
| Isoprene, heptane, styrene |
|
|
- |
|
= |
- |
|
|
|
p > 0.05 |
|||
| Poli (2008) |
2-Methylpentane |
NSCLC (3 yrs after surgery) |
10 |
87.9 (35.5-278.9) |
10-12Mˆ |
> |
27.7 (3.4-50.3) |
10-12Mˆ |
Controls |
50 |
p < 0.05 |
[58] |
|
| Pentane |
|
|
1569.0 (497.9-3214) |
10-12Mˆ |
> |
268.0 (107.7-462.7) |
10-12Mˆ |
|
|
p < 0.001 |
|||
| Ethylbenzene |
|
|
46.4 (38.6-90.9) |
10-12Mˆ |
> |
13.6 (10.8-15.1) |
10-12Mˆ |
|
|
p < 0.001 |
|||
| Xylenes |
|
|
56.2 (38.9-80.4) |
10-12Mˆ |
> |
31.1 (21.1-56.4) |
10-12Mˆ |
|
|
p < 0.05 |
|||
| Trimethylbenzene |
|
|
15.3 (11.7-22.3) |
10-12Mˆ |
> |
6.2 (4.7-11.0) |
10-12Mˆ |
|
|
p < 0.001 |
|||
| Toluene |
|
|
297 (202.6-297.0) |
10-12Mˆ |
> |
80.8 (58.9-140.0) |
10-12Mˆ |
|
|
p < 0.001 |
|||
| Pentamethylheptane |
|
|
8.8 (2.2-15.2) |
10-12Mˆ |
> |
0.9 (0.1-2.6) |
10-12Mˆ |
|
|
p < 0.001 |
|||
| Isoprene |
|
|
678.9 (359.8-1111.0) |
10-12Mˆ |
< |
3789 (1399–6589) |
10-12Mˆ |
|
|
p < 0.01 |
|||
| Benzene, Heptane, Octane, Styrene |
|
|
- |
|
= |
- |
|
|
|
p > 0.05 |
|||
| Preti (1988) |
O-toluidine |
LC |
10 |
N.S |
|
> |
N.S |
|
Controls |
16 |
p < 0.05 |
[60] |
|
| Aniline |
|
|
N.S |
|
= |
N.S |
|
|
|
p > 0.05 |
|||
| Rudnicka (2011) |
Propane |
LC |
23 |
3.19-9.74 |
ppb° |
> |
3.45-5.96 |
ppb° |
Controls |
30 |
p < 0.05 |
[61] |
|
| 2-Propenal |
|
|
N.S |
|
? |
N.S |
|
|
|
p < 0.05 |
|||
| Carbon disulfide |
|
|
N.S |
|
? |
N.S |
|
|
|
p < 0.05 |
|||
| Isopropyl alcohol |
|
|
N.S |
|
? |
N.S |
|
|
|
p < 0.05 |
|||
| Ethylbenzene |
|
|
1.45–3.16 |
ppb° |
< |
2.22–18.38 |
ppb° |
|
|
p < 0.05 |
|||
| Styrene |
|
|
N.S |
|
? |
N.S |
|
|
|
p < 0.05 |
|||
| Other VOCs (N = 49) |
|
|
N.S |
|
= |
N.S |
|
|
|
p > 0.05 |
|||
| Skeldon (2006) |
Ethane** |
LC |
12 |
0.7 (0–7.6) |
ppb~ |
= |
1.9 (0–10.54) |
ppb~ |
Controls |
12 |
p > 0.05 |
[62] |
|
| Song (2010) |
1-Butanol** |
NSCLC |
43 |
6.36 (12.93) |
ng/Lˆ |
> |
2.18 (2.06) |
ng/Lˆ |
Controls |
41 |
p < 0.001 |
[63] |
|
| 3-Hydroxy-2-butanone** |
|
|
8.28 (11.52) |
ng/Lˆ |
> |
1.29 (2.01) |
ng/Lˆ |
|
|
p < 0.001 |
|||
| Ulanowska(2011) |
Ethanol** |
LC |
137 |
466.9 (12.8-1520.1) |
ppb°° |
> |
188.5 (4.5-479.5) |
ppb°° |
Controls |
86 |
p < 0.05 |
[65] |
|
| Acetone** |
|
|
358.6 (112.3-2653.7) |
ppb°° |
> |
225.7 (41.6-753.4) |
ppb°° |
|
|
p < 0.05 |
|||
| Butane** |
|
|
90.3 (6.1-421.3) |
ppb°° |
> |
56.2 (5.2-165.7) |
ppb°° |
|
|
p < 0.05 |
|||
| Dimethyl sulphide** |
|
|
11.9 (6.3-18.5) |
ppb°° |
> |
9.3 (5.3-19.3) |
ppb°° |
|
|
p < 0.05 |
|||
| Isoprene** |
|
|
100.3 (19.2-295.5) |
ppb°° |
> |
70.8 (19.5-200.5) |
ppb°° |
|
|
p < 0.05 |
|||
| Propanal** |
|
|
7.8 (5.5-33.8) |
ppb°° |
> |
6.9 (5.6-9.1) |
ppb°° |
|
|
p < 0.05 |
|||
| 1-Propanol** |
|
|
54.8 (5.4-473.3) |
ppb°° |
> |
6.6 (N.S.) |
ppb°° |
|
|
p < 0.05 |
|||
| 2-Pentanone** |
|
|
7.5 (4.4-53.2) |
ppb°° |
> |
4.8 (4.6-5.1) |
ppb°° |
|
|
p < 0.05 |
|||
| Furan** |
|
|
4.7 (3.1-7.0) |
ppb°° |
> |
3.7 (3.0-5.3) |
ppb°° |
|
|
p < 0.05 |
|||
| o-Xylene** |
|
|
22.1 (7.6-95.2) |
ppb°° |
> |
17.4 (6.2-30.8) |
ppb°° |
|
|
p < 0.05 |
|||
| Ethylbenzene** |
|
|
19.6 (4.6-89.3) |
ppb°° |
> |
10.4 (8.6-14.0) |
ppb°° |
|
|
p < 0.05 |
|||
| Other VOCs (N ≈ 20) |
|
|
- |
|
= |
- |
|
|
|
p > 0.05 |
|||
| Wehinger (2007) |
Formaldehyde |
PLC |
17 |
7.0 (15.5) |
ppbˆ |
> |
3.0 (1.9) |
ppbˆ |
Controls |
170 |
p < 0.001 |
[66] |
|
| Propanol |
|
|
244.1 (236.2) |
ppbˆ |
> |
94.1 (55.2) |
ppbˆ |
|
|
p < 0.001 |
|||
| Isoprene |
|
|
52.1 (26.7) |
ppbˆ |
< |
81.8 (56.1) |
ppbˆ |
|
|
p < 0.01 |
|||
| Acetone, o-Toluidine |
|
|
- |
|
= |
- |
|
|
|
p > 0.05 |
|||
| Gennaro (2010) |
Cyclohexane** |
MPM |
13 |
251.79 (84%) |
ng/L∂ |
> |
33.08 (58%) |
ng/L∂ |
Controls |
13 |
p < 0.05 |
[70] |
|
| Other VOCs (N = 19) |
|
|
- |
|
= |
- |
|
|
|
p > 0.05 |
|||
| Syhre (2009) |
Methyl nicotinate |
TB |
10 |
N.S |
|
> |
N.S |
|
Controls |
10 |
p < 0.01 |
[80] |
|
| Chambers (2009) |
2-Pentylfuran*** |
A. fumigatus |
17 |
Sens: 77, Spec: 78 |
% |
> |
Not detected |
|
Controls |
14 |
N.S. |
[71] |
|
| Kanoh (2005) |
Ethane** |
ILD |
34 |
8.5 ± 8.0 |
pmol/dL* |
> |
2.9 ± 1.0 |
pmol/dL* |
Controls |
16 |
p < 0.001 |
[75] |
|
| Scholpp (2002) |
Acetone |
ARDS |
13 |
50.0 (19.6-72.3) |
nmol/Lˆ |
= |
33.2 (20.8-38.6) |
nmol/Lˆ |
Controls |
10 |
p > 0.05 |
[81] |
|
| Isoprene |
|
|
2.18 (1.1-3.89) |
nmol/L# |
< |
5.99 (3.53-8.45) |
nmol/L# |
|
|
p < 0.05 |
|||
| n-Pentane |
|
|
1.00 (0.26-1.72) |
nmol/Lˆ |
> |
0.12 (0.10-0.16) |
nmol/Lˆ |
|
|
p < 0.05 |
|||
| n-Pentane |
At risk ARDS |
33 |
0.49 (0.30-0.99) |
nmol/Lˆ |
> |
0.12 (0.10-0.16) |
nmol/Lˆ |
Controls |
10 |
p < 0.05 |
|||
| Schubert (1998) | Acetone |
ARDS |
19 |
149 (113–485) |
nmol/m2 ≈ |
= |
119 (52–270) |
nmol/m2≈ |
No ARDS |
18 |
p > 0.05 |
[82] |
|
| |
Isoprene |
|
|
9.8 (8.2-21.6) |
nmol/m2 ≈ |
< |
21.8 (13.9-41.4) |
nmol/m2≈ |
|
|
p < 0.05 |
||
| n-Pentane | 4.2 (3.7-9.3) | nmol/m2 ≈ | = | 5.1 (1.4-18.6) | nmol/m2≈ | p > 0.05 |
Data are presented as; *mean ± SEM or SD; #mean (95% confidence interval);∞median; ˆmedian (25th-75th percentile); ~median (range); ≈median (95% confidence interval); ° range; °° mean (range); ∂ median (relative standard deviation). ** Exhaled concentrations corrected for ambient concentrations (e.g. subtraction, VOCs filter). *** Sensitivity and specificity 2-Pentylfuran compared with gold standard (sputum). Diff. = Difference between diseased and controls: > elevated in diseased vs. controls, = no difference in diseased vs. controls, < decreased in diseased vs. controls. Abbreviations: A. fumigatus = Aspergillus fumigatus; ARDS = Acute Respiratory Distress Syndrome; CF = Cystic Fibrosis; COPD = Chronic Obstructive Pulmonary Disease; ILD = Interstitial Lung Disease (e.g. sarcoidosis, idiopathic pulmonary fibrosis, cryptogenic organizing pneumonia); LC = Lung Cancer; MPM = Malignant Pleural Mesothelioma; N = Sample size; N.S. = Not Stated; NSCLC = Non-Small Cell Lung Cancer; PLC = Primary Lung Cancer; Ref. = Reference.
Table 3.
Studies using VOCs profiles for the diagnosis of various pulmonary diseases (diseased vs. healthy controls)
| Author (year) | Disease | N | Discriminative | Controls | N | No. of markers | Sensitivity/Specificity (%)* | Ref. |
|---|---|---|---|---|---|---|---|---|
| Caldeira (2011) |
Asthma |
35 |
+ |
Controls |
15 |
28 |
CVV: 88% |
[17] |
| Caldeira (2012) |
Asthma |
32 |
+ |
Controls |
27 |
9 |
98/93 |
[18] |
| Dallinga (2010) |
Asthma |
63 |
+ |
Controls |
57 |
8 to 22 |
89 - 100/95 - 100 |
[19] |
| Dragonieri (2007) |
Mild asthma |
10 |
+ |
Controls |
10 |
N.S. |
CVV: 100% (M-distance 5.32) |
[10] |
| Severe asthma |
10 |
+ |
Controls |
10 |
N.S. |
CVV: 90% (M-distance 2.77) |
||
| Fens (2009) |
Asthma |
20 |
+ |
Non-smoking controls |
20 |
N.S. |
CVV: 95% (p < 0.001) |
[15] |
| Asthma |
20 |
+ |
Smoking controls |
20 |
N.S. |
CVV: 93% (p < 0.001) |
||
| Ibrahim (2011) |
Asthma |
35 |
+ |
Non-smoking controls |
23 |
15 |
CVV: 83% (PPV: 0.85, NPV: 0.89) |
[20] |
| Montuschi (2010) |
Asthma |
27 |
+ |
Controls |
24 |
N.S. |
DP: 88% |
[22] |
| Timms (2012) |
Asthma |
20 |
+ |
Controls |
7 |
N.S. |
CVV: 70% (p = 0.047) |
[32] |
| COPD |
17 |
+ |
Controls |
7 |
N.S. |
M-distance: 3.601 (p < 0.01) |
||
| Cristescu (2011) |
Emphysema |
43 |
- |
(Former) smoking controls |
161 |
1 |
AUC: 0.56 (CI: 0.45-0.66) |
[26] |
| Basanta (2010) |
COPD |
20 |
+ |
Smoking controls |
6 |
N.S. |
88/81 |
[25] |
| Fens (2009) |
COPD |
30 |
+/− |
Smoking controls |
20 |
N.S. |
CVV: 66% (p < 0.01) |
[15] |
| COPD |
30 |
- |
Non-smoking controls |
20 |
N.S. |
CVV: N.S. |
||
| Hattesohl (2011) |
COPD |
23 |
+/− |
Controls |
10 |
N.S. |
CVV: 68% (p < 0.001) |
[28] |
| Hauschild (2012) |
COPD |
84 |
+ |
Controls |
35 |
120 |
87 - 98/71 - 86 |
[29] |
| Phillips (2012) |
COPD |
119 |
+ |
Controls |
63 |
N.S. |
79/64 |
[31] |
| Van Berkel (2010) |
COPD |
50 |
+ |
Controls |
29 |
6 to 13 |
98 - 100/88 - 100 |
[33] |
| COPD (validation) |
16 |
+ |
Controls (validation) |
16 |
6 |
100/81 |
||
| Robroeks (2010) |
CF |
48 |
+ |
Controls |
57 |
22 |
100/100 |
[14] |
| Bajtarevic (2009) |
LC |
65 |
+ |
Controls |
31 |
15 to 21 |
71 - 80/100 - 100 |
[41] |
| D’Amico (2010) |
LC |
28 |
+ |
Controls |
36 |
N.S. |
85/100 |
[44] |
| Di Natale (2003) |
LC |
35 |
+ |
Controls |
18 |
N.S. |
100/94 |
[11] |
| Dragonieri (2009) |
NSCLC |
10 |
+ |
Controls |
10 |
N.S. |
CVV: 90% (M-distance 2.96) |
[12] |
| Gaspar (2009) |
LC |
18 |
+ |
Controls |
10 |
10 |
100/100 |
[46] |
| Gordon (1985) |
LC |
12 |
+ |
Controls |
9 |
22 |
DP > 80% |
[47] |
| Ligor (2009) |
LC |
65 |
+/− |
Controls |
31 |
8 |
51/100 |
[49] |
| Machado (2005) |
LC |
14 |
+ |
Controls |
20 |
N.S. |
CVV: 72% (M-distance: 3.25) |
[13] |
| Mazzone (2007) |
NSCLC |
49 |
- |
Controls |
21 |
N.S. |
57/78 |
[50] |
| Peng (2009) |
LC |
40 |
+ |
Controls |
56 |
42 |
2 PCA clusters: 100% discrimination |
[52] |
| Peng (2010) |
PLC |
30 |
+ |
Controls |
22 |
33 |
2 PCA clusters: 100% discrimination |
[53] |
| Phillips (2003) |
PLC |
67 |
+ |
Controls |
41 |
9 |
85/81 |
[7] |
| Phillips (2007–2008) |
PLC |
193 |
+ |
Controls |
211 |
16 to 30 |
85 - 85/80 - 81 |
[55], [56] |
| Poli (2010) |
NSCLC |
40 |
+ |
Controls |
38 |
7 |
90/92 |
[59] |
| Steeghs (2007) |
LC |
11 |
+ |
Controls |
57 |
2 |
AUC: 0.81 |
[64] |
| Westhoff (2009) |
LC |
32 |
+ |
Controls |
54 |
23 |
100/100 |
[67] |
| Chapman (2012) |
MPM |
10 |
+ |
Controls |
32 |
N.S. |
90/91 |
[68] |
| Dragonieri (2012) |
MPM |
13 |
+ |
Controls |
13 |
N.S. |
CVV: 85% (p < 0.001) |
[69] |
| Phillips (2007) |
Patients suspected of TB |
42 |
+ |
Controls |
59 |
N.S. (≈7) |
100/100 |
[77] |
| Phillips (2012) | Patients with TB | 130 | +/− | Controls | 121 | 8 | 71/72 | [79] |
*Sensitivity/Specificity (in %), unless stated otherwise. AUC = Area Under the ROC Curve; CF = Cystic Fibrosis; CI = 95% Confidence interval; COPD = Chronic Obstructive Pulmonary Disease; CVV = Cross-Validated accuracy-Value; DP = Diagnostic Performance; LC = Lung Cancer; M-distance = Mahalanobis-distance; MPM = Malignant Pleural Mesothelioma; N = Sample size; NPV = Negative Predictive Value; N.S. = Not Stated; NSCLC = Non-Small Cell Lung Cancer; PCA = Principal Component Analysis; PLC = Primary Lung Cancer; PPV = Positive Predictive Value; Ref. = Reference; TB = pulmonary Tuberculosis.
Table 4.
Studies using VOCs profiles for the differential diagnosis of various pulmonary diseases
| Author (year) | Disease I | N | Discriminative | Disease II | N | No. of markers | Sensitivity/Specificity (%)* | Ref. |
|---|---|---|---|---|---|---|---|---|
| D’Amico (2010) |
LC |
28 |
+ |
Other lung diseases |
28 |
N.S. |
93/79 |
[44] |
| Dragonieri (2007) |
Mild asthma |
10 |
+/− |
Severe asthma |
10 |
N.S. |
CVV: 65% (M-distance 1.23) |
[10] |
| Fens (2009) |
Asthma |
20 |
+ |
COPD |
30 |
N.S. |
CVV: 96% (p < 0.001) |
[15] |
| Fens (2011) ** |
Fixed Asthma |
21 |
+ |
COPD |
40 |
N.S. |
85/90 (CVV: 88%, p < 0.001) |
[27] |
| Classic Asthma |
39 |
+ |
|
|
|
91/90 (CVV: 83%, p < 0.001) |
|
|
| Ibrahim (2011) |
Controlled Asthma |
17 |
+ |
Uncontrolled asthma |
18 |
13 |
89/88 (PPV: 0.89, NPV: 0.88) |
[20] |
| Timms (2012) |
Asthma |
20 |
+ |
COPD |
17 |
N.S. |
CVV: 70% (p < 0.05) |
[32] |
| Asthma |
11 |
+ |
Asthma with GER |
9 |
|
CVV: 85% (p < 0.05) |
|
|
| COPD |
8 |
+/- |
COPD with GER |
9 |
|
CVV: 65 (p < 0.05) |
|
|
| Hattesohl (2011) |
COPD without AAT deficiency |
23 |
+/- |
COPD with AAT deficiency |
10 |
N.S. |
CVV: 58% (M-distance: 2.27) |
[28] |
| Dragonieri (2009) |
LC |
10 |
+ |
COPD |
10 |
N.S. |
CVV: 85% (M-distance: 3.73) |
[12] |
| Machado (2005) |
LC (validation) |
14 |
+/- |
No LC |
62 |
N.S. |
71/92 |
[13] |
| Mazzone (2007) |
LC |
49 |
+/− |
No LC |
94 |
N.S. |
73/72 |
[50] |
| Mazzone (2012) |
NSCLC |
83 |
+ |
No LC |
137 |
N.S. |
70/86 |
[51] |
| Adenocarcinoma |
50 |
+ |
No LC |
137 |
|
80/86 |
|
|
| Squamous cell |
23 |
+ |
No LC |
137 |
|
91/73 |
|
|
| Adenocarcinoma |
50 |
+ |
Squamous cell |
22 |
|
90/83 |
|
|
| Phillips (1999) |
LC |
60 |
+/− |
No LC |
48 |
22 |
72/67 |
[54] |
| Phillips (2003) |
MLC |
15 |
- |
No MLC |
91 |
9 |
67/37 |
[7] |
| Poli (2005) |
NSCLC |
36 |
+ |
No LC |
110 |
13 |
72/94 |
[57] |
| Chapman (2012) |
MPM |
10 |
+ |
ARD |
18 |
N.S. |
90/83 |
[68] |
| Dragonieri (2012) |
MPM |
13 |
+ |
No MPM |
13 |
N.S. |
CVV: 81% (p < 0.001) |
[69] |
| Hanson (2005) |
+ VAP score |
19 |
+ |
- VAP score |
19 |
N.S. |
R2 (to standard): 0.81 (p < 0.0001) |
[72] |
| Hockstein (2004) |
VAP |
13 |
+ |
No VAP |
12 |
N.S. |
CVV: >80% |
[73] |
| Hockstein (2005) |
+ VAP score |
15 |
+/− |
- VAP score |
29 |
N.S. |
CVV: 66-70% |
[74] |
| Kolk (2012) |
TB |
50 |
+ |
No TB |
50 |
7 |
72/86 |
[76] |
| TB (validation) |
21 |
+ |
No TB |
50 |
7 |
62/84 |
||
| Phillips (2007) |
TB |
23 |
+ |
No TB |
19 |
N.S. (≈14) |
96/79 |
[77] |
| Phillips (2010) | TB | N.S. | + | No TB | N.S. | N.S. (≈10) | 84/65 | [78] |
*Sensitivity/Specificity (in %), unless stated otherwise. AAT deficiency = Alpha 1-antitrypsin deficiency; ARD = benign asbestos-related diseases; Classic asthma = Asthmatics with reversible airway obstruction; COPD = Chronic Obstructive Pulmonary Disease; CVV = Cross-Validated accuracy-Value; DP = Diagnostic Performance; Fixed asthma = Asthmatics with fixed airway obstruction; GER = Gastro-Esophageal Reflux; LC = Lung Cancer; M-distance = Mahalanobis-distance; MLC = Metastatic Lung Cancer; MPM = Malignant Pleural Mesothelioma; N = Sample size; NPV = Negative Predictive Value; N.S. = Not Stated; NSCLC = Non-Small Cell Lung Cancer; PPV = Positive Predictive Value; R2 = Coefficient of determination; TB = pulmonary Tuberculosis; VAP = Ventilator Associated-Pneumonia. ** External validation study of Fens 2009.
Results
Description of included studies
Seventy-three studies were included of which the characteristics are provided in Table 1. In total, nine studies described VOCs in asthma, seven in COPD, seven in CF, four compared asthma with COPD or CF, thirty-four in thoracic cancer (of which 6 studies included COPD patients in the control group), and twelve studies described VOCs in other pulmonary diseases. A total of 2,973 healthy controls and 3,952 patients were investigated; 417 asthmatic patients, 527 COPD patients, 188 CF patients, 1,575 lung cancer patients, 33 malignant pleural mesothelioma (MPM) patients, 139 subjects with an abnormal chest radiograph, 579 subjects suspected for pulmonary tuberculosis, and 494 patients with other (pulmonary) diseases (e.g. sarcoidosis, acute respiratory distress syndrome). Various techniques were described to collect and analyze exhaled VOCs. The most commonly used technique was gas chromatography (N = 50), usually combined with MS or FID. Fifteen studies analyzed VOCs using an eNose, whilst thirteen studies used PTR-MS, SIFT-MS, IMS, laser spectroscopy, colorimetric sensor array, and/or GNPs (some studies used multiple techniques). Forty-five studies were conducted in the last five years. An overview of findings per study can be found in Tables 2, 3, 4. The most important findings are summarized below.
Volatile organic compounds in asthma
Several studies found that an accurate asthma diagnosis was possible using profiles of VOCs (Table 3). Dragonieri and Fens et al. demonstrated that a VOCs profile could correctly classify asthmatic patients when using an eNose [10,15]. Moreover, Montuschi and colleagues demonstrated that VOCs profiling using an eNose had higher diagnostic performance for asthma than exhaled nitric oxide or lung function [22]. Dallinga and Caldeira et al. demonstrated that VOCs profiling was able to accurately distinguish children with asthma from controls [17-19]. With respect to differential diagnosis, it was demonstrated that an eNose VOCs profile was able to discriminate between asthma and COPD patients (Table 4) [15,32]. An external validation study demonstrated that not only ‘classical’ asthmatic patients (with reversible airway obstruction) but also asthmatic patients with fixed airway obstruction could be distinguished from COPD patients [27]. As these latter two groups usually have similar symptoms and overlapping spirometry, differential diagnosis is often difficult. These findings imply that VOCs profiling is of additional value in the differential diagnosis of asthma and COPD.
Next to diagnosing asthma, VOCs might be useful in the assessment of asthma severity and control. Paredi et al. found elevated levels of exhaled ethane in steroid-naïve asthmatics compared to steroid-treated asthmatics (Table 2). Furthermore, ethane was higher in patients with severe asthma (FEV1 < 60%), compared to patients with mild asthma (FEV1 > 60%) [24]. In contrast, Dragonieri et al. reported that it was not possible to adequately distinguish mild and severe asthmatics using an eNose profile [10]. Regarding asthma control, higher exhaled pentane levels were found in asthmatic patients with an exacerbation compared to controls. Once the asthma exacerbation subsidized, pentane levels decreased to levels comparable to controls [23]. Moreover, Ibrahim demonstrated that VOCs profiles were able to diagnose sputum eosinophilia and identify patients with poor disease control [20]. Taken together, VOCs profiling might be useful for an asthma diagnosis, for differentiating asthma from COPD, and for assessing asthma control. The usefulness of VOCs profiles in assessing disease severity still needs to be established.
Volatile organic compounds in chronic obstructive pulmonary disease
Many COPD patients are diagnosed at an advanced stage of the disease, when benefits of interventions such as smoking cessation and drug therapy are less pronounced. An early diagnosis of COPD would be an advantage. Multiple research groups demonstrated that VOC profiles could accurately differentiate COPD patients from healthy (non-) smokers [25,29,31,33]. In contrast, others found a limited performance of VOCs profiles to differentiate COPD patients from (former) smokers [15,26]. Hattesohl et al. demonstrated that eNose derived VOCs profiles were not different between COPD patients with and without an alpha 1-antitrypsin (AAT) deficiency, after internal cross-validation. Moreover, cross-validated VOCs profiles of AAT deficiency patients did not differ after human recombinant AAT therapy [28].
Next to diagnostic purposes, VOCs might be useful to monitor severity and inflammation status in COPD patients. Elevated levels of ethane were found in steroid-naïve COPD patients and patients with low FEV1 values compared to steroid-treated patients and patients with higher FEV1 values [30]. Fens et al. demonstrated that VOCs profiles were associated with both cell counts and sputum markers of inflammatory cell activation (eosinophilic vs. neutrophilic) in COPD patients [83]. These findings indicate that VOCs profiles might monitor both type and activity of airway inflammation.
Volatile organic compounds in cystic fibrosis
In CF, there is less need for a new diagnostic tool as the sweat chloride test and genetic screening serve as gold standards. However, there is need for new tools regarding early detection of Pseudomonas (P.) aeruginosa and prediction and follow-up of exacerbations. Robroeks et al. demonstrated that a VOCs profile could accurately discriminate between CF patients with and without P. aeruginosa colonization [14]. Gilchrist et al. showed that exhaled hydrogen cyanide (a marker of P. aeruginosa) was elevated in CF children with P. aeruginosa colonization compared to CF children without colonization [36]. Accordingly, Enderby et al. demonstrated that exhaled hydrogen cyanide was elevated in children with CF compared to children with asthma [35]. Kamboures et al. demonstrated elevated levels of exhaled sulphides (produced by bacteria such as P. aeruginosa) in CF patients compared to controls [37]. In contrast, Shestivska et al. could not demonstrate different levels of exhaled methyl thiocyanate (also a marker of P. aeruginosa) in CF patients and controls [40].
Regarding monitoring disease control, McGrath et al. demonstrated that CF patients with an acute exacerbation had lower levels of exhaled isoprene compared to controls [38]. When these patients were treated with antibiotics, their isoprene levels increased to normal [38]. Moreover, elevated ethane levels were found in steroid-naïve CF patients compared to steroid-treated patients [39]. In addition, elevated pentane levels were found in CF patients with an exacerbation [34]. These data demonstrate that VOCs profiling can be useful for assessment and follow-up of exacerbations, and for a rapid detection of P. aeruginosa in CF patients.
Volatile organic compounds in thoracic oncology
The majority of lung cancer (LC) patients studied had non-small cell lung cancer (Table 1). Several studies demonstrated that a combination of VOCs, identified by GC-MS, could differentiate LC patients from controls [7,41,46,47,49,52,53,55,56,59]. In general, the number of VOCs per model ranged from 7 to 33, with a sensitivity of 50-100% and a specificity of 80-100% (Table 3). These studies, together with studies investigating single VOCs, revealed that the discriminative VOCs were predominantly alkanes (e.g. pentane, butane, propane), alkane derivates (e.g. propanol, multiple aldehydes) and benzene derivates (e.g. ethyl-, propylbenzene) (Table 2) [42,43,45,48,57,59-63,65,66]. Although most VOCs levels were elevated, certain levels (e.g. of isoprene) were decreased in patients compared to controls [41,58,66]. The diagnostic potential of VOCs profiles in LC was also demonstrated by groups that used eNose and other sophisticated techniques [11-13,44,51-53,64,67]. Moreover, breath profiles were different in patients with dissimilar histology (adenocarcinoma vs. squamous cell carcinoma) [51]. Besides, Peng et al. demonstrated distinct VOCs profiles in patients with lung, colon, breast, and prostate cancer [53]. The important findings of VOC signatures of different cancer types, need to be confirmed in wider clinical studies.
Multiple studies investigated the potential of VOCs to discriminate between LC and other pulmonary diseases. Not single compounds (such as ethane), but a combination of multiple VOCs was able to distinct LC patients from patients with non-cancer pulmonary diseases (such as COPD, pleurisy, idiopathic fibrosis) with a reasonable accuracy (Table 4) [12,13,44,50,57,62]. Phillips et al. demonstrated that primary LC could be reasonably diagnosed in subjects with an abnormal chest radiograph [7,54]. However, VOCs had limited predictive value to stage LC patients [7,63,84].
Two studies described the potential of VOCs in evaluating treatment in LC patients. Poli et al. demonstrated that VOCs levels, except for isoprene, were unaffected one month after surgical resection of the tumor [58]. After three years, several VOCs either increased (e.g. pentane) or decreased (e.g. isoprene) compared to baseline [58]. However, most post-surgical VOCs levels remained higher compared to levels of controls. Likewise, Crohns et al. were not able to detect changes of pentane levels after radiotherapy, although they did demonstrate that higher pre-treatment levels predicted better survival [43].
Malignant pleural mesothelioma (MPM) is a rare tumor mainly caused by asbestos exposure. VOCs profiles were able to diagnose MPM in a group of subjects with long-term professional asbestos exposure [68,69]. Moreover, de Gennaro et al. distilled cyclohexane as possible marker of MPM [70].
Smoking status can be an important influencing factor, especially in patients with LC and COPD. Smoke contains profuse amounts of VOCs and is associated with alterations in exhaled VOCs patterns. As high background of external VOCs caused by smoking can influence the accuracy of the diagnostic profile, most studies performed in LC and COPD took smoking status into account in their analysis [15,25,27,31,33,43,50,53-55,59,65].
Volatile organic compounds in other pulmonary diseases
VOCs were also studied in critically ill patients with acute respiratory distress syndrome (ARDS). Lower isoprene levels and elevated pentane levels were reported in ARDS patients compared to controls [81,82]. These findings are in line with the findings that critically ill patients with ventilator-associated pneumonia (VAP) had decreased isoprene levels and increased pentane levels compared to patients without pneumonia [82]. In addition, VOCs profiles generated with the eNose had potential to diagnose this form of pneumonia [72-74].
Kanoh et al. demonstrated that exhaled ethane was elevated in patients with an interstitial lung disease (including sarcoidosis and idiopathic pulmonary fibrosis) compared to controls, with highest levels in those with an active and progressive disease [75]. A small VOC, 2-pentylfuran, was commonly present in breath of patients with a chronic pulmonary disease (including asthma and CF) with Aspergillus fumigatus in their respiratory specimens, whereas this VOC was not detected in breath of controls [71]. Syhre et al. demonstrated elevated levels of exhaled methyl nicotinate (a volatile metabolite produced by M. tuberculosis) in patients with pulmonary tuberculosis (TB) compared to healthy controls [80]. In a group of patients with suspicion of TB, VOC patterns were able to distinguish patients with TB from those without active TB and healthy controls with a reasonable accuracy (Table 4) [76-79].
Discussion
Conclusions from this review
A substantial increase in clinical studies on VOCs in pulmonary diseases was observed in the last decade. Initial studies on VOCs identified biomarkers in a traditional way by focusing on single compounds based on biological insight. Levels of several VOCs were demonstrated to be distinct in people with a pulmonary disease compared to controls. These markers mainly included alkanes for asthma and COPD; alkanes, alkenes and alkene-derivates for CF and analogous compounds plus benzene derivates and aldehydes in lung cancer. Due to overlap in markers, one may argue that a disease specific biomarker is not discovered yet. For example, ethane was not only elevated in asthmatic patients, but also in COPD and CF patients. Similarly, decreased levels of isoprene were found in both children with CF, asthmatic patients, lung cancer patients and in patients with ARDS. Despite the lack of a single discriminative biomarker, these studies did demonstrate that exhaled breath of patients with a particular lung disease is distinct from healthy controls. This finding evolved in a new hypothesis that pulmonary diseases are characterized by a distinctive breath-print that is not based on single markers, but on a profile of numerous VOCs. Instead of a knowledge based strategy, recent studies mainly support an inductive strategy to discover disease-specific VOCs profiles. Owing to recent technical and analytical advancements, hundreds of VOCs can be analyzed to characterize the breath-print of a pulmonary disease. Various research groups demonstrated that, either by using the eNose or GC, VOCs profiles of patients with several pulmonary diseases could be well distinguished from VOCs profiles of controls. Moreover, distinct VOCs profiles were found in patients with dissimilar pulmonary diseases. These promising results pave the way for the development of a non-invasive diagnostic tool based on exhaled VOCs.
Potential applications and advantages of using VOCs into clinical practice
Although current research mainly focused on the diagnostic potential of VOCs, there are multiple other conceivable applications of VOCs in the field of pulmonary diseases, such as:
(early) Diagnosing of pulmonary diseases (e.g. early asthma diagnosis in children).
Differential diagnosing (e.g. asthma versus COPD).
Phenotyping within a pulmonary disease (e.g. wheezing phenotypes in children).
Monitoring disease severity and control.
Predicting exacerbations and prognosis of a disease.
Evaluating treatment/surgery (e.g. checking compliance with prescribed medication).
Screening for different diseases in population based studies (e.g. predicting risk).
The advantages of VOCs profiling are evident. Although VOCs can have an exogenous origin, numerous VOCs are formed within the airways as a result of local inflammatory or neoplastic processes. Therefore, the analysis of exhaled VOCs can serve as a direct measure of lung status. Nevertheless, since VOCs are blood-borne they can also reflect other processes in the body and thus may assess different body functions in a flexible manner. Secondly, collection of breath samples is safe, non-invasive and easy to perform even in children and more severe patients. Breath collection does not require skilled medical staff and obtaining large quantities or repeated measurements are not as bothersome for patients compared to e.g. blood sampling, sputum induction or bronchoalveolar lavages. Moreover, the matrix of exhaled breath is less complex than blood or urine, eliminating the need for complicated work-up of samples. Finally, techniques to measure VOCs, such as GC-MS, are very sensitive to detect compounds and techniques such as the IMS allow real-time measurement of compounds in the body.
Challenges before VOCs can be used into clinical practice
Although VOCs profiling is a potential clinical tool, considerable work needs to be done before it can be applied into clinical practice. An important step that needs to be taken is extensive validation of the current available VOCs profiles. Next to (external) validation, standardization in collecting and analyzing VOCs is necessary to enhance inter-laboratory comparability. Due to the heterogeneity of the included studies (in study design, sampling and analytical techniques) a variety of results is reported, making it difficult to draw firm conclusions or to calculate an algorithm for the most important compounds in the diverse pulmonary diseases. In the standardization procedure, the influence of potential confounders needs to be explored before considering VOCs as a clinical tool [48]. As described before, exhaled VOCs can arise from various endogenous and exogenous sources. Consequently, numerous environmental-, subject- and analytical factors can influence the exhaled VOCs pattern (Table 5). For example, air pollution, smoking, eating, drinking and medication use can considerably affect the composition of exhaled VOCs [85]. Also the presence of bacteria can alter exhaled VOCs patterns (hence breath analysis could be used to identify bacterial infections and bacterial-induced diseases). This suggests that these factors should be taken into account when constructing a diagnostic tool on basis of VOCs patterns. Moreover, potential confounders on analytical level should be carefully studied. For example, during the offline-procedure of exhaled VOCs collection, Tedlar bags could release VOCs into the collected breath, and storage onto Tenax columns can disturb the composition of the breath. As the pool of exhaled VOCs arises from multiple endogenous and exogenous sources, the analysis of background samples and standardization of the analysis per technique is necessary. A list of recommendations for measurements composed by experts, as was provided for markers in exhaled breath condensate, will facilitate standardization [86]. Thirdly, more insight is needed in the physiological meaning and biochemical origin of endogenous formed VOCs. However, this might be difficult since, as described before, the origin of VOCs is blood-borne and therefore can be the result of widely different biochemical pathways (so the previously mentioned advantage of VOCs is a disadvantage as well). Fourthly, more research is needed on the potential of VOCs in differential diagnosis and monitoring purposes. Besides these four major ‘missions’, others aspects of VOCs assessment and analysis can be improved. Although breath samples are easy to collect, the analysis of VOCs is still quite cumbersome and time-consuming and requires trained personnel. Moreover, further refinement of sampling techniques, exploring advanced statistical techniques on the multi-data of VOCs to build diagnostic and prognostic models, and developing new tools that combine the strengths of the eNose (cheap, time efficient), IMS (real-time), and GC-MS (sensitive, compound identification) will facilitate the introduction of VOCs into clinical practice.
Table 5.
Factors that can influence exhaled VOCs in pulmonary diseases
| Source | Factor |
|---|---|
| Environment |
Ambient VOCs (e.g. by air pollution) |
| Temperature of environment | |
| Humidity of inhaled and exhaled air | |
| Season | |
| Subject |
Clinical characteristics: e.g. age, gender, weight, length |
| Nutrition | |
| Tobacco smoking | |
| Medication use | |
| Circadian rhythm | |
| Non-pulmonary chronic diseases (liver impairment, diabetes, presence of bacteria) | |
| Breathing pattern: e.g. exhaled flow, minute ventilation, breath hold | |
| Overall lifestyle and physical condition | |
| Analysis |
Time and way of storage |
| Pre-concentration | |
| Breath collection: mixed air or alveolar air | |
| Collection method: e.g. tedlar bags, metal containers | |
| Analytical method: e.g. eNose, GC-MS |
Conclusions
As the current available tools are not always fulfilling, there is an increasing interest in non-invasive measurement of exhaled VOCs to improve the diagnosis and management of pulmonary diseases. Due to the complex pathophysiology of most pulmonary diseases, current research mainly focused on profiles of VOCs rather than on individual compounds. Promising findings were reported on VOCs profiles that were able to accurately diagnose and monitor various pulmonary diseases. However, multiple constraints including validation and standardization need to be resolved before VOCs can be applied into clinical practice. The rapid progress that is currently made in the field of VOCs will facilitate the imminent introduction of VOCs profiling as a non-invasive, additional tool to assist in diagnosing and monitoring of pulmonary diseases.
Abbreviations
AAT deficiency: Alpha 1-antitrypsin deficiency; A. fumigatus: Aspergillus fumigatus; ARD: Benign Asbestos-Related Diseases; ARDS: Acute Respiratory Distress Syndrome; CBD: Chronic pulmonary Beryllium Disease; CF: Cystic Fibrosis; COPD: Chronic Obstructive Pulmonary Disease; CVV: Cross-Validated accuracy-Value; DMS: Differential Mobility Spectrometry; eNose: electronic Nose; FID: Flame Ionization Detector; GC: Gas Chromatography; GER: Gastro-Esophageal Reflux; GNPs: Gold Nano Particles sensors; ILD: Interstitial Lung Disease; IMS: Ion Mobility Spectrometry; LC: Lung Cancer; MC: Medical Centre; M-distance: Mahalanobis-distance; MLC: Metastatic Lung Cancer; MPM: Malignant Pleural Mesothelioma; MS: Mass Spectrometry; NPV: Negative Predictive Value; NSCLC: Non-Small Cell Lung Cancer; OFD: On-Fiber-Derivatization; PCA: Principal Component Analysis; PLC: Primary Lung Cancer; PPV: Positive Predictive Value; PTR-MS: Proton Transfer Reaction Mass Spectrometry; SAW: Surface Acoustic Wave; SIFT-MS: Selected Ion Flow Tube Mass Spectrometry; TB: pulmonary Tuberculosis; VAP: Ventilator Associated-Pneumonia; VOCs: Volatile Organic Compounds.
Competing interests
The authors declare that they have no competing interests.
Authors’ contributions
KvdK and LvdS included the studies, extracted the data and drafted the manuscript. QJ, CPvS, and ED helped to draft the manuscript. All authors read and approved the final manuscript.
Contributor Information
Kim DG van de Kant, Email: kim.vande.kant@mumc.nl.
Linda JTM van der Sande, Email: L.vandersande@student.maastrichtuniversiy.nl.
Quirijn Jöbsis, Email: r.jobsis@mumc.nl.
Onno CP van Schayck, Email: o.vanschayck@maastrichtuniversity.nl.
Edward Dompeling, Email: edward.dompeling@mumc.nl.
Acknowledgements
The authors would like to thank Ester Klaassen and Prof. Geertjan Wesseling for helpful comments on earlier drafts of this manuscript. No funding has been received for this manuscript.
References
- Rabe KF, Hurd S, Anzueto A, Barnes PJ, Buist SA, Calverley P, Fukuchi Y, Jenkins C, Rodriguez-Roisin R, van Weel C. et al. Global strategy for the diagnosis, management, and prevention of chronic obstructive pulmonary disease: GOLD executive summary. Am J Respir Crit Care Med. 2007;176(6):532–555. doi: 10.1164/rccm.200703-456SO. [DOI] [PubMed] [Google Scholar]
- Bateman ED, Hurd SS, Barnes PJ, Bousquet J, Drazen JM, FitzGerald M, Gibson P, Ohta K, O'Byrne P, Pedersen SE. et al. Global strategy for asthma management and prevention: GINA executive summary. Eur Respir J. 2008;31(1):143–178. doi: 10.1183/09031936.00138707. [DOI] [PubMed] [Google Scholar]
- Jemal A, Siegel R, Ward E, Hao Y, Xu J, Thun MJ. Cancer statistics, 2009. CA Cancer J Clin. 2009;59(4):225–249. doi: 10.3322/caac.20006. [DOI] [PubMed] [Google Scholar]
- Scott M, Raza A, Karmaus W, Mitchell F, Grundy J, Kurukulaaratchy RJ, Arshad SH, Roberts G. Influence of atopy and asthma on exhaled nitric oxide in an unselected birth cohort study. Thorax. 2010;65(3):258–262. doi: 10.1136/thx.2009.125443. [DOI] [PMC free article] [PubMed] [Google Scholar]
- Miekisch W, Schubert JK, Noeldge-Schomburg GF. Diagnostic potential of breath analysis–focus on volatile organic compounds. Clin Chim Acta. 2004;347(1–2):25–39. doi: 10.1016/j.cccn.2004.04.023. [DOI] [PubMed] [Google Scholar]
- Buszewski B, Kesy M, Ligor T, Amann A. Human exhaled air analytics: biomarkers of diseases. Biomed Chromatogr. 2007;21(6):553–566. doi: 10.1002/bmc.835. [DOI] [PubMed] [Google Scholar]
- Phillips M, Cataneo RN, Cummin AR, Gagliardi AJ, Gleeson K, Greenberg J, Maxfield RA, Rom WN. Detection of lung cancer with volatile markers in the breath. Chest. 2003;123(6):2115–2123. doi: 10.1378/chest.123.6.2115. [DOI] [PubMed] [Google Scholar]
- Ras MR, Borrull F, Marce RM. Sampling and preconcentration techniques for determination of volatile organic compounds in air samples. TrAC. 2009;28(3):347–361. [Google Scholar]
- Pavlou AKTAPF. Sniffing out the truth: Clinical diagnosis using the electronic nose. Clin Chem Lab Med. 2000;38(2):99–112. doi: 10.1515/CCLM.2000.016. [DOI] [PubMed] [Google Scholar]
- Dragonieri S, Schot R, Mertens BJ, Le Cessie S, Gauw SA, Spanevello A, Resta O, Willard NP, Vink TJ, Rabe KF. et al. An electronic nose in the discrimination of patients with asthma and controls. J Allergy Clin Immunol. 2007;120(4):856–862. doi: 10.1016/j.jaci.2007.05.043. [DOI] [PubMed] [Google Scholar]
- Di Natale C, Macagnano A, Martinelli E, Paolesse R, D'Arcangelo G, Roscioni C, Finazzi-Agro A, D'Amico A. Lung cancer identification by the analysis of breath by means of an array of non-selective gas sensors. Biosens Bioelectron. 2003;18(10):1209–1218. doi: 10.1016/S0956-5663(03)00086-1. [DOI] [PubMed] [Google Scholar]
- Dragonieri S, Annema JT, Schot R, van der Schee MP, Spanevello A, Carratu P, Resta O, Rabe KF, Sterk PJ. An electronic nose in the discrimination of patients with non-small cell lung cancer and COPD. Lung Cancer. 2009;64(2):166–170. doi: 10.1016/j.lungcan.2008.08.008. [DOI] [PubMed] [Google Scholar]
- Machado RF, Laskowski D, Deffenderfer O, Burch T, Zheng S, Mazzone PJ, Mekhail T, Jennings C, Stoller JK, Pyle J. et al. Detection of lung cancer by sensor array analyses of exhaled breath. Am J Respir Crit Care Med. 2005;171(11):1286–1291. doi: 10.1164/rccm.200409-1184OC. [DOI] [PMC free article] [PubMed] [Google Scholar]
- Robroeks CM, van Berkel JJ, Dallinga JW, Jöbsis Q, Zimmermann LJ, Hendriks HJ, Wouters MF, van der Grinten CP, van de Kant KD, van Schooten FJ. et al. Metabolomics Of Volatile Organic Compounds In Cystic Fibrosis Patients and Controls. Pediatr Res. 2010;68(1):75–80. doi: 10.1203/PDR.0b013e3181df4ea0. [DOI] [PubMed] [Google Scholar]
- Fens N, Zwinderman AH, van der Schee MP, de Nijs SB, Dijkers E, Roldaan AC, Cheung D, Bel EH, Sterk PJ. Exhaled Breath Profiling Enables Discrimination of Chronic Obstructive Pulmonary Disease and Asthma. Am J Respir Crit Care Med. 2009;180:1076–1082. doi: 10.1164/rccm.200906-0939OC. [DOI] [PubMed] [Google Scholar]
- Moher D, Liberati A, Tetzlaff J, Altman DG. Preferred reporting items for systematic reviews and meta-analyses: the PRISMA statement. J Clin Epidemiol. 2009;62(10):1006–1012. doi: 10.1016/j.jclinepi.2009.06.005. [DOI] [PubMed] [Google Scholar]
- Caldeira M, Barros AS, Bilelo MJ, Parada A, Camara JS, Rocha SM. Profiling allergic asthma volatile metabolic patterns using a headspace-solid phase microextraction/gas chromatography based methodology. J Chromatogr A. 2011;1218(24):3771–3780. doi: 10.1016/j.chroma.2011.04.026. [DOI] [PubMed] [Google Scholar]
- Caldeira M, Perestrelo R, Barros AS, Bilelo MJ, Morete A, Camara JS, Rocha SM. Allergic asthma exhaled breath metabolome: A challenge for comprehensive two-dimensional gas chromatography. J Chromatogr A. 2012;1254:87–97. doi: 10.1016/j.chroma.2012.07.023. [DOI] [PubMed] [Google Scholar]
- Dallinga JW, Robroeks CM, van Berkel JJ, Moonen EJ, Godschalk RW, Jöbsis Q, Dompeling E, Wouters EF, van Schooten FJ. Volatile organic compounds in exhaled breath as a diagnostic tool for asthma in children. Clin Exp Allergy. 2010;40(1):68–76. doi: 10.1111/j.1365-2222.2009.03343.x. [DOI] [PubMed] [Google Scholar]
- Ibrahim B, Basanta M, Cadden P, Singh D, Douce D, Woodcock A, Fowler SJ. Non-invasive phenotyping using exhaled volatile organic compounds in asthma. Thorax. 2011;66(9):804–809. doi: 10.1136/thx.2010.156695. [DOI] [PubMed] [Google Scholar]
- Larstad MA, Toren K, Bake B, Olin AC. Determination of ethane, pentane and isoprene in exhaled air–effects of breath-holding, flow rate and purified air. Acta Physiol (Oxf) 2007;189(1):87–98. doi: 10.1111/j.1748-1716.2006.01624.x. [DOI] [PubMed] [Google Scholar]
- Montuschi P, Santonico M, Mondino C, Pennazza G, Mantini G, Martinelli E, Capuano R, Ciabattoni G, Paolesse R, Di Natale C. et al. Diagnostic performance of an electronic nose, fractional exhaled nitric oxide, and lung function testing in asthma. Chest. 2010;137(4):790–796. doi: 10.1378/chest.09-1836. [DOI] [PubMed] [Google Scholar]
- Olopade CO, Zakkar M, Swedler WI, Rubinstein I. Exhaled pentane levels in acute asthma. Chest. 1997;111(4):862–865. doi: 10.1378/chest.111.4.862. [DOI] [PubMed] [Google Scholar]
- Paredi P, Kharitonov SA, Barnes PJ. Elevation of exhaled ethane concentration in asthma. Am J Respir Crit Care Med. 2000;162:1450–1454. doi: 10.1164/ajrccm.162.4.2003064. [DOI] [PubMed] [Google Scholar]
- Basanta M, Jarvis RM, Xu Y, Blackburn G, Tal-Singer R, Woodcock A, Singh D, Goodacre R, Thomas CL, Fowler SJ. Non-invasive metabolomic analysis of breath using differential mobility spectrometry in patients with chronic obstructive pulmonary disease and healthy smokers. Analyst. 2010;135(2):315–320. doi: 10.1039/b916374c. [DOI] [PubMed] [Google Scholar]
- Cristescu SM, Gietema HA, Blanchet L, Kruitwagen CL, Munnik P, van Klaveren RJ, Lammers JW, Buydens L, Harren FJ, Zanen P. Screening for emphysema via exhaled volatile organic compounds. J Breath Res. 2011;5(4):046009. doi: 10.1088/1752-7155/5/4/046009. [DOI] [PubMed] [Google Scholar]
- Fens N, Roldaan AC, van der Schee MP, Boksem RJ, Zwinderman AH, Bel EH, Sterk PJ. External validation of exhaled breath profiling using an electronic nose in the discrimination of asthma with fixed airways obstruction and chronic obstructive pulmonary disease. Clin Exp Allergy. 2011;41(10):1371–1378. doi: 10.1111/j.1365-2222.2011.03800.x. [DOI] [PubMed] [Google Scholar]
- Hattesohl AD, Jorres RA, Dressel H, Schmid S, Vogelmeier C, Greulich T, Noeske S, Bals R, Koczulla AR. Discrimination between COPD patients with and without alpha 1-antitrypsin deficiency using an electronic nose. Respirology. 2011;16(8):1258–1264. doi: 10.1111/j.1440-1843.2011.02047.x. [DOI] [PubMed] [Google Scholar]
- Hauschild AC, Baumbach JI, Baumbach J. Integrated statistical learning of metabolic ion mobility spectrometry profiles for pulmonary disease identification. Genet Mol Res. 2012;11(AOP) doi: 10.4238/2012.July.10.17. [DOI] [PubMed] [Google Scholar]
- Paredi P, Kharitonov SA, Leak D, Ward S, Cramer D, Barnes PJ. Exhaled ethane, a marker of lipid peroxidation, is elevated in chronic obstructive pulmonary disease. Am J Respir Crit Care Med. 2000;162(2 Pt 1):369–373. doi: 10.1164/ajrccm.162.2.9909025. [DOI] [PubMed] [Google Scholar]
- Phillips CO, Syed Y, Parthalain NM, Zwiggelaar R, Claypole TC, Lewis KE. Machine learning methods on exhaled volatile organic compounds for distinguishing COPD patients from healthy controls. J Breath Res. 2012;6(3):036003. doi: 10.1088/1752-7155/6/3/036003. [DOI] [PubMed] [Google Scholar]
- Timms C, Thomas PS, Yates DH. Detection of gastro-oesophageal reflux disease (GORD) in patients with obstructive lung disease using exhaled breath profiling. J Breath Res. 2012;6(1):016003. doi: 10.1088/1752-7155/6/1/016003. [DOI] [PubMed] [Google Scholar]
- van Berkel JJ, Dallinga JW, Moller GM, Godschalk RW, Moonen EJ, Wouters EF, van Schooten FJ. A profile of volatile organic compounds in breath discriminates COPD patients from controls. Respir Med. 2010;104(4):557–563. doi: 10.1016/j.rmed.2009.10.018. [DOI] [PubMed] [Google Scholar]
- Barker M, Hengst M, Schmid J, Buers HJ, Mittermaier B, Klemp D, Koppmann R. Volatile organic compounds in the exhaled breath of young patients with cystic fibrosis. Eur Respir J. 2006;27(5):929–936. doi: 10.1183/09031936.06.00085105. [DOI] [PubMed] [Google Scholar]
- Enderby B, Smith D, Carroll W, Lenney W. Hydrogen cyanide as a biomarker for Pseudomonas aeruginosa in the breath of children with cystic fibrosis. Pediatr Pulmonol. 2009;44(2):142–147. doi: 10.1002/ppul.20963. [DOI] [PubMed] [Google Scholar]
- Gilchrist FJ, Razavi C, Webb AK, Jones AM, Spanel P, Smith D, Lenney W. An investigation of suitable bag materials for the collection and storage of breath samples containing hydrogen cyanide. J Breath Res. 2012;6(3):036004. doi: 10.1088/1752-7155/6/3/036004. [DOI] [PubMed] [Google Scholar]
- Kamboures MA, Blake DR, Cooper DM, Newcomb RL, Barker M, Larson JK, Meinardi S, Nussbaum E, Rowland FS. Breath sulfides and pulmonary function in cystic fibrosis. Proc Natl Acad Sci USA. 2005;102(44):15762–15767. doi: 10.1073/pnas.0507263102. [DOI] [PMC free article] [PubMed] [Google Scholar]
- McGrath LT, Patrick R, Mallon P, Dowey L, Silke B, Norwood W, Elborn S. Breath isoprene during acute respiratory exacerbation in cystic fibrosis. Eur Respir J. 2000;16(6):1065–1069. doi: 10.1034/j.1399-3003.2000.16f08.x. [DOI] [PubMed] [Google Scholar]
- Paredi P, Kharitonov SA, Leak D, Shah PL, Cramer D, Hodson ME, Barnes PJ. Exhaled ethane is elevated in cystic fibrosis and correlates with carbon monoxide levels and airway obstruction. Am J Respir Crit Care Med. 2000;161(4 Pt 1):1247–1251. doi: 10.1164/ajrccm.161.4.9906122. [DOI] [PubMed] [Google Scholar]
- Shestivska V, Nemec A, Drevinek P, Sovova K, Dryahina K, Spanel P. Quantification of methyl thiocyanate in the headspace of Pseudomonas aeruginosa cultures and in the breath of cystic fibrosis patients by selected ion flow tube mass spectrometry. Rapid Commun Mass Spectrom. 2011;25(17):2459–2467. doi: 10.1002/rcm.5146. [DOI] [PubMed] [Google Scholar]
- Bajtarevic A, Ager C, Pienz M, Klieber M, Schwarz K, Ligor M, Ligor T, Filipiak W, Denz H, Fiegl M. et al. Noninvasive detection of lung cancer by analysis of exhaled breath. BMC Cancer. 2009;9:348. doi: 10.1186/1471-2407-9-348. [DOI] [PMC free article] [PubMed] [Google Scholar]
- Buszewski B, Ligor T, Jezierski T, Wenda-Piesik A, Walczak M, Rudnicka J. Identification of volatile lung cancer markers by gas chromatography–mass spectrometry: comparison with discrimination by canines. Anal Bioanal Chem. 2012;404(1):141–146. doi: 10.1007/s00216-012-6102-8. [DOI] [PMC free article] [PubMed] [Google Scholar]
- Crohns M, Saarelainen S, Laitinen J, Peltonen K, Alho H, Kellokumpu-Lehtinen P. Exhaled pentane as a possible marker for survival and lipid peroxidation during radiotherapy for lung cancer–a pilot study. Free Radic Res. 2009;43(10):965–974. doi: 10.1080/10715760903159162. [DOI] [PubMed] [Google Scholar]
- D'Amico A, Pennazza G, Santonico M, Martinelli E, Roscioni C, Galluccio G, Paolesse R, Di Natale C. An investigation on electronic nose diagnosis of lung cancer. Lung Cancer. 2010;68(2):170–176. doi: 10.1016/j.lungcan.2009.11.003. [DOI] [PubMed] [Google Scholar]
- Fuchs P, Loeseken C, Schubert JK, Miekisch W. Breath gas aldehydes as biomarkers of lung cancer. Int J Cancer. 2010;126(11):2663–2670. doi: 10.1002/ijc.24970. [DOI] [PubMed] [Google Scholar]
- Gaspar EM, Lucena AF, Duro da Costa J, Chaves das Neves H. Organic metabolites in exhaled human breath–a multivariate approach for identification of biomarkers in lung disorders. J Chromatogr A. 2009;1216(14):2749–2756. doi: 10.1016/j.chroma.2008.10.125. [DOI] [PubMed] [Google Scholar]
- Gordon SM, Szidon JP, Krotoszynski BK, Gibbons RD, O'Neill HJ. Volatile organic compounds in exhaled air from patients with lung cancer. Clin Chem. 1985;31(8):1278–1282. [PubMed] [Google Scholar]
- Kischkel S, Miekisch W, Sawacki A, Straker EM, Trefz P, Amann A, Schubert JK. Breath biomarkers for lung cancer detection and assessment of smoking related effects–confounding variables, influence of normalization and statistical algorithms. Clin Chim Acta. 2010;411(21–22):1637–1644. doi: 10.1016/j.cca.2010.06.005. [DOI] [PubMed] [Google Scholar]
- Ligor M, Ligor T, Bajtarevic A, Ager C, Pienz M, Klieber M, Denz H, Fiegl M, Hilbe W, Weiss W. et al. Determination of volatile organic compounds in exhaled breath of patients with lung cancer using solid phase microextraction and gas chromatography mass spectrometry. Clin Chem Lab Med. 2009;47(5):550–560. doi: 10.1515/CCLM.2009.133. [DOI] [PubMed] [Google Scholar]
- Mazzone PJ, Hammel J, Dweik R, Na J, Czich C, Laskowski D, Mekhail T. Diagnosis of lung cancer by the analysis of exhaled breath with a colorimetric sensor array. Thorax. 2007;62(7):565–568. doi: 10.1136/thx.2006.072892. [DOI] [PMC free article] [PubMed] [Google Scholar]
- Mazzone PJ, Wang XF, Xu Y, Mekhail T, Beukemann MC, Na J, Kemling JW, Suslick KS, Sasidhar M. Exhaled breath analysis with a colorimetric sensor array for the identification and characterization of lung cancer. J Thorac Oncol. 2012;7(1):137–142. doi: 10.1097/JTO.0b013e318233d80f. [DOI] [PMC free article] [PubMed] [Google Scholar]
- Peng G, Tisch U, Adams O, Hakim M, Shehada N, Broza YY, Billan S, Abdah-Bortnyak R, Kuten A, Haick H. Diagnosing lung cancer in exhaled breath using gold nanoparticles. Nat Nanotechnol. 2009;4(10):669–673. doi: 10.1038/nnano.2009.235. [DOI] [PubMed] [Google Scholar]
- Peng G, Hakim M, Broza YY, Billan S, Abdah-Bortnyak R, Kuten A, Tisch U, Haick H. Detection of lung, breast, colorectal, and prostate cancers from exhaled breath using a single array of nanosensors. BJC. 2010;103:542–551. doi: 10.1038/sj.bjc.6605810. [DOI] [PMC free article] [PubMed] [Google Scholar]
- Phillips M, Gleeson K, Hughes JM, Greenberg J, Cataneo RN, Baker L, McVay WP. Volatile organic compounds in breath as markers of lung cancer: a cross-sectional study. Lancet. 1999;353(9168):1930–1933. doi: 10.1016/S0140-6736(98)07552-7. [DOI] [PubMed] [Google Scholar]
- Phillips M, Altorki N, Austin JH, Cameron RB, Cataneo RN, Greenberg J, Kloss R, Maxfield RA, Munawar MI, Pass HI. et al. Prediction of lung cancer using volatile biomarkers in breath. Cancer Biomark. 2007;3(2):95–109. doi: 10.3233/cbm-2007-3204. [DOI] [PubMed] [Google Scholar]
- Phillips M, Altorki N, Austin JH, Cameron RB, Cataneo RN, Kloss R, Maxfield RA, Munawar MI, Pass HI, Rashid A. et al. Detection of lung cancer using weighted digital analysis of breath biomarkers. Clin Chim Acta. 2008;393(2):76–84. doi: 10.1016/j.cca.2008.02.021. [DOI] [PMC free article] [PubMed] [Google Scholar]
- Poli D, Carbognani P, Corradi M, Goldoni M, Acampa O, Balbi B, Bianchi L, Rusca M, Mutti A. Exhaled volatile organic compounds in patients with non-small cell lung cancer: cross sectional and nested short-term follow-up study. Respir Res. 2005;6:71. doi: 10.1186/1465-9921-6-71. [DOI] [PMC free article] [PubMed] [Google Scholar]
- Poli D, Goldoni M, Caglieri A, Ceresa G, Acampa O, Carbognani P, Rusca M, Corradi M. Breath analysis in non small cell lung cancer patients after surgical tumour resection. Acta Biomed. 2008;79(Suppl 1):64–72. [PubMed] [Google Scholar]
- Poli D, Goldoni M, Corradi M, Acampa O, Carbognani P, Internullo E, Casalini A, Mutti A. Determination of aldehydes in exhaled breath of patients with lung cancer by means of on-fiber-derivatisation SPME-GC/MS. J Chromatogr B Analyt Technol Biomed Life Sci. 2010;878(27):2643–2651. doi: 10.1016/j.jchromb.2010.01.022. [DOI] [PubMed] [Google Scholar]
- Preti G, Labows JN, Kostelc JG, Aldinger S, Daniele R. Analysis of lung air from patients with bronchogenic carcinoma and controls using gas chromatography–mass spectrometry. J Chromatogr. 1988;432:1–11. doi: 10.1016/s0378-4347(00)80627-1. [DOI] [PubMed] [Google Scholar]
- Rudnicka J, Kowalkowski T, Ligor T, Buszewski B. Determination of volatile organic compounds as biomarkers of lung cancer by SPME-GC-TOF/MS and chemometrics. J Chromatogr B Analyt Technol Biomed Life Sci. 2011;879(30):3360–3366. doi: 10.1016/j.jchromb.2011.09.001. [DOI] [PubMed] [Google Scholar]
- Skeldon KD, McMillan LC, Wyse CA, Monk SD, Gibson G, Patterson C, France T, Longbottom C, Padgett MJ. Application of laser spectroscopy for measurement of exhaled ethane in patients with lung cancer. Respir Med. 2006;100(2):300–306. doi: 10.1016/j.rmed.2005.05.006. [DOI] [PubMed] [Google Scholar]
- Song G, Qin T, Liu H, Xu GB, Pan YY, Xiong FX, Gu KS, Sun GP, Chen ZD. Quantitative breath analysis of volatile organic compounds of lung cancer patients. Lung Cancer. 2010;67(2):227–231. doi: 10.1016/j.lungcan.2009.03.029. [DOI] [PubMed] [Google Scholar]
- Steeghs MM, Cristescu SM, Munnik P, Zanen P, Harren FJ. An off-line breath sampling and analysis method suitable for large screening studies. Physiol Meas. 2007;28(5):503–514. doi: 10.1088/0967-3334/28/5/005. [DOI] [PubMed] [Google Scholar]
- Ulanowska A, Kowalkowski T, Trawinska E, Buszewski B. The application of statistical methods using VOCs to identify patients with lung cancer. J Breath Res. 2011;5(4):046008. doi: 10.1088/1752-7155/5/4/046008. [DOI] [PubMed] [Google Scholar]
- Wehinger A, Schmid A, Mechtcheriakov S, Ledochowski M, Grabmer C, Gastl GA, Amann A. Lung cancer detection by proton transfer reaction mass-spectrometric analysis of human breath gas. Int J Mass Spectrom. 2007;265:49–59. doi: 10.1016/j.ijms.2007.05.012. [DOI] [Google Scholar]
- Westhoff M, Litterst P, Freitag L, Urfer W, Bader S, Baumbach JI. Ion mobility spectrometry for the detection of volatile organic compounds in exhaled breath of patients with lung cancer: results of a pilot study. Thorax. 2009;64(9):744–748. doi: 10.1136/thx.2008.099465. [DOI] [PubMed] [Google Scholar]
- Chapman EA, Thomas PS, Stone E, Lewis C, Yates DH. A breath test for malignant mesothelioma using an electronic nose. Eur Respir J. 2012;40(2):448–454. doi: 10.1183/09031936.00040911. [DOI] [PubMed] [Google Scholar]
- Dragonieri S, van der Schee MP, Massaro T, Schiavulli N, Brinkman P, Pinca A, Carratu P, Spanevello A, Resta O, Musti M. et al. An electronic nose distinguishes exhaled breath of patients with Malignant Pleural Mesothelioma from controls. Lung Cancer. 2012;75(3):326–331. doi: 10.1016/j.lungcan.2011.08.009. [DOI] [PubMed] [Google Scholar]
- de Gennaro G, Dragonieri S, Longobardi F, Musti M, Stallone G, Trizio L, Tutino M. Chemical characterization of exhaled breath to differentiate between patients with malignant plueral mesothelioma from subjects with similar professional asbestos exposure. Anal Bioanal Chem. 2010;398(7–8):3043–3050. doi: 10.1007/s00216-010-4238-y. [DOI] [PubMed] [Google Scholar]
- Chambers ST, Syhre M, Murdoch DR, McCartin F, Epton MJ. Detection of 2-pentylfuran in the breath of patients with Aspergillus fumigatus. Med Mycol. 2009;47(5):468–476. doi: 10.1080/13693780802475212. [DOI] [PubMed] [Google Scholar]
- Hanson CW 3rd, Thaler ER. Electronic nose prediction of a clinical pneumonia score: biosensors and microbes. Anesthesiology. 2005;102(1):63–68. doi: 10.1097/00000542-200501000-00013. [DOI] [PubMed] [Google Scholar]
- Hockstein NG, Thaler ER, Torigian D, Miller WT Jr, Deffenderfer O, Hanson CW. Diagnosis of pneumonia with an electronic nose: correlation of vapor signature with chest computed tomography scan findings. Laryngoscope. 2004;114(10):1701–1705. doi: 10.1097/00005537-200410000-00005. [DOI] [PubMed] [Google Scholar]
- Hockstein NG, Thaler ER, Lin Y, Lee DD, Hanson CW. Correlation of pneumonia score with electronic nose signature: A prospective study. Ann Otol Rhinol Laryngol. 2005;114(7):504–508. doi: 10.1177/000348940511400702. [DOI] [PubMed] [Google Scholar]
- Kanoh S, Kobayashi H, Motoyoshi K. Exhaled ethane: an in vivo biomarker of lipid peroxidation in interstitial lung diseases. Chest. 2005;128(4):2387–2392. doi: 10.1378/chest.128.4.2387. [DOI] [PubMed] [Google Scholar]
- Kolk AH, van Berkel JJ, Claassens MM, Walters E, Kuijper S, Dallinga JW, van Schooten FJ. Breath analysis as a potential diagnostic tool for tuberculosis. Int J Tuberc Lung Dis. 2012;16(6):777–782. doi: 10.5588/ijtld.11.0576. [DOI] [PubMed] [Google Scholar]
- Phillips M, Cataneo RN, Condos R, Ring Erickson GA, Greenberg J, La Bombardi V, Munawar MI, Tietje O. Volatile biomarkers of pulmonary tuberculosis in the breath. Tuberculosis. 2007;87(1):44–52. doi: 10.1016/j.tube.2006.03.004. [DOI] [PubMed] [Google Scholar]
- Phillips M, Basa-Dalay V, Bothamley G, Cataneo RN, Lam PK, Natividad MP, Schmitt P, Wai J. Breath biomarkers of active pulmonary tuberculosis. Tuberculosis. 2010;90(2):145–151. doi: 10.1016/j.tube.2010.01.003. [DOI] [PubMed] [Google Scholar]
- Phillips M, Basa-Dalay V, Blais J, Bothamley G, Chaturvedi A, Modi KD, Pandya M, Natividad MP, Patel U, Ramraje NN. et al. Point-of-care breath test for biomarkers of active pulmonary tuberculosis. Tuberculosis. 2012;92(4):314–320. doi: 10.1016/j.tube.2012.04.002. [DOI] [PubMed] [Google Scholar]
- Syhre M, Manning L, Phuanukoonnon S, Harino P, Chambers ST. The scent of Mycobacterium tuberculosis–part II breath. Tuberculosis. 2009;89(4):263–266. doi: 10.1016/j.tube.2009.04.003. [DOI] [PubMed] [Google Scholar]
- Scholpp J, Schubert JK, Miekisch W, Geiger K. Breath markers and soluble lipid peroxidation markers in critically ill patients. Clin Chem Lab Med. 2002;40(6):587–594. doi: 10.1515/CCLM.2002.101. [DOI] [PubMed] [Google Scholar]
- Schubert JK, Muller WP, Benzing A, Geiger K. Application of a new method for analysis of exhaled gas in critically ill patients. Intensive Care Med. 1998;24(5):415–421. doi: 10.1007/s001340050589. [DOI] [PubMed] [Google Scholar]
- Fens N, de Nijs SB, Peters S, Dekker T, Knobel HH, Vink TJ, Willard NP, Zwinderman AH, Krouwels FH, Janssen HG. et al. Exhaled air molecular profiling in relation to inflammatory subtype and activity in COPD. Eur Respir J. 2011;38(6):1301–1309. doi: 10.1183/09031936.00032911. [DOI] [PubMed] [Google Scholar]
- Fuchs D, Jamnig H, Heininger P, Klieber M, Schroecksnadel S, Fiegl M, Hackl M, Denz H, Amann A. Decline of exhaled isoprene in lung cancer patients correlates with immune activation. J Breath Res. 2012;6(2):027101. doi: 10.1088/1752-7155/6/2/027101. [DOI] [PubMed] [Google Scholar]
- Filipiak W, Ruzsanyi V, Mochalski P, Filipiak A, Bajtarevic A, Ager C, Denz H, Hilbe W, Jamnig H, Hackl M. et al. Dependence of exhaled breath composition on exogenous factors, smoking habits and exposure to air pollutants. J Breath Res. 2012;6(3):036008. doi: 10.1088/1752-7155/6/3/036008. [DOI] [PMC free article] [PubMed] [Google Scholar]
- Horvath I, Hunt J, Barnes PJ, Alving K, Antczak A, Baraldi E, Becher G, van Beurden WJ, Corradi M, Dekhuijzen R. et al. Exhaled breath condensate: methodological recommendations and unresolved questions. Eur Respir J. 2005;26(3):523–548. doi: 10.1183/09031936.05.00029705. [DOI] [PubMed] [Google Scholar]