

Abstract
Background: New direct-acting antiviral agents for hepatitis C genotype 1 infection, boceprevir and telaprevir, offer enhanced sustained virologic response (SVR) among both treatment-naïve and treatment-experienced patients.
Aim: To determine the relative efficacy of the new direct-acting antiviral agents by applying a multiple treatment comparison meta-analysis.
Design: We included published Phase II and III randomized controlled trials evaluating head-to-head comparisons between boceprevir, telaprevir, peg-interferon alpha-2a with ribavirin and peg-interferon alpha-2b with ribavirin in hepatitis C genotype 1 patients. We applied Bayesian multiple treatment comparison meta-analysis.
Results: We included data from four boceprevir, three telaprevir and six peg-interferon alpha-2a plus ribavirin vs. peg-interferon alpha-2b plus ribavirin randomized controlled trials. Both boceprevir and telaprevir offer statistically superior outcomes for SVR, relapse and discontinuation due to adverse events than either peg-interferons among both treatment-naïve and treatment-experienced patients. Among treatment-naïve patients, clinical outcomes were similar for boceprevir and telaprevir, for SVR [odds ratio (OR) 0.90, 95% credible interval (95% CrI) 0.41–1.91] and for relapse (OR 1.09, 95% CrI 0.19–4.84). Similarly, among treatment-experienced patients, clinical outcomes were similar for boceprevir and telaprevir and for SVR (OR 1.45, 95% CrI 0.70–3.08) and for relapse (OR 0.35, 95% CrI 0.13–1.02). For treatment-naïve patients receiving standard-duration therapy, telaprevir yielded lower rates of anemia and neutropenia, but higher rates of rash and pruritus. For treatment-experience patients, all adverse event rates were higher with telaprevir.
Discussion: Boceprevir and telaprevir exhibit similar effects among hepatitis C genotype 1 treatment-naïve and treatment-experienced patients.
Introduction
Treatment for hepatitis C virus (HCV) infection is rapidly evolving, with several exciting new treatment developments, offering hope to both treatment-naïve HCV patients and patients who had previously exhausted their treatment options. In particular, two direct-acting antiviral compounds, telaprevir (TVR) and boceprevir (BOC) have recently been approved in Europe and North America for the treatment of HCV genotype 1 infection, the most common genotype in these regions.1,2
TVR, a linear peptidomimetic HCV non-structural 3 (NS3)/4A serine protease inhibitor, and BOC, a protease inhibitor that binds to the HCV NS3 active site, are now recommended for use in combination with peg-interferon alpha (peg-INF alpha) plus ribavirin (RIB) for HCV genotype 1 patients. Several large randomized trials demonstrate that both TVR and BOC, in combination with standard treatment, offer very favorable outcomes in terms of sustained virologic response (SVR). These benefits appear for both treatment-naïve patients (those who have not received any drug therapy for their HCV infection)3–6 and treatment-experienced patients (those who have previously been treated for HCV and did not achieve a SVR to the therapy)7–9 when compared to standard therapy alone.
No direct head-to-head clinical trials have evaluated the superiority or non-inferiority of these new agents. A new statistical approach, termed ‘multiple treatment comparison’ (MTC) meta-analysis, allows an analysis of the comparative effectiveness of these agents compared with existing standard treatments to determine their relative effectiveness. This clinically useful tool allows the reader to determine the effectiveness of all examined interventions compared with each other.10 We aimed to evaluate the relative effectiveness of standard treatment with peg-INF alpha-2a or alpha-2b plus RIB and the new direct-acting antivirals, TVR and BOC, in combination with these standard treatments among HCV genotype 1 patients.
Methods
Eligibility criteria
We included published Phase II and III randomized controlled trials (RCTs) examining the efficacy and safety of peg-INF alpha-2a or peg-INF alpha-2b plus RIB, and TVR and BOC in combination with peg-INF alpha-2a or peg-INF alpha-2b plus RIB. We considered both standard-duration therapy and response-guided therapy regimens (refer to Table 1 for the definition of each standard-duration and response-guided regimen eligible).
Table 1.
Standard-duration therapy and response-guided therapy regimens
| Regimen | Treatment | Dose | Course of treatment |
|---|---|---|---|
| Standard-duration therapy | |||
| Peg-IFN alpha-2a + RIB | Peg-INF alpha-2a | 180 µg/week | Peg-IFN alpha-2a + RIB for 48 weeks |
| RIB | 600–1400 mg/day | ||
| Peg-IFN alpha-2b + RIB | Peg-INF alpha-2b | 1.5 µg/kg/week | Peg-IFN alpha-2b + RIB for 48 weeks |
| RIB | 600–1400 mg/day | ||
| TVR + Peg-IFN alpha-2a or -2b + RIB | TVR | 750 mg, three times a day | TVR combined with Peg-IFN alpha-2a or -2b + RIB for 12 weeks, followed by Peg-IFN alpha-2a or -2b + RIB alone for 36 weeks |
| Peg-INF alpha-2a or -2b | Peg-INF alpha-2a 180 µg/week; peg-INF alpha-2b 1.5 µg/kg/week | ||
| RIB | 600–1400 mg/day | ||
| BOC + Peg-IFN alpha-2a or -2b + RIB | BOC | 800 mg, three times a day | Peg-IFN alpha-2a or -2b for 4 weeks, followed by Peg-IFN alpha-2a or -2b as well as BOC for 44 weeks |
| Peg-INF alpha-2a or -2b | Peg-INF alpha-2a 180 µg/week; peg-INF alpha-2b 1.5 µg/kg/week | ||
| RIB | 600–1400 mg/day | ||
| Response-guided therapy | |||
| TVR + Peg-IFN alpha-2a or -2b + RIB | TVR | 750 mg, three times a day | TVR combined with Peg-IFN alpha-2a or -2b for 12 weeks, followed by Peg-IFN alpha-2a or -2b alone for 12 weeks if HCV RNA was undetectable between Weeks 4 and 12 or for 36 weeks if HCV RNA was detectable at any time between Weeks 4 and 12 |
| Peg-INF alpha-2a or -2b | Peg-INF alpha-2a 180 µg/week; peg-INF alpha-2b 1.5 µg/kg/week | ||
| RIB | 600–1400 mg/day | ||
| BOC + Peg-IFN alpha-2a or -2b + RIB | BOC | 800 mg, three times a day | Peg-IFN alpha-2a or -2b for 4 weeks, followed by Peg-IFN alpha-2a or -2b as well as BOC for up to 36 weeks if HCV RNA was undetectable between Weeks 8 and 24 or for 44 weeks if HCV RNA was detectable at any time between Weeks 8 and 24 |
| Peg-INF alpha-2a or -2b | Peg-INF alpha-2a 180 µg/week; peg-INF alpha-2b 1.5 µg/kg/week | ||
| RIB | 600–1400 mg/day | ||
Included RCTs must have had a common comparison so that a common comparator could be made. Only RCTs reporting outcomes predominantly for genotype 1 HCV infected adult patients were considered. A priori we were aware that some RCTs may provide outcomes for genotype 1 and genotype 4 patients combined. Where possible, we considered only outcomes for genotype 1 patients, but where not possible, we included the outcomes for genotype 1 and genotype 4 patients combined. Both treatment-naïve and treatment-experienced populations were considered. We excluded trials conducted among co-infected patients (e.g. HIV and hepatitis B).
Search strategy
In consultation with a medical librarian, two investigators (K.T. and E.D.) conducted a comprehensive systematic search of the literature. The searches included the following terms: boceprevir, telaprevir, peginterferon, peg-interferon, pegylated interferon, ribavirin and hepatitis C. Each search was limited to RCTs in humans. Searches were not limited by language, sex or age. The searches were performed using the following databases [from inception to Week 4 of 2012 (23–29 January)]: MEDLINE (via PubMed), EMBASE, Cochrane CENTRAL, AMED, CINAHL, TOXNET, Development and Reproductive Toxicology, Hazardous Substances Databank, PsychINFO and Web of Science (refer to Appendix 1 for an example of a full electronic search strategy utilized). The bibliographies of published systematic and narrative reviews and relevant included trials were also searched.
Data abstraction and endpoints
Two investigators (K.T. and E.D.) working independently, in duplicate, abstracted data on the following efficacy outcomes: the proportion of patients achieving SVR (defined as an undetectable HCV RNA at the end of the 24-week post-therapy follow-up period), the proportion of patients relapsing (defined as a reoccurrence of HCV RNA within the 24-week post-therapy follow-up period) and the proportion of patients discontinuing treatment due to an adverse event (defined as the discontinuation of all assigned study drugs during the set treatment period due to an adverse event). Data were also abstracted for the following commonly reported hematological adverse events: anemia (generally defined as hemoglobin <100 g/l), neutropenia (generally defined as absolute neutrophil count <0.75 × 10⁹/l) and thrombocytopenia (generally defined as a platelet count <150 000/ml). Additionally, data were abstracted for the following commonly reported dermatological adverse events: rash (any, as reported by site investigators) and pruritus (any, as reported by site investigators). These data were only abstracted for the standard-duration therapy and response-guided therapy arms, as described earlier, among both treatment-naïve and treatment-experienced patients. Where necessary, we contacted the primary authors of the trial publications for clarifications on trial data, including study setting, participant inclusion criteria, therapy durations, outcomes data, and in the case where only an abstract was available, to ensure we were utilizing the most current and accurate data.
Statistical analysis
Our analysis applied a MTC method. This approach permits the calculation of the relative difference between treatments that have not been evaluated directly.11 Although statistically complex, this approach is now widely accepted by clinical guideline committees and health regulatory authorities.12 We applied a Bayesian analysis, which permits more sensitivity analyses than a usual frequentist analysis and is more conservative. We present our findings as odds ratios (ORs) and 95% credible intervals (95% CrIs), which are the Bayesian equivalent of confidence intervals.
We assess the following outcomes: SVR, relapse, discontinuation due to adverse events, anemia, neutropenia, thrombocytopenia, rash and pruritis. All outcomes are binary, and so, we modeled (log) ORs for the considered treatment comparisons using Bayesian MTC meta-analysis.13 The statistical technicalities of this approach are described elsewhere.11 For all six comparisons between the four treatments, we calculated median ORs and 95% CrIs from the Bayesian posterior distribution. To check agreement between pair-wise estimates and MTC estimates, we also conducted pair-wise random-effects meta-analysis for all pair-wise comparisons. K.T. and E.D. conducted all statistical analysis. All MTC analyses were conducted using WinBUGS (MRC Biostatistics Unit, Cambridge, UK). All pair-wise meta-analyses were conducted using StatDirect version 9.1.
Results
Table 2 provides the characteristics of the included RCTs. Figure 1 displays a schematic of the trial selection process. Six trials assessed peg-INF alpha-2a plus RIB vs. peg-INF alpha-2b plus RIB,14–19 three assessed TVR in combination with peg-INF alpha-2a plus RIB vs. peg-INF alpha-2a plus RIB alone3,4,7 and four assessed BOC in combination with peg-INF alpha-2b plus RIB vs. peg-INF alpha-2b plus RIB alone.5,6,8,9 Of note, the TVR trials did not permit the use of erythropoietin therapy to treat anemia; however, at the discretion of the investigator, patients in the BOC trials could be prescribed erythropoietin if hemoglobin levels dropped below 10 g/dl.
Table 2.
Characteristics of the included trials
| Trial publications | Region | Experience in the treatment | Regimen | Treatment | No. of patients (n) |
|---|---|---|---|---|---|
| Bacon et al., 20118 | North America and Europe | Experienced | Standard-duration | BOC + peg-IFN alpha-2b + RIB | 161 |
| Response-guided | BOC + peg-IFN alpha-2b + RIB | 162 | |||
| Standard-duration | Peg-IFN alpha-2b + RIB | 80 | |||
| Flamm et al., 20119 | North America | Experienced | Standard-duration | BOC + peg-IFN alpha-2a + RIB | 134 |
| Standard-duration | Peg-IFN alpha-2a + RIB | 67 | |||
| Jacobson et al., 20113 | International | Naïve | Response-guided | TVR + peg-IFN alpha-2a + RIB | 361 |
| Standard-duration | Peg-IFN alpha-2a + RIB | 363 | |||
| Poordad et al., 20116 | North America and Europe | Naïve | Standard-duration | BOC + peg-IFN alpha-2b + RIB | 366 |
| Response-guided | BOC + peg-IFN alpha-2b + RIB | 368 | |||
| Standard-duration | Peg-IFN alpha-2b + RIB | 363 | |||
| Zeuzem et al., 20117 | International | Experienced | Standard-duration | TVR + peg-IFN alpha-2a + RIB | 132 |
| Standard-duration | Peg-IFN alpha-2a + RIB | 266 | |||
| Ascione et al., 20101,4 | Europe | Naïve | Standard-duration | Peg-IFN alpha-2a + RIB | 93 |
| Standard-duration | Peg-IFN alpha-2b + RIB | 93 | |||
| Kwo et al., 20105 | North America and Europe | Naïve | Standard-duration | BOC + peg-IFN alpha-2b + RIB | 103 |
| Standard-duration | Peg-IFN alpha-2b + RIB | 104 | |||
| Rumi et al., 20101,5 | Europe | Naïve | Standard-duration | Peg-IFN alpha-2a + RIB | 91 |
| Standard-duration | Peg-IFN alpha-2b + RIB | 87 | |||
| McHutchison et al., 20094 | North America | Naïve | Standard-duration | TVR + peg-IFN alpha-2a + RIB | 75 |
| Standard-duration | Peg-IFN alpha-2a + RIB | 79 | |||
| McHutchison et al., 20091,6 | North America | Naïve | Standard-duration | Peg-IFN alpha-2a + RIB | 1035 |
| Standard-duration | Peg-IFN alpha-2b + RIB | 1019 | |||
| Scotto et al., 20081,7 | Europe | Experienced | Standard-duration | Peg-IFN alpha-2a + RIB | 45 |
| Standard-duration | Peg-IFN alpha-2b + RIB | 47 | |||
| Scotto et al., 20081,8 | Europe | Experienced | Standard-duration | Peg-IFN alpha-2a + RIB | 37 |
| Standard-duration | Peg-IFN alpha-2b + RIB | 40 | |||
| Yenice et al., 20051,9 | Europe | Naïve | Standard-duration | Peg-IFN alpha-2a + RIB | 40 |
| Standard-duration | Peg-IFN alpha-2b + RIB | 40 | |||
Figure 1.

Study flow diagram.
Nineteen trials extracted for detailed evaluation were excluded for the following reasons: 12 were Phase I trials examining pharmacokinetics, tolerability or safety (nine of which assessed TVR and three of which assessed BOC),20–31 three did not examine a standard-duration or response-guided therapy arm (each of which assessed TVR),32–34 three did not examine a control treatment nor common comparator (each of which assessed TVR)35–37 and one did not examine the outcomes of interest specifically for genotype 1 or genotype 1/4 (which assessed TVR).38 Refer to Table A1 for a list of the excluded trials.
For treatment-naïve patients, TVR and BOC were linked through the head-to-head comparisons of peg-INF alpha-2a plus RIB and peg-INF alpha-2b plus RIB for all efficacy measures (Figure 2A). For treatment-experienced patients, head-to-head comparisons of peg-INF alpha-2a plus RIB and peg-INF alpha-2b plus RIB were not available, and thus, TVR and BOC were linked through the assumption that peg-INF alpha-2a plus RIB and peg-INF alpha-2b plus RIB were similar in terms of efficacy and safety (Figure 2B).
Figure 2.
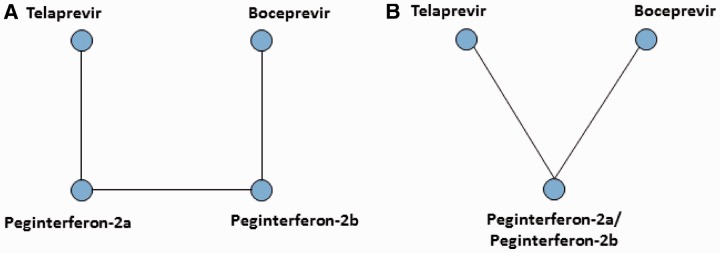
Treatment networks employed in the analyses. (A) Treatment network for treatment-naïve patients receiving standard-duration therapy or response-guided therapy and (B) treatment network for treatment-experienced patients receiving standard-duration therapy.
Table 3 presents the ORs and 95% CrIs for the efficacy measures, SVR, relapse to treatment and discontinuation due to adverse events. For treatment-naïve patients receiving standard-duration therapy, TVR and BOC were statistically comparable in terms of SVR and relapse, as indicated by the wide 95% CrIs (note that data on discontinuations due to adverse events were not available among naïve patients provided standard-duration therapy). Similarly, for treatment-experienced patients on standard-duration therapy, TVR and BOC were statistically comparable, in terms of SVR, relapse and discontinuations due to adverse events, as indicated by the wide 95% CrIs. Furthermore, for treatment-naïve patients receiving response-guided therapy, TVR and BOC were also statistically comparable, in terms of SVR, relapse and discontinuations due to adverse events, as indicated by the wide 95% CrIs (note that no trial reported on treatment-experienced patients receiving response-guided therapy). Finally, TVR and BOC both yielded higher SVR rates, lower relapse rates and higher discontinuation rates than the two peg-INF alpha plus RIB regimens. Table A2 presents the corresponding pair-wise comparisons from the pair-wise random-effects meta-analyses.
Table 3.
ORs and 95% CrIs for the three efficacy measures
| Comparison in the treatment | SVR, OR (95% CrI) | Relapse, OR (95% CrI) | Discontinuation due to adverse events, OR 2(95% CrI) |
|---|---|---|---|
| Treatment-naïve patients on standard-duration therapya | |||
| TVR + peg-IFN alpha + RIB vs. BOC + peg-IFN alpha + RIB | 1.11 (0.23–5.68) | 1.09 (0.19–4.83) | – |
| TVR + peg-IFN alpha + RIB vs. peg-IFN alpha-2a + RIB | 2.94 (0.80–5.77) | 0.19 (0.04–0.76) | – |
| BOC + peg-IFN alpha + RIB vs. peg-IFN alpha-2a + RIB | 2.65 (0.89–7.06) | 0.18 (0.09–0.31) | – |
| TVR + peg-IFN alpha + RIB vs. peg-IFN alpha-2b + RIB | 4.22 (1.09–6.87) | 0.29 (0.04–1.18) | – |
| BOC + peg-IFN alpha + RIB vs. peg-IFN alpha-2b + RIB | 3.77 (1.69–4.97) | 0.27 (0.16–0.44) | – |
| Peg-IFN alpha-2a + RIB vs. peg-IFN alpha-2b + RIB | 1.42 (0.83–2.93) | 0.67 (0.52–0.86) | – |
| Treatment-experienced patients on standard-duration therapyb | |||
| TVR + peg-IFN alpha + RIB vs. BOC + peg-IFN alpha + RIB | 1.45 (0.70–3.08) | 0.35 (0.13–1.02) | 0.44 (0.11–1.63) |
| TVR + peg-IFN alpha + RIB vs. peg-IFN alpha + RIB | 10.4 (6.10–18.4) | 0.10 (0.05–0.18) | 3.01 (1.47–7.19) |
| BOC + peg-IFN alpha + RIB vs. peg-IFN alpha + RIB | 7.17 (4.52–11.5) | 0.27 (0.13–0.58) | 6.80 (2.59–24.7) |
| Treatment-naïve patients on response-guided therapyc | |||
| TVR + peg-IFN alpha + RIB vs. BOC + peg-IFN alpha + RIB | 1.54 (0.95–2.07) | 0.99 (0.47–2.12) | 1.11 (0.53–2.32) |
| TVR + peg-IFN alpha + RIB vs. peg-IFN alpha-2a + RIB | 3.80 (2.77–5.21) | 0.24 (0.15–0.37) | 1.43 (0.81–2.60) |
| BOC + peg-IFN alpha + RIB vs. peg-IFN alpha-2a + RIB | 2.47 (1.76–3.46) | 0.23 (0.13–0.43) | 1.30 (0.86–1.99) |
| TVR + peg-IFN alpha + RIB vs. peg-IFN alpha-2b + RIB | 4.40 (3.01–6.28) | 0.36 (0.21–0.60) | 1.42 (0.85–2.43) |
| BOC + peg-IFN alpha + RIB vs. peg-IFN alpha-2b + RIB | 2.85 (2.12–3.86) | 0.36 (0.20–0.62) | 1.28 (0.79–2.13) |
| Peg-IFN alpha-2a + RIB vs. peg-IFN alpha-2b + RIB | 1.42 (0.83–2.93) | 1.50 (0.16–1.94) | 0.99 (0.77–1.27) |
ORs > 1 indicate higher rates in the first treatment group.
aRandom effects MTC model including head-to-head comparison of the two peg-interferons.
bFixed-effect MTC model assuming equal effects of the two peg-interferons.
cFixed-effect MTC model including head-to-head comparison of the two peg-interferons.
Table 4 presents the ORs and 95% CrIs for adverse events of anemia, neutropenia, rash and pruritus. For treatment-naïve patients receiving standard-duration therapy, TVR yielded lower rates of anemia and neutropenia, but higher rates of rash and pruritus. The 95% CrI for rash did not include 1, suggesting statistical evidence of higher incidence of rash episodes in patients treated with TVR compared with BOC. For treatment-experienced patients, all adverse event rates were higher with TVR. For treatment-naïve patients receiving response-guided therapy, TVR and BOC yielded comparable rates of anemia and neutropenia, and TVR yielded higher rates of rash and pruritus. The 95% CrI for rash did not include 1, suggesting statistical evidence of higher incidence of rash episodes in patients treated with TVR compared with BOC. Table A3 presents the corresponding pair-wise comparisons from the pair-wise random-effects meta-analyses.
Table 4.
ORs and 95% CrIs for the four adverse outcomes
| Comparison in the treatment | Anemia, OR (95% CrI) | Neutropenia, OR (95% CrI) | Rash, OR (95% CrI) | Pruritus, OR (95% CrI) |
|---|---|---|---|---|
| Treatment-naïve patients on standard-duration therapya | ||||
| TVR + peg-IFN alpha + RIB vs. BOC + peg-IFN alpha + RIB | 0.44 (0.23–1.03) | 0.86 (0.38–1.98) | 3.09 (1.45–6.65) | 2.37 (0.80–7.07) |
| TVR + peg-IFN alpha + RIB vs. peg-IFN alpha-2a + RIB | 1.13 (0.56–2.31) | 1.01 (0.48–2.15) | 2.22 (1.15–4.23) | 2.35 (1.18–4.89) |
| BOC + peg-IFN alpha + RIB vs. peg-IFN alpha-2a + RIB | 2.41 (1.74–3.31) | 1.16 (0.80–1.67) | 0.72 (0.48–1.07) | 1.00 (0.43–2.27) |
| TVR + peg-IFN alpha + RIB vs. peg-IFN alpha-2b + RIB | 1.11 (0.53–2.33) | 1.32 (0.62–2.85) | 3.06 (1.57–5.99) | 2.20 (0.79–6.29) |
| BOC + peg-IFN alpha + RIB vs. peg-IFN alpha-2b + RIB | 2.35 (1.80–3.08) | 1.53 (1.19–2.09) | 0.99 (0.70–1.40) | 0.93 (0.67–1.29) |
| Peg-IFN alpha-2a + RIB vs. peg-IFN alpha-2b + RIB | 0.98 (0.82–1.17) | 1.32 (1.09–1.60) | 1.37 (1.13–1.68) | 0.93 (0.44–2.04) |
| Treatment-experienced patients on standard-duration therapyb | ||||
| TVR + peg-IFN alpha + RIB vs. BOC + peg-IFN alpha + RIB | 1.65 (0.83–3.37) | 1.72 (0.67–4.38) | 1.13 (0.47–2.67) | 2.52 (1.09–5.70) |
| TVR + peg-IFN alpha + RIB vs. peg-IFN alpha + RIB | 2.42 (1.40–4.73) | 1.41 (0.76–2.77) | 2.57 (1.56–4.32) | 2.88 (1.86–4.58) |
| BOC + peg-IFN alpha + RIB vs. peg-IFN alpha + RIB | 1.46 (0.96–2.21) | 0.81 (0.43–1.64) | 2.28 (1.17–4.71) | 1.15 (0.57–2.31) |
| Treatment-naïve patients on response-guided therapya | ||||
| TVR + peg-IFN alpha + RIB vs. BOC + peg-IFN alpha + RIB | 0.94 (0.60–1.52) | 0.96 (0.57–1.61) | 2.17 (1.32–3.52) | 1.07 (0.44–2.68) |
| TVR + peg-IFN alpha + RIB vs. peg-IFN alpha-2a + RIB | 2.27 (1.69–3.07) | 1.20 (0.81–1.75) | 1.79 (1.35–2.40) | 1.07 (0.48–2.52) |
| BOC + peg-IFN alpha + RIB vs. peg-IFN alpha-2a + RIB | 2.40 (1.69–3.42) | 1.24 (0.87–1.75) | 0.83 (0.57–1.23) | 0.99 (0.71–1.40) |
| TVR + peg-IFN alpha + RIB vs. peg-IFN alpha-2b + RIB | 2.22 (1.56–3.15) | 0.91 (0.65–1.27) | 2.47 (1.75–3.52) | 1.19 (0.91–1.57) |
| BOC + peg-IFN alpha + RIB vs. peg-IFN alpha-2b + RIB | 2.35 (1.73–3.19) | 0.94 (0.63–1.40) | 1.14 (0.82–1.60) | 1.11 (0.46–2.55) |
| Peg-IFN alpha-2a + RIB vs. peg-IFN alpha-2b + RIB | 0.98 (0.82–1.17) | 0.75 (0.62–0.92) | 1.37 (1.12–1.68) | 0.92 (0.42–2.06) |
ORs > 1 indicate higher rates in the first treatment group.
aFixed effects MTC model including head-to-head comparison of the two peg-interferons.
bFixed effect MTC model assuming equal effects of the two peg-interferons.
Although thrombocytopenia was not consistently reported in the trial publications of TVR or BOC, combined data from all trials were available in the US Food and Drug Administration (FDA) reports.39,40 For TVR, 18 of 1823 (1.0%) patients randomized to a treatment arm containing TVR were diagnosed with thrombocytopenia, whereas 1 of 764 (0.1%) patients randomized to a matched placebo arm was diagnosed with thrombocytopenia. For BOC, 49 of 1057 (4.6%) patients randomized to a treatment arm containing BOC were diagnosed with thrombocytopenia, whereas 7 of 443 (1.6%) patients randomized to a matched placebo arm were diagnosed with thrombocytopenia. These proportions correspond to an OR of 3.36 (95% CrI 0.46–88.7). Note, however, that this OR represents the comparative risk of thrombocytopenia across both naïve and experienced patients receiving either standard-dose duration therapy or response-guided therapy.
Discussion
Our study demonstrates that both new direct-acting agents offer favorable outcomes over standard therapy for the treatment of genotype 1 HCV infection. Clinically important outcomes, including SVR, relapse and discontinuation of treatment due to adverse events appear to be similar between the two direct-acting agents and are clearly superior over the standard therapies examined for both standard-duration therapy and response-guided therapy regimens. Our findings should be of interest to clinicians and patients who are seeking either the most effective options for first-line therapies or exploring options among more experienced patients.
The decision to use one specific HCV peg-INF alpha or direct-acting antiviral over another is based on multiple parameters, including SVR rate, relapse rate, discontinuation rate due to adverse events, side-effect profile, dosing regimen, pill count, resistance risk, likelihood of shortened therapy utilizing a treatment (RGT) approach to therapy, patient characteristics (e.g. physical, behavioral and genetic) and cost. Our analysis suggests that SVR, relapse rate and discontinuation rate due to adverse events can be removed from this decision algorithm in genotype 1-infected populations as these key outcomes of HCV therapy, based on currently available data, are similar between TVR and BOC containing regimens and between the peg-INF alpha-based treatments. Overall, our analyses suggest that the other key medication characteristics listed above should guide the selection of the two currently licensed protease inhibitors. With publication of additional data pertaining to TVR and BOC and the eventual approval of other direct-acting antivirals, the factors that inform medication selection in clinical practice will require reconsideration and updating.
There are several important strengths to consider in our analysis. First, our analysis permits inferences into differences in treatment effects that had not been evaluated directly. This approach is relatively new in the clinical literature and allows for a more powerful exploration of treatment differences than pair-wise meta-analysis permit, which would not have been appropriate for this analysis.13 This method provides stronger inferences than adjusted in direct comparisons.41 We recognize that both direct-acting agents were provided on top of standard treatment. We examined whether the choice of peg-INF alpha affects the treatment outcomes of patients and found that they did not matter in a clinically important manner.
There are also certain limitations to consider in our analysis. We included all published studies evaluating the head-to-head comparisons of interventions in our network. In some circumstances, these were small. For example, the number of trials contributing to the analysis of experienced patients may provide less precise estimates than if we had a larger number of trials.42 For experienced patients, we were unable to determine the outcomes of relapse or discontinuation due to non-reporting in the primary studies. Furthermore, the boceprevir trials conducted among experienced patients did not recruit null responders, but the teleprevir trials did. In this regard, the treatment-experienced populations are dissimilar, and the results may slightly underestimate the efficacy of telaprevir and/or slightly overestimate the efficacy of boceprevir in the prior non-response subgroup of patients. We estimated the additive effects of each direct-acting agent on top of the chosen peg-INF alpha used in each trial and did not demonstrate a statistically significant benefit of peg-INF alpha choice. There is some reason to believe that the choice of peg-INF alpha will differ in terms of treatment outcomes depending on the population studied.43 We performed a variety of regression analyses to determine whether patient status, in terms of gender and percent of trial population cirrhotic, impacted our findings and demonstrated they did not (data available upon request). Given the small number of included studies of each agent, subgroup analyses based on our regressions should be interpreted with caution.44 Finally, while our results indicate that anemia is slightly increased with TVR and moderately increased with BOC, it should be recognized that erythropoietin, used for the management of anemia, was not permitted in the TVR trials. This difference in erythropoietin use could have affected the proportions of patients discontinuing due to anemia.
The statistical approach that we employed is widely accepted by agencies such as the UK National Institutes of Clinical Excellence, the Canadian Drug Safety and Effectiveness Network and the US Agency for Healthcare Research and Quality.13 However, many clinicians may be unfamiliar with this approach and few guides are available to critically appraise such studies. The MTC meta-analysis relies on many of the same assumptions as a standard pair-wise meta-analysis.45 There is a necessary consideration that the trials of each agent are sufficiently similar to pool together in terms of populations, interventions and outcomes. A further necessary consideration is that these similarities exist across the different agents. Finally, there is a necessary consideration that indirect comparisons and direct comparisons yield consistent outcomes, a finding that can be assessed statistically when both direct and indirect evidence are available for the same interventions (in this case, in the peg-INF alpha plus RIB treatments). The largest analysis that has examined the coherence between direct and indirect comparisons of trials, published in 2011, found that there was inconsistency in only 14% of evaluations.46
In summary, both of the new direct-acting protease inhibitors available to treat HCV infections yield superior treatment outcomes when added to the peg-INF and RIB combinations alone and thus provide exciting new opportunities for hepatitis C control. Given their similar efficacy, selection of regimen to treat individuals with hepatitis C infection should include specific considerations such as tolerance and cost.
Funding
This study was initiated and conducted by the academic researchers. We approached Merck & Co. for funding and received funding based on a submitted protocol. Merck & Co. had no involvement in the choice of analysis, interpretation of the results or choice to submit. Dr A.C.E.K. was an employee of Merck, Sharp & Dohme at the time this study was conducted and assisted with content expertise and access to data. He had no role in choices regarding the interpretation or decision to submit this article.
Conflict of interest: None declared.
Acknowledgements
Study planning (C.C., R.L., K.T., E.D., A.C.E.K., S.Y. and E.J.M.); study conduct (C.C., R.L., K.T., E.D., A.C.E.K., S.Y. and E.J.M.); analysis (K.T. and E.D.); study writing (C.C., R.L., K.T., E.D., A.C.E.K., S.Y. and E.M.J.); and agreement of submission of article (C.C., R.L., K.T., E.D., A.C.E.K., S.Y. and E.J.M.).
Appendix 1
Search strategy used in PubMed
(((((((((peginterferon) OR peg-interferon) OR pegylated interferon AND (Humans[Mesh] AND Randomized Controlled Trial[ptyp]))) AND (ribavirin AND (Humans[Mesh] AND Randomized Controlled Trial[ptyp])) AND (Humans[Mesh] AND Randomized Controlled Trial[ptyp]))) AND (hepatitis c AND (Humans[Mesh] AND Randomized Controlled Trial[ptyp])) AND (Humans[Mesh] AND Randomized Controlled Trial[ptyp]))) OR (((telaprevir AND (Humans[Mesh] AND Randomized Controlled Trial[ptyp]))) AND (hepatitis c AND (Humans[Mesh] AND Randomized Controlled Trial[ptyp])) AND (Humans[Mesh] AND Randomized Controlled Trial[ptyp]))) OR (((boceprevir AND (Humans[Mesh] AND Randomized Controlled Trial[ptyp]))) AND (hepatitis c AND (Humans[Mesh] AND Randomized Controlled Trial[ptyp])) AND (Humans[Mesh] AND Randomized Controlled Trial[ptyp]))
Table A1.
Trials excluded after detailed evaluation
| Trial publications | Reason for exclusion |
|---|---|
| Foster et al., 20113,8 | Examined patients with genotypes 2 and 3 |
| Garg et al., 201120 | Examined Phase I trial data |
| Guedj and Perelson, 201121 | Examined Phase I trial data |
| Kumada et al., 201132 | Did not examine a standard-duration therapy nor response-guided therapy regimen of interest |
| Marcellin et al., 20113,5 | Did not examine a control treatment nor common comparator treatment |
| McHutchison et al., 201033 | Did not examine a standard-duration therapy nor response-guided therapy regimen of interest |
| Muir et al., 20113,6 | Did not examine a control treatment nor common comparator treatment |
| Sherman et al., 20113,7 | Did not examine a control treatment nor common comparator treatment |
| Adiwijaya et al., 200922 | Examined Phase I trial data |
| Hezode et al., 20093,4 | Did not examine a standard-duration therapy nor response-guided therapy regimen of interest |
| Susser et al., 20092,3 | Examined Phase I trial data |
| Curry et al., 20082,4 | Examined Phase I trial data |
| Gelderblom et al., 20082,5 | Examined Phase I trial data |
| Lawitz et al., 20082,6 | Examined Phase I trial data |
| Forestier et al., 20072,7 | Examined Phase I trial data |
| Kieffer et al., 20072,8 | Examined Phase I trial data |
| Sarrazin et al., 20072,9 | Examined Phase I trial data |
| Sarrazin et al., 200730 | Examined Phase I trial data |
| Reesink et al., 200631 | Examined Phase I trial data |
Table A2.
ORs and 95% CIs for the direct comparisons
| Comparison in the treatment | SVR, OR (95% CI) | Relapse, OR (95% CI) | Discontinuation due to adverse events, OR (95% CI) |
|---|---|---|---|
| Treatment-naïve patients on standard-duration therapy | |||
| TVR + peg-IFN alpha + RIB vs. peg-IFN alpha-2a + RIB | 2.89 (1.82–4.60) | 0.21 (0.08–0.57) | 1.42 (0.98–2.06) |
| BOC + peg-IFN alpha + RIB vs. peg-IFN alpha-2b + RIB | 3.68 (2.50–5.42) | 0.21 (0.06–0.79) | 1.07 (0.74–1.54) |
| Peg-IFN alpha-2a + RIB vs. peg-IFN alpha-2b + RIB | 1.46 (0.98–2.19) | 1.50 (1.16–1.93) | 0.93 (0.59–1.46) |
| Treatment-experienced patients on standard-duration therapy | |||
| TVR + peg-IFN alpha + RIB vs. peg-IFN alpha + RIB | 9.00 (6.22–13.02) | 0.10 (0.06–0.16) | 2.91 (1.67–5.07) |
| BOC + peg-IFN alpha + RIB vs. peg-IFN alpha + RIB | 7.08 (4.46–11.26) | 0.27 (0.13–0.57) | 5.61 (1.94–16.17) |
| Treatment-naïve patients on response-guided therapy | |||
| TVR + peg-IFN alpha + RIB vs. peg-IFN alpha + RIB | 3.78 (3.03–4.73) | 0.24 (0.17–0.34) | 1.42 (0.98–2.06) |
| BOC + peg-IFN alpha + RIB vs. peg-IFN alpha + RIB | 2.85 (2.30–3.52) | 0.36 (0.25–0.53) | 0.75 (0.56–1.01) |
ORs > 1 indicate higher rates in the first treatment group. CI, confidence interval.
Table A3.
ORs and 95% CIs for the direct comparisons
| Comparison in the treatment | Anemia, OR (95% CI) | Neutropenia, OR (95% CI) | Rash, OR (95% CI) | Pruritus, OR (95% CI) |
|---|---|---|---|---|
| Treatment-naïve patients on standard-duration therapy | ||||
| TVR + peg-IFN alpha + RIB vs. peg-IFN alpha-2a + RIB | 1.13 (0.69–1.86) | 1.00 (0.59–1.69) | 2.20 (1.39–3.47) | 2.32 (1.41–3.82) |
| BOC + peg-IFN alpha + RIB vs. peg-IFN alpha-2b + RIB | 2.31 (1.79–3.07) | 1.93 (0.76–4.91) | 0.99 (0.78–1.26) | 0.93 (0.74–1.18) |
| Peg-IFN alpha-2a + RIB vs. peg-IFN alpha-2b + RIB | 0.98 (0.82–1.17) | 1.32 (1.09–1.59) | 1.37 (1.19–1.58) | 0.93 (0.54–1.60) |
| Treatment-experienced patients on standard-duration therapy | ||||
| TVR + peg-IFN alpha + RIB vs. peg-IFN alpha + RIB | 2.37 (1.61–3.47) | 0.20 (0.13–0.31) | 2.54 (1.78–3.62) | 2.88 (2.09–3.96) |
| BOC + peg-IFN alpha + RIB vs. peg-IFN alpha + RIB | 1.44 (0.27–7.74) | 0.82 (0.51–1.32) | 2.19 (1.09–4.41) | 1.12 (0.69–1.84) |
| Treatment-naïve patients on response-guided therapy | ||||
| TVR + peg-IFN alpha + RIB vs. peg-IFN alpha + RIB | 2.46 (1.94–3.12) | 0.70 (0.53–0.93) | 1.79 (1.43–2.25) | 1.75 (1.42–2.15) |
| BOC + peg-IFN alpha + RIB vs. peg-IFN alpha + RIB | 2.34 (1.89–2.90) | 1.24 (0.97–1.58) | 1.14 (0.90–1.45) | 0.84 (0.66–1.06) |
ORs > 1 indicate higher rates in the first treatment group. CI, confidence interval.
References
- 1.Poordad F, Khungar V. Emerging therapeutic options in hepatitis C virus infection. Am J Manag Care. 2011;17(Suppl. 4):S123–30. [PubMed] [Google Scholar]
- 2.Ciesek S, Manns MP. Hepatitis in 2010: the dawn of a new era in HCV therapy. Nat Rev Gastroenterol Hepatol. 2011;8:69–71. doi: 10.1038/nrgastro.2010.219. [DOI] [PubMed] [Google Scholar]
- 3.Jacobson IM, McHutchison JG, Dusheiko G, Di Bisceglie AM, Reddy KR, Bzowej NH, et al. Telaprevir for previously untreated chronic hepatitis C virus infection. N Engl J Med. 2011;364:2405–16. doi: 10.1056/NEJMoa1012912. [DOI] [PubMed] [Google Scholar]
- 4.McHutchison JG, Everson GT, Gordon SC, Jacobson IM, Sulkowski M, Kauffman R, et al. Telaprevir with peginterferon and ribavirin for chronic HCV genotype 1 infection. N Engl J Med. 2009;360:1827–38. doi: 10.1056/NEJMoa0806104. [DOI] [PubMed] [Google Scholar]
- 5.Kwo PY, Lawitz EJ, McCone J, Schiff ER, Vierling JM, Pound D, et al. Efficacy of boceprevir, an NS3 protease inhibitor, in combination with peginterferon alfa-2b and ribavirin in treatment-naive patients with genotype 1 hepatitis C infection (SPRINT-1): an open-label, randomised, multicentre phase 2 trial. Lancet. 2010;376:705–16. doi: 10.1016/S0140-6736(10)60934-8. [DOI] [PubMed] [Google Scholar]
- 6.Poordad F, McCone J, Bacon B, Bruno S, Manns M, Sulkowski M, et al. Boceprevir for untreated chronic HCV genotype 1 infection. N Engl J Med. 2011;364:1195–206. doi: 10.1056/NEJMoa1010494. [DOI] [PMC free article] [PubMed] [Google Scholar]
- 7.Zeuzem S, Andreone P, Pol S, Lawitz E, Diago M, Roberts S, et al. Telaprevir for retreatment of HCV infection. N Engl J Med. 2011;364:2417–28. doi: 10.1056/NEJMoa1013086. [DOI] [PubMed] [Google Scholar]
- 8.Bacon BR, Gordon SC, Lawitz E, Marcellin P, Vierling JM, Zeuzem S, et al. Boceprevir for previously treated chronic HCV genotype 1 infection. N Engl J Med. 2011;364:1207–17. doi: 10.1056/NEJMoa1009482. [DOI] [PMC free article] [PubMed] [Google Scholar]
- 9.Flamm S, Lawitz E, Jacobson I, Rubin R, Bourliere M, Hezode C, et al. High sustained virological response (SVR) among genotype 1 previous non-responders and relapsers to peginterferon/ribavirin when re-treated with boceprevir (BOC) plus peginterferon alfa-2a/ribavirin. J Hepatol. 2011;54:S535–46. [Google Scholar]
- 10.Cooper NJ, Peters J, Lai MC, Juni P, Wandel S, Palmer S, et al. How valuable are multiple treatment comparison methods in evidence-based health-care evaluation? Value Health. 2011;14:371–80. doi: 10.1016/j.jval.2010.09.001. [DOI] [PubMed] [Google Scholar]
- 11.Lu G, Ades AE. Combination of direct and indirect evidence in mixed treatment comparisons. Stat Med. 2004;23:3105–24. doi: 10.1002/sim.1875. [DOI] [PubMed] [Google Scholar]
- 12.Sutton A, Ades AE, Cooper N, Abrams K. Use of indirect and mixed treatment comparisons for technology assessment. Pharmacoeconomics. 2008;26:753–67. doi: 10.2165/00019053-200826090-00006. [DOI] [PubMed] [Google Scholar]
- 13.Sutton AJ, Higgins JP. Recent developments in meta-analysis. Stat Med. 2008;27:625–50. doi: 10.1002/sim.2934. [DOI] [PubMed] [Google Scholar]
- 14.Ascione A, De Luca M, Tartaglione M, Lampasi F, Di Costanzo G, Lanza A, et al. Peginterferon alfa-2a plus ribavirin is more effective than peginterferon alfa-2b plus ribavirin for treating chronic hepatitis C virus infection. Gastroenterology. 2010;138:116–22. doi: 10.1053/j.gastro.2009.10.005. [DOI] [PubMed] [Google Scholar]
- 15.Rumi MG, Aghemo A, Prati GM, D'Ambrosio R, Donato MF, Soffredini R, et al. Randomized study of peginterferon-alpha 2a plus ribavirin vs peginterferon-alpha 2b plus ribavirin in chronic hepatitis C. Gastroenterology. 2010;138:108–15. doi: 10.1053/j.gastro.2009.08.071. [DOI] [PubMed] [Google Scholar]
- 16.McHutchison JG, Lawitz EJ, Shiffman ML, Muir AJ, Galler GW, McCone J, et al. Peginterferon alfa-2b or alfa-2a with ribavirin for treatment of hepatitis C infection. N Engl J Med. 2009;361:580–93. doi: 10.1056/NEJMoa0808010. [DOI] [PubMed] [Google Scholar]
- 17.Scotto G, Fazio V, Fornabaio C, Tartaglia A, Di Tullio R, Saracino A, et al. Peg-interferon alpha-2a versus peg-interferon alpha-2b in nonresponders with HCV active chronic hepatitis: a pilot study. J Interferon Cytokine Res. 2008;28:623–9. doi: 10.1089/jir.2007.0116. [DOI] [PubMed] [Google Scholar]
- 18.Scotto G, Fazio V, Fornabaio C, Tartaglia A, Di Tullio R, Saracino A, et al. Early and sustained virological response in non-responders with chronic hepatitis C—a randomized open-label study of pegylated interferon-alpha-2a versus pegylated interferon-alpha-2b. Drugs. 2008;68:791–801. doi: 10.2165/00003495-200868060-00005. [DOI] [PubMed] [Google Scholar]
- 19.Yenice N, Mehtap O, Gumrah M, Arican N. The efficacy of pegylated interferon alpha 2a or 2b plus ribavirin in chronic hepatitis C patients. Turk J Gastroenterol. 2006;17:94–8. [PubMed] [Google Scholar]
- 20.Garg V, van Heeswijk R, Lee J, Alves K, Nadkarni P, Luo X. Effect of telaprevir on the pharmacokinetics of cyclosporine and tacrolimus. Hepatology. 2011;54:20–7. doi: 10.1002/hep.24443. [DOI] [PubMed] [Google Scholar]
- 21.Guedj J, Perelson A. Second-phase hepatitis C virus RNA decline during telaprevir-based therapy increases with drug effectiveness: implications for treatment duration. Hepatology. 2011;53:1801–8. doi: 10.1002/hep.24272. [DOI] [PMC free article] [PubMed] [Google Scholar]
- 22.Adiwijaya B, Hare B, Caron P, Randle J, Neumann A, Reesink H, et al. Rapid decrease of wild-type hepatitis C virus on telaprevir treatment. Antivir Ther. 2009;14:591–5. [PubMed] [Google Scholar]
- 23.Susser S, Welsch C, Wang Y, Zettler M, Domingues F, Karey U, et al. Characterization of resistance to the protease inhibitor boceprevir in hepatitis C virus-infected patients. Hepatology. 2009;50:1709–18. doi: 10.1002/hep.23192. [DOI] [PubMed] [Google Scholar]
- 24.Curry S, Qiu P, Tong X. Analysis of HCV resistance mutations during combination therapy with protease inhibitor boceprevir and PEG-IFN alpha-2b using TaqMan mismatch amplification mutation assay. J Virol Methods. 2008;153:156–62. doi: 10.1016/j.jviromet.2008.07.020. [DOI] [PubMed] [Google Scholar]
- 25.Gelderblom H, Zeuzem S, Weegink C, Forestier N, Mcnair L, Purdy S, et al. Inflammatory markers neopterin and alanine aminotransferase in HCV patients treated with HCV NS3.4A protease inhibitor telaprevir (VX-950) and/or peginterferon alfa-2a. Scand J Gastroenterol. 2008;43:1122–7. doi: 10.1080/00365520802044210. [DOI] [PubMed] [Google Scholar]
- 26.Lawitz E, Rodriguez-Torres M, Muir A, Kieffer T, McNair L, Khunvichai A, et al. Antiviral effects and safety of telaprevir, peginterferon alfa-2a, and ribavirin for 28 days in hepatitis C patients. J Hepatol. 2008;49:163–9. doi: 10.1016/j.jhep.2008.03.027. [DOI] [PubMed] [Google Scholar]
- 27.Forestier N, Reesink H, Weegink C, McNair L, Kieffer T, Chu H, et al. Antiviral activity of telaprevir (VX-950) and peginterferon alfa-2a in patients with hepatitis C. Hepatology. 2007;46:640–8. doi: 10.1002/hep.21774. [DOI] [PubMed] [Google Scholar]
- 28.Kieffer T, Sarrazin C, Miller J, Welker M, Forestier N, Reesink H, et al. Telaprevir and pegylated interferon-alpha-2a inhibit wild-type and resistant genotype 1 hepatitis C virus replication in patients. Hepatology. 2007;46:631–9. doi: 10.1002/hep.21781. [DOI] [PubMed] [Google Scholar]
- 29.Sarrazin C, Kieffer T, Bartels D, Hanzelka B, Müh U, Welker M, et al. Dynamic hepatitis C virus genotypic and phenotypic changes in patients treated with the protease inhibitor telaprevir. Gastroenterology. 2007;132:1767–77. doi: 10.1053/j.gastro.2007.02.037. [DOI] [PubMed] [Google Scholar]
- 30.Sarrazin C, Rouzier R, Wagner F, Forestier N, Larrey D, Gupta S, et al. SCH 503034, a novel hepatitis C virus protease inhibitor, plus pegylated interferon alpha-2b for genotype 1 nonresponders. Gastroenterology. 2007;132:1270–8. doi: 10.1053/j.gastro.2007.01.041. [DOI] [PubMed] [Google Scholar]
- 31.Reesink H, Zeuzem S, Weegink C, Forestier N, van Vliet A, van de Wetering de Rooij J, et al. Rapid decline of viral RNA in hepatitis C patients treated with VX-950: a phase Ib, placebo-controlled, randomized study. Gastroenterology. 2006;131:997–1002. doi: 10.1053/j.gastro.2006.07.013. [DOI] [PubMed] [Google Scholar]
- 32.Kumada H, Toyota J, Okanoue T, Chayama K, Tsubouchi H, Hayashi N. Telaprevir with peginterferon and ribavirin for treatment-naive patients chronically infected with HCV of genotype 1 in Japan. J Hepatol. 2012;56:78–84. doi: 10.1016/j.jhep.2011.07.016. [DOI] [PubMed] [Google Scholar]
- 33.McHutchison JG, Manns MP, Muir AJ, Terrault NA, Jacobson IM, Afdhal NH, et al. Telaprevir for previously treated chronic HCV infection. N Engl J Med. 2010;362:1292–303. doi: 10.1056/NEJMoa0908014. [DOI] [PubMed] [Google Scholar]
- 34.Hezode C, Forestier N, Dusheiko G, Ferenci P, Pol S, Goeser T, et al. Telaprevir and peginterferon with or without ribavirin for chronic HCV infection. N Engl J Med. 2009;360:1839–50. doi: 10.1056/NEJMoa0807650. [DOI] [PubMed] [Google Scholar]
- 35.Marcellin P, Forns X, Goeser T, Ferenci P, Nevens F, Carosi G, et al. Telaprevir is effective given every 8 or 12 hours with ribavirin and peginterferon alfa-2a or-2b to patients with chronic hepatitis C. Gastroenterology. 2011;140:459–68. doi: 10.1053/j.gastro.2010.10.046. [DOI] [PubMed] [Google Scholar]
- 36.Muir A, Poordad F, McHutchison J, Shiffman M, Berg T, Ferenci P, et al. Retreatment with telaprevir combination therapy in hepatitis C patients with well-characterized prior treatment response. Hepatology. 2011;54:1538–46. doi: 10.1002/hep.24549. [DOI] [PubMed] [Google Scholar]
- 37.Sherman K, Flamm S, Afdhal N, Nelson D, Sulkowski M, Everson G, et al. Response-guided telaprevir combination treatment for hepatitis C virus infection. N Engl J Med. 2011;365:1014–24. doi: 10.1056/NEJMoa1014463. [DOI] [PMC free article] [PubMed] [Google Scholar]
- 38.Foster G, Hézode C, Bronowicki J, Carosi G, Weiland O, Verlinden L, et al. Telaprevir alone or with peginterferon and ribavirin reduces HCV RNA in patients with chronic genotype 2 but not genotype 3 infections. Gastroenterology. 2011;141:881–9. doi: 10.1053/j.gastro.2011.05.046. [DOI] [PubMed] [Google Scholar]
- 39.Antiviral Drugs Advisory Committee, US Food and Drug Administration. Telaprevir, FDA Advisory Committee Briefing Document, April 2011. http://www.fda.gov/downloads/AdvisoryCommittees/CommitteesMeetingMaterials/Drugs/AntiviralDrugsAdvisoryCommittee/UCM252562.pdf (1 August 2012, date last accessed) [Google Scholar]
- 40.Division of Antiviral Products (DAVP), US Food and Drug Administration. Boceprevir, FDA Advisory Committee Briefing Document, April 2011. http://www.fda.gov/downloads/AdvisoryCommittees/CommitteesMeetingMaterials/drugs/AntiviralDrugsAdvisoryCommittee/ucm252341.pdf (1 August 2012, date last accessed) [Google Scholar]
- 41.Cooper CL, Druyts E, Thorlund K, Nachega JB, El Khoury AC, O'Regan C, et al. Boceprevir and telaprevir for the treatment of chronic hepatitis C genotype 1 infection: an indirect comparison meta-analysis. Ther Clin Risk Manag. 2012;8:105–30. doi: 10.2147/TCRM.S29830. [DOI] [PMC free article] [PubMed] [Google Scholar]
- 42.Mills EJ, Ghement I, O'Regan C, Thorlund K. Estimating the power of indirect comparisons: a simulation study. PLOS One. 2011;6:e16237. doi: 10.1371/journal.pone.0016237. [DOI] [PMC free article] [PubMed] [Google Scholar]
- 43.Druyts E, Mills EJ, Nachega J, O'Regan C, Cooper CL. Differences in clinical outcomes among hepatitis C genotype 1-infected patients treated with peginterferon alpha-2a or peginterferon alpha-2b plus ribavirin: a meta-analysis. Clin Exp Gastroenterol. 2012;5:11–21. doi: 10.2147/CEG.S28253. [DOI] [PMC free article] [PubMed] [Google Scholar]
- 44.Sun X, Briel M, Walter SD, Guyatt GH. Is a subgroup effect believable? Updating criteria to evaluate the credibility of subgroup analyses. BMJ. 2010;340:c117. doi: 10.1136/bmj.c117. [DOI] [PubMed] [Google Scholar]
- 45.Mills E, Bansback N, Ghement I, Thorlund K, Kelly S, Puhan M, et al. Multiple treatment comparison meta-analyses: a step forward into complexity. Clin Epidemiol. 2011;3:193–202. doi: 10.2147/CLEP.S16526. [DOI] [PMC free article] [PubMed] [Google Scholar]
- 46.Song F, Xiong T, Parekh-Bhurke S, Loke YK, Sutton AJ, Eastwood AJ, et al. Inconsistency between direct and indirect comparisons of competing interventions: meta-epidemiological study. BMJ. 2011;343:d4909. doi: 10.1136/bmj.d4909. [DOI] [PMC free article] [PubMed] [Google Scholar]