Abstract
Mint leaves were dried by three different types of dryers, namely; tray, freeze and distributed (indirect)-type solar dryer. Sorption isotherms of fresh, solar, tray and freeze dried mint were determined at temperatures of 15 °C, 25 °C and 35 °C over a range of relative humidities (10–90%). The effect of drying method on the water sorption isotherms of dried mint samples was evaluated. Experimental data were used to determine the best models for predicting the moisture sorption content of mint. Among nine sorption models tested, Peleg, GAB, Lewicki and modified Mizrahi equations gave the best fit to experimental data. The sorption data were analyzed for determination of monolayer moisture content, density of sorbed water, number of adsorbed monolayers, percent bound water, and surface area of adsorbance. The experimental data were also used to determine some thermodynamic properties of mint.
Keywords: Mint, Sorption isotherm, Thermodynamic properties
Introduction
Drying has a long time tradition as a conservation method and use of dried medicinal and aromatic plants in traditional medicine has been well-known. The pharmacology and food industry handle these crops as raw materials to produce drugs, spices and essential oils. Mint has been used both as a medicinal and aromatic plant since ancient times. Its leaves are used for flavoring, tea infusions and spicing. In order to preserve this seasonal plant, and make it to available to consumers during the whole year, it undergoes specific technological treatments, such as drying. Several methods have been used in drying process. Final product characteristics such as water sorption, porosity, color, and texture depend on drying methods used (Ekechukwu 1999). Tray drying is frequently used in food industry and tray dried foods usually have some undesirable effects due to use of high temperature and long time. Freeze drying provides better porous structure but operational costs are higher. In order to minimize drying cost and to improve the nutritional value, drying methods have to be optimized. One way is to introduce a solar drying system (Ekechukwu and Norton 1999). It is particularly important for countries which have more sun throughout the year. Most suitable drying methods and their operating conditions have to be determined to control the product quality.
The moisture sorption isotherm is an extremely valuable tool for food scientists and technologists because it can be used to predict potential changes in food stability; determination of storing method, and packaging selection (Basu et al. 2006).
There are many works on moisture sorption isotherms of foods. Some of these works are related to the determination of moisture sorption isotherms and their temperature dependence some are related to the mathematical expressions to represent the moisture sorption isotherms. Many empirical and semi empirical models have been proposed to describe the sorption characteristics of foods. The mostly applied models are GAB, Halsey, BET, Oswin, Henderson, Peleg, Caurie, and Lewicki (Ayranci and Duman 2005; Rao et al. 2006; Chirife and Iglesias 1978; Lomauro et al. 1985a, b; Peleg 1993).
Information on moisture sorption isotherms of various herbs and aromatical/medicinal plants including peppermint, daphne, marjoram, muscat, cardamom, chamomile, cloves, coriander, thyme, cinnamon, ginger fennel and anise (Soysal and Öztekin 2001), saffron (Tsimidou and Biliaderis 1997), mint, sage, and verbena (Kouhila et al. 2001), rosemary (Timoumi and Zagrouba 2005), green tea powder (Sinija and Mishra 2008), chitosan (Rosa et al. 2010) are available. Henderson equation was found to be an adequate model for mint (Kouhila et al. 2001). The influence of temperature and velocity of tray drying on the sorption isotherms of garden mint was studied, and BET, Oswin and Peleg models were found to be the best models to describe the mint desorption isotherms (Park et al. 2002). Effect of drying method on the moisture sorption isotherms for mushroom was studied and the maximum monolayer moisture content has been found for freeze-dried samples (Lee and Lee 2008).
In recent years, there have been many contributions in the field of thermodynamics to understand the properties of water in relation to a biological system. The thermodynamic functions can be easily calculated from moisture sorption isotherms (Rizvi and Benado 1984). Thermodynamic functions include free energy, heat of vaporization, integral enthalpy and entropy. Thermodynamic functions are important for understanding the properties of water and calculating the energy requirements of heat and mass transfer in biological systems (Iglesias et al. 1976). Park et al. 2002 were studied drying parameters and sorption isotherms of garden mint leaves. Tray drying of mint leaves at different temperatures and air velocities were only studied in this work.
The objectives of this study were to determine the moisture sorption isotherms of fresh, solar, tray and freeze dried mint at three temperatures, 15, 25, and 35 °C, and to find the most suitable model describing the isotherms of mint leaves. The second part of this study deals with determination the monolayer moisture content and some thermodynamic functions (heat of sorption and entropy of sorption) of mint leaves.
Materials and methods
Materials
Fresh garden mint bunches were supplied from local greengrocers (Gaziantep, TURKEY). The leaves of mint bunches were separated from the stalk and cleaned. Nine saturated salt solutions (NaOH, CH3COOK, MgCl2, K2CO3, Mg(NO3)2, KI, NaCl, KCl and KNO3) in different closed containers were prepared to obtain constant relative humidity environments. All salt solutions were reagent grade.
Drying procedures
The leaves of fresh garden mint bunches were dried by passing heated air over the drying trays. A tray dryer (Armfield UOP 8-Tray dryer, ENGLAND) was used. Mint leaves were placed into the trays and drying was started. The weight of the sample was measured periodically. It was continued until the constant weight of the sample obtained. Operating conditions of driers are given in Table 1.
Table 1.
Experimantal conditions for dried mint process
| Drying method | Initial moisture content,% (wb) | Drying temperature, °C | Air velocity, m/s | Drying time to reach EMCa, min |
|---|---|---|---|---|
| Tray drying | 87.20 | 65 | 1.00 | 75 |
| Freeze drying | 87.20 | −50 | – | 300 |
| Solar drying | 87.20 | 65 | 1.00 | 75 |
aEMC Equilibrium Moisture Content
The leaves of fresh garden mint were also dried by a freeze-dryer (Eyela Model FD-1, JAPAN). The leaves were placed into the sample flask and frozen by the anti-freeze liquid (ethanol) bath at −50 °C. Frozen sample was attached to the drying chamber and dried under vacuum.
A typical distributed (indirect) type solar dryer (Designed and built at University of Gaziantep) was used to dry mint leaves. It consists of four basic components; a fan, an air-heating solar-energy collector, a drying chamber and appropriately insulated ducting. The system was active solar drying system because of the use of motorized fan for forced air circulation. Drying air was heated through solar-energy collector. The sample placed into the removable tray was dried by hot and dry air. The weight of the sample was measured periodically and drying was stopped when the weight of the sample was being unchanged.
Determination of moisture sorption isotherms
A gravimetric method was used in this work. The method was based on the use of saturated salt solutions to maintain a fixed relative humidity (RH). Nine salts were chosen so as to have a range of relative humidities of 10–90%.
Nine saturated salt solutions were used to provide water activities ranging from 0.06 to 0.98. The salts used were NaOH, KAc,MgCl2, K2CO3,MgNO3,KI, KCl,KNO3, and NaCl. Saturated solutions of them were prepared at each temperature studied. They were placed into separate jars in an amount to occupy a space of about 1 cm deep at the bottom. A small amount of solid salt was also added to make sure that solutions remain saturated. A tripod was also placed in each jar. Duplicate samples of 1 g of the solar-, tray-, freeze-dried mint leaves, and fresh mint leaves were weighed into small crucibles of aluminum foil and placed on tripods in the jars, which were then tightly closed.
The samples were kept in ovens at 15, 25 and 35 ± 1 °C for equilibration. This required about 4 weeks. Moisture content of the mint leaves was determined using the oven method at 105 °C after the final equilibrium moisture content was reached (AOAC 1990). The equilibrium moisture content of the samples was given as g/100 g dry solids.
Analysis of sorption data
Isotherm models
A large number of models have been proposed in the literature for the sorption isotherms (Basu et al. 2006; Ayranci and Duman 2005). In this study, Peleg, GAB, Lewicki, BET, Halsey, Oswin, Henderson, Modified Mizrahi, and Caurie equations were applied to determine the best fit for the experimental data. The mathematical expressions of the nine models are presented in Table 2. The parameters of equations (Halsey, Oswin, BET, Henderson, Caurie and Lewicki) were obtained by linear regression analysis while those of equations (GAB, Peleg and Modified Mizrahi) were obtained by non-linear regression analysis using the SigmaPlot 2000 (SPSS Inc., Chicago, IL, USA).
Table 2.
Mathematical models for the sorption isotherm curves
| Model | Expression | Number of constants |
|---|---|---|
| GAB |  |
3 |
| Halsey |  |
2 |
| Peleg |  |
4 |
| Oswin |  |
2 |
| BET |  |
2 |
| Henderson |  |
2 |
| Lewicki |  |
3 |
| Modified Mizrahi |  |
3 |
| Caurie |  |
2 |
The nonlinear regression analysis was carried with the Marquardt-Levenberg algorithm; this is a search method to minimize the sum of squares of the differences between the predicted and experimental data. In order to compare the precision of fit of the sorption models, mean relative percent deviation modulus (P) and coefficient of determination (R2) were used.
 |
1 |
where Mobs, Mpred, and n are observed moisture content at any water activity, predicted moisture content according to the equation under study with best fitted parameters, and number of observations, respectively.
The BET equation was applied to sorption data below aw of 0.5 as it was reported to be successful only in this range (Labuza 1984). The statistical parameters of BET equation were therefore not determined as the applicability of this equation is limited below aw of 0.5.
Monolayer moisture content
The monolayer moisture content M0, can be determined from the equilibrium sorption isotherm data by fitting BET, GAB and Caurie expressions. The prediction of M0 has a significant importance for physical and chemical stability of foods. Below M0 values, food deterioration is expected to be extremely small, because water is strongly bound to the food and water is not involved in any deteriorative reaction. Treatment of sorption data to Caurie equation allows the evaluation of the number of binding sites, the influence of temperature on monolayer, density of sorbed water, surface area of absorbent and per cent non-freezable or bound water. The number of adsorbed monolayers (N) (Rao et al. 2006) was calculated using;
 |
2 |
where M0 is the monolayer moisture content from Caurie’s equation and Cc is Caurie’s constant. Assuming that the magnitude of Cc equals the density of adsorbed water in the monolayer, the surface area of adsorbent (A) was calculated as
 |
3 |
where d is the diameter of water molecule (d = 3.673*10−10 m).
Isosteric heat of sorption
The isosteric heat of sorption Qst, is the energy per unit mass required to remove water from a material and incorporates the binding energy between water molecules and the food dry matter. The heat of sorption was obtained from the slopes of lnaw vs. 1/T plots by linear regression analysis using the Clausius-Clapeyron equation (Labuza 1984).
 |
4 |
where aw1 and aw2 are the water activities at temperatures T1 and T2 respectively and R is the gas constant (8.314 J mol−1 K−1). qst is the net heat of sorption, which is equal to the difference between the isosteric heat of sorption, Qst and the enthalpy of vaporization of water, ΔHvap (H2O). Qst is logically related to the amount of energy required in a dehydration process.
 |
5 |
Qst is logically related to the amount of energy required in a dehydration process.
Enthalpy entropy compensation theory
The relationship between the isosteric heat (Qst) and the differential entropy (ΔSd) of sorption is given by
 |
6 |
by plotting ln(aw) versus 1/T, for a given moisture content (m), Qst was determined from the slope (−Qst/R), and ΔSd from intercept (ΔSd/R) (McMinn and Magee 2003). The dependence of Qst and ΔSd with moisture at different moisture content is therefore, determined.
The compensation theory proposes a linear relationship between Qst and ΔSd (McMinn and Magee 2003):
 |
7 |
The isokinetic temperature (Tβ) and constant (α) were calculated using linear regression.
The isokinetic temperature has an important physical meaning as it represents the temperature at which all reactions in a given series have the same reactivity. Since there is a high degree of linear correlation between enthalpy and entropy, the compensation theory was assumed to be valid for sorption. It was recommended a test for the compensation theory (Telis et al. 2000), which involves comparing the isokinetic temperature with the harmonic mean temperature Thm that is defined as:
 |
8 |
where ns is number of isotherms. If Tβ > Thm the process is enthalpy driven, while if the opposite condition is observed (Tβ < Thm), the process is considered to be entropy-controlled (Lefler 1955; Telis et al. 2000; McMinn et al. 2005).
Results and discussion
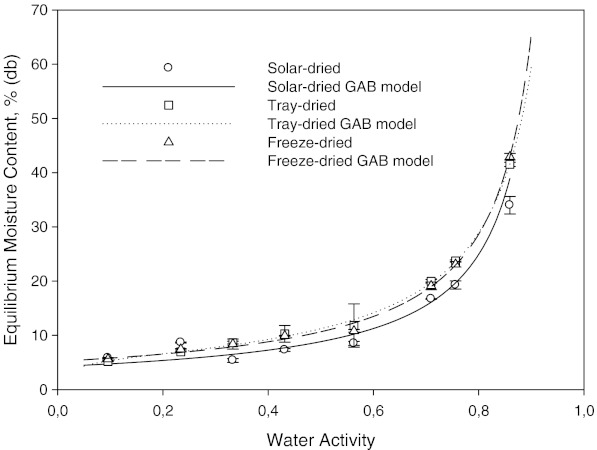
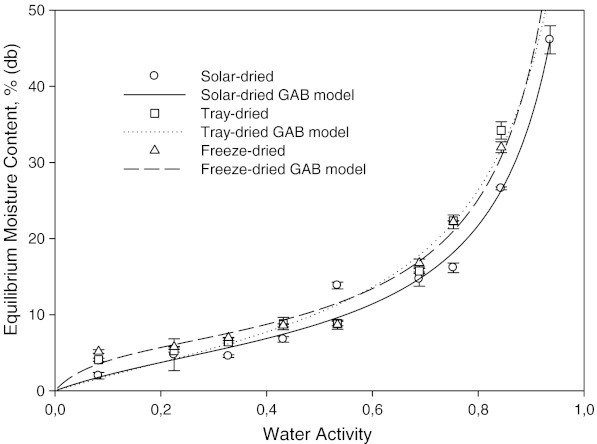
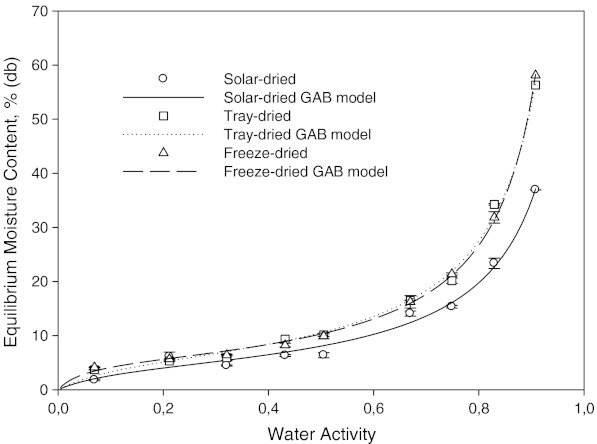
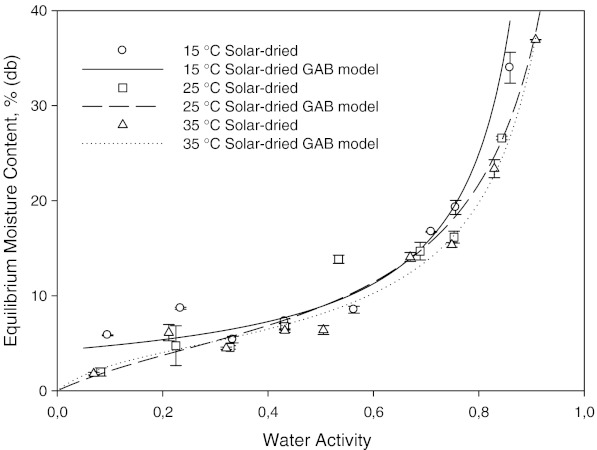
Initial moisture content (IMC) of fresh mint leaves was found to be 4,672 ± 0,031 g/g dry matter. Experimental equilibrium moisture content (EMC) values of fresh and dried mint leaves are presented in Table 3. The moisture sorption isotherms for solar, tray and freeze dried mint are shown in Figs. 1, 2 and 3 respectively. Each point of the curves represents the mean value of two replications. The sorption isotherms obtained were generally showed characteristics of BET III type isotherm. This type isotherm is common for many foods having rich soluble components (Labuza 1984). This is probably due to the higher carbohydrate content. Mint has approximately 70% (db) of carbohydrates (Whfoods 2006).
Table 3.
Experimental EMC values (% dry basis) of fresh and dried mint at selected temperatures
| Temperature (°C) | aw | Desorption | Adsorption | ||
|---|---|---|---|---|---|
| Fresh mint | Solar-dried | Tray-dried | Freze-dried | ||
| 15 | 0.096 | 6.944 ± 0.007 | 5.839 ± 0.038 | 5.187 ± 0.035 | 5.619 ± 0.125 |
| 0.234 | 9.134 ± 0.130 | 8.676 ± 0.069 | 6.962 ± 0.010 | 7.432 ± 0.092 | |
| 0.333 | 10.136 ± 0.136 | 5.377 ± 0.247 | 8.665 ± 0.181 | 8.411 ± 0.659 | |
| 0.432 | 12.219 ± 0.127 | 7.305 ± 0.184 | 10.279 ± 1.088 | 9.920 ± 0.045 | |
| 0.563 | 12.418 ± 0.141 | 8.526 ± 0.260 | 11.819 ± 2.829 | 10.825 ± 0.169 | |
| 0.710 | 20.916 ± 0.320 | 16.726 ± 0.042 | 19.957 ± 0.249 | 19.132 ± 0.496 | |
| 0.756 | 22.613 ± 0.380 | 19.292 ± 0.527 | 23.715 ± 0.145 | 23.103 ± 0.354 | |
| 0.859 | 43.217 ± 1.175 | 38.991 ± 6.151 | 41.532 ± 0.273 | 42.951 ± 0.427 | |
| 25 | 0.082 | 2.824 ± 0.522 | 1.971 ± 0.304 | 4.080 ± 0.142 | 5.169 ± 0.163 |
| 0.225 | 7.478 ± 0.147 | 4.739 ± 1.480 | 5.270 ± 0.133 | 5.784 ± 0.024 | |
| 0.328 | 9.622 ± 0.059 | 4.558 ± 0.127 | 6.426 ± 0.111 | 6.976 ± 0.019 | |
| 0.432 | 10.865 ± 0.421 | 6.746 ± 0.253 | 8.830 ± 0.574 | 8.602 ± 0.144 | |
| 0.689 | 15.216 ± 2.107 | 14.685 ± 0.659 | 15.738 ± 0.239 | 16.796 ± 0.368 | |
| 0.534 | 12.280 ± 1.014 | 13.836 ± 0.306 | 8.840 ± 0.200 | 8.698 ± 0.426 | |
| 0.753 | 21.340 ± 3.975 | 16.162 ± 0.443 | 22.332 ± 0.017 | 22.201 ± 0.642 | |
| 0.843 | 30.275 ± 0.146 | 26.596 ± 0.134 | 34.221 ± 0.809 | 32.004 ± 0.502 | |
| 0.936 | 52.064 ± 1.413 | 46.114 ± 1.308 | 52.343 ± 1.513 | 56.937 ± 0.952 | |
| 35 | 0.069 | 5.014 ± 0.346 | 1.802 ± 0.097 | 3.698 ± 0.032 | 4.158 ± 0.063 |
| 0.212 | 6.232 ± 0.204 | 6.109 ± 0.606 | 5.327 ± 0.029 | 5.676 ± 0.032 | |
| 0.321 | 8.929 ± 0.284 | 4.474 ± 0.087 | 5.941 ± 0.373 | 6.416 ± 0.124 | |
| 0.432 | 10.421 ± 0.064 | 6.325 ± 0.138 | 9.347 ± 0.089 | 8.257 ± 0.240 | |
| 0.505 | 10.815 ± 0.074 | 6.393 ± 0.333 | 10.154 ± 0.199 | 9.928 ± 0.370 | |
| 0.670 | 15.342 ± 3.604 | 14.077 ± 0.331 | 16.522 ± 0.026 | 16.244 ± 0.811 | |
| 0.749 | 19.365 ± 0.100 | 15.348 ± 0.176 | 20.169 ± 0.351 | 21.391 ± 0.146 | |
| 0.830 | 22.952 ± 0.918 | 23.364 ± 0.672 | 34.259 ± 0.101 | 31.852 ± 0.752 | |
| 0.908 | 36.250 ± 1.125 | 36.939 ± 0.013 | 56.261 ± 0.132 | 58.122 ± 0.100 | |
Fig. 1.
Moisture sorption isotherm of solar, tray, and freeze dried mint at 15 °C
Fig. 2.
Moisture sorption isotherm of solar, tray, and freeze dried mint at 25 °C
Fig. 3.
Moisture sorption isotherm of solar, tray, and freeze dried mint at 35 °C
At low water activities, water can be absorbed only at the surface sites. As the water activity increases the dissolution of soluble components (mostly carbohydrates) bring about increasing the moisture content. In general, at water activities higher than 0.80, there is a sharp increase in moisture content.
Fitting of sorption equations to experimental data
The sorption data were fitted to nine well-known sorption isotherm equations. These equations and number of constants are presented in Table 2. Non-linear regression analysis was used for evaluating the best-fitted values of constants. The isotherm models, equation constants, R2 and ‘P’ values are summarized in Table 4. The higher R2 and the lower ‘P’ values represent the goodness of fit. Generally, Peleg, GAB, Lewicki and Modified Mizrahi equations have the lowest ‘P’ and hihger R2 values. The best fit was obtained by the model of Peleg for fresh mint, tray and freeze dried mint at 15 °C and for tray dried mint at 25 °C; by the models of GAB for fresh mint, at 35 °C, and for tray dried mint at 15 °C and for freeze dried mint both at 15 °C and 35 °C; by the model of Lewicki for fresh mint at 35 °C and for freeze dried mint both at 15 °C and 35 °C; by the model of Halsey for fresh mint, at 35 °C and finally by the model of Modified Mizrahi for fresh mint at 35 °C and for tray dried mint at 15 °C and for freeze dried mint at 35 °C.
Table 4.
Parameters of sorption isotherm equations, R2 (coefficient of determination), and mean relative deviation modulus (P) for isotherms of fresh and dried mint at 15, 25, and 35 °C
| Equation | Fresh mint | Solar dried | Tray dried | Freeze dried | |||||||||
|---|---|---|---|---|---|---|---|---|---|---|---|---|---|
| 15 °C | 25 °C | 35 °C | 15 °C | 25 °C | 35 °C | 15 °C | 25 °C | 35 °C | 15 °C | 25 °C | 35 °C | ||
| Peleg | n1 | 8.2772 | 6.0264 | 7.1082 | 6.9201 | 12.1467 | 6.5761 | 6.9117 | 5.3027 | 7.9907 | 7.2857 | 6.3111 | 8.7836 |
| n2 | 0.3383 | −0.0455 | 0.5353 | 0.0561 | 1.2507 | 0.5383 | 0.4284 | 0.3139 | 0.6321 | 0.3247 | 0.3127 | 0.6281 | |
| K1 | 100.9339 | 61.3048 | 40.2993 | 90.4382 | 56.2305 | 51.1580 | 81.7882 | 62.3201 | 91.5972 | 95.0581 | 70.6742 | 101.5043 | |
| K2 | 15.1294 | 9.2093 | 16.2918 | 7.3000 | 22.9642 | 10.0267 | 13.7206 | 8.9164 | 14.9023 | 12.0528 | 10.1549 | 15.2066 | |
| R2 | 0.9948 | 0.9928 | 0.9892 | 0.9904 | 0.9880 | 0.9878 | 0.9991 | 0.9984 | 0.9973 | 0.9990 | 0.9968 | 0.9968 | |
| P | 3.9664 | 7.8311 | 7.4588 | 9.4428 | 15.8264 | 14.5081 | 2.7059 | 4.2138 | 8.2378 | 2.1564 | 6.4516 | 8.5978 | |
| GAB | Mo | 6.0079 | 6.3006 | 6.2833 | 4.2587 | 5.8295 | 4.6302 | 5.7006 | 7.9363 | 5.9391 | 5.2111 | 6.0282 | 5.4212 |
| C1 | 3.19E + 07 | 7.18E + 07 | 3.89E + 01 | 3.07E + 07 | 4.67E + 00 | 9.73E + 00 | 4.88E + 01 | 2.78E + 00 | 9.15E + 00 | 1.47E + 07 | 1.36E + 01 | 1.96E + 01 | |
| K | 1.0000 | 0.9354 | 0.9092 | 0.9909 | 0.9372 | 0.9660 | 1.0000 | 0.9174 | 0.9875 | 0.9998 | 0.9571 | 0.9995 | |
| R2 | 0.9879 | 0.9825 | 0.9929 | 0.9828 | 0.9846 | 0.9881 | 0.9983 | 0.9884 | 0.9954 | 0.9971 | 0.9936 | 0.9991 | |
| P | 8.1310 | 8.1840 | 5.0338 | 13.3802 | 12.7752 | 13.8124 | 2.9023 | 15.5526 | 8.2735 | 4.6631 | 10.8089 | 5.3774 | |
| Lewicki | F | 6.6533 | 11.0946 | 13.5310 | 4.5731 | 11.7202 | 7.5327 | 7.8691 | 14.2084 | 8.2035 | 5.3833 | 10.7504 | 7.2316 |
| G | 0.9789 | 0.5946 | 0.4835 | 1.1130 | 0.5438 | 0.7110 | 0.8924 | 0.5297 | 0.8408 | 1.0847 | 0.6446 | 0.8992 | |
| H | −2.5443 | −0.4926 | 0.2939 | −1.5721 | 1.0475 | 0.4051 | −0.2405 | 1.0337 | 0.2161 | −2.3800 | 0.3348 | −0.0173 | |
| R2 | 0.9920 | 0.9879 | 0.9949 | 0.9838 | 0.9857 | 0.9878 | 0.9974 | 0.9817 | 0.9961 | 0.9976 | 0.9924 | 0.9999 | |
| P | 6.4611 | 9.3033 | 4.6466 | 12.5781 | 14.4761 | 15.1675 | 5.0866 | 16.3609 | 5.2492 | 4.5745 | 10.5012 | 1.5863 | |
| BETa | Mo | 7.0551 | 6.6971 | 5.7116 | 4.6845 | 4.6712 | 3.6401 | 6.0867 | 4.9481 | 5.2225 | 5.7843 | 4.7631 | 4.8527 |
| Halsey | A | 18.0137 | 49.4374 | 44.1144 | 6.7913 | 16.9874 | 9.9744 | 12.5117 | 24.1004 | 10.3272 | 10.1660 | 19.7446 | 9.1614 |
| B | 1.2840 | 1.6860 | 1.7052 | 1.0465 | 1.4405 | 1.2802 | 1.1893 | 1.4752 | 1.1566 | 1.1260 | 1.4034 | 1.1216 | |
| R2 | 0.9690 | 0.9729 | 0.9944 | 0.9583 | 0.9772 | 0.9870 | 0.9933 | 0.9743 | 0.9960 | 0.9843 | 0.9911 | 0.9990 | |
| P | 14.4991 | 10.6822 | 4.6352 | 18.7158 | 30.1324 | 18.3399 | 8.8426 | 16.0855 | 6.1995 | 14.1668 | 10.8312 | 5.4740 | |
| Oswin | A | 12.9762 | 12.4979 | 11.7438 | 8.7224 | 9.1816 | 8.0056 | 11.5961 | 10.9804 | 10.0969 | 10.9452 | 10.6638 | 9.6749 |
| B | 0.6251 | 0.5151 | 0.4822 | 0.8023 | 0.6044 | 0.6669 | 0.6846 | 0.5932 | 0.7491 | 0.7309 | 0.6273 | 0.7765 | |
| R2 | 0.9379 | 0.9501 | 0.9908 | 0.9306 | 0.9849 | 0.9859 | 0.9772 | 0.9819 | 0.9924 | 0.9624 | 0.9912 | 0.9926 | |
| P | 21.0540 | 14.9029 | 7.2517 | 24.6150 | 14.7886 | 14.0552 | 16.8860 | 13.3034 | 14.1929 | 22.0334 | 13.6265 | 15.9941 | |
| Henderson | d | 0.0570 | 0.0668 | 0.0368 | 0.1700 | 0.1245 | 0.1460 | 0.0856 | 0.1089 | 0.1615 | 0.1093 | 0.1297 | 0.1800 |
| e | 0.9702 | 0.9608 | 1.1865 | 0.6799 | 0.8138 | 0.7819 | 0.8573 | 0.8153 | 0.6733 | 0.7839 | 0.7591 | 0.6427 | |
| R2 | 0.8791 | 0.8971 | 0.9611 | 0.8861 | 0.9757 | 0.9693 | 0.9404 | 0.9831 | 0.9746 | 0.9195 | 0.9789 | 0.9706 | |
| P | 29.0169 | 25.9026 | 16.3683 | 34.6530 | 19.3741 | 25.0165 | 26.8017 | 23.8013 | 30.2048 | 31.9018 | 26.5288 | 32.1741 | |
| Modified Mizrahi | a | −7.8188 | −7.1443 | −3.4970 | −7.0660 | 0.5021 | −1.4282 | −4.9502 | −0.0716 | −2.4979 | −6.1379 | −1.7945 | −3.3474 |
| b | 5.9053 | −1.6853 | −10.9643 | 11.8025 | −18.6894 | −9.2723 | −1.4914 | −20.3700 | −8.4673 | 4.4004 | −14.1882 | −4.8118 | |
| c | −4.4332 | 6.1652 | 12.2711 | −11.6176 | 15.9969 | 7.7650 | 0.5245 | 17.9009 | 5.9864 | −4.9807 | 12.9637 | 2.8486 | |
| R2 | 0.9916 | 0.9745 | 0.9957 | 0.9898 | 0.9854 | 0.9858 | 0.9980 | 0.9727 | 0.9953 | 0.9971 | 0.9871 | 0.9997 | |
| P | 7.3891 | 13.4188 | 4.4546 | 10.1939 | 17.6281 | 15.4615 | 4.0263 | 18.4600 | 6.2663 | 5.7546 | 13.8096 | 2.9002 | |
| Caurie | Mo | 6.4447 | 6.9673 | 6.9794 | 4.6621 | 5.5118 | 4.8998 | 5.8206 | 6.0846 | 5.1924 | 5.4721 | 5.8307 | 4.9921 |
| Cc | 2.0139 | 1.7941 | 1.6827 | 1.8706 | 1.6658 | 1.6339 | 1.9924 | 1.8046 | 1.9447 | 1.9999 | 1.8289 | 1.9381 | |
| R2 | 0.9379 | 0.9501 | 0.9908 | 0.9306 | 0.9849 | 0.9860 | 0.9772 | 0.9819 | 0.9924 | 0.9624 | 0.9913 | 0.9926 | |
| P | 21.0463 | 14.9033 | 7.2488 | 24.6195 | 14.7872 | 14.0554 | 16.8839 | 13.3036 | 14.1910 | 22.0374 | 13.6263 | 15.9927 | |
aThe BET equation was applied to the sorption data below aw of 0.5
The sorption data for all mint samples at all temperatures were not fit to Oswin, Henderson and Caurie models. Overall, Peleg, GAB, Lewicki and Modified Mizrahi could be used to describe the mint desorption isotherms. It was reported that BET, GAB, Oswin and Peleg models were best fit for mint (Park et al. 2002). Henderson’s equation was found to be satisfactory for the prediction of the sorption isotherms of aromatic plants including mint (Kouhila et al. 2001). However, in this study neither Henderson model nor Oswin model was indicated a good fit for the entire range of water activity.
Hysteresis
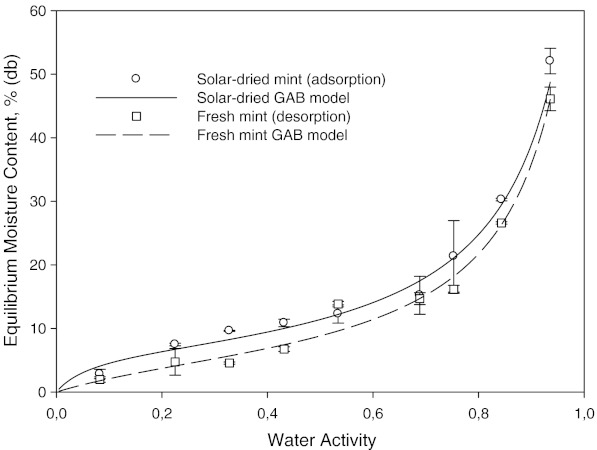
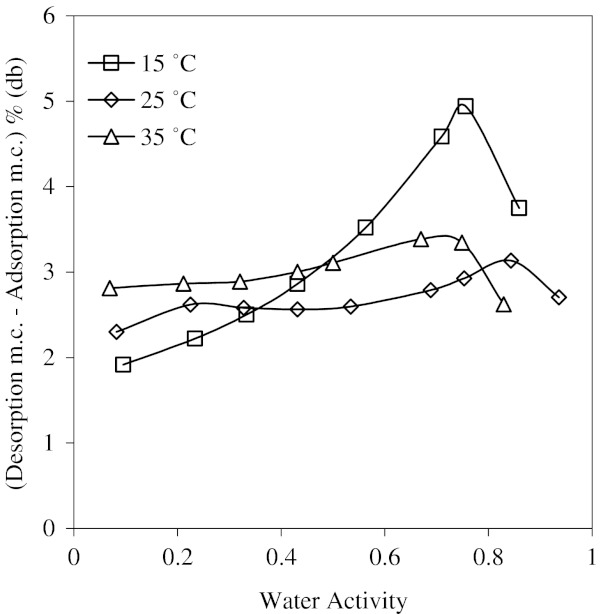
The behavior of adsorption and desorption experiments was different and hysteresis was observed. Equilibrium moisture content was higher at a particular water activity for the desorption curve than that of adsorption (Figs. 4, 5 and 6). The hysteresis existed over the entire range water activity range. Similar type of hysteresis was observed on various foods (Okubayashi et al. 2004).
Fig. 4.
Adsorption (solar-dried) and desorption (fresh) isotherms of mint at 25 °C
Fig. 5.
Sorption hysterisis values
Fig. 6.
Change of moisture sorption isotherm of solar dried mint at 15, 25, and 35 °C
In order to see the hysteresis more clearly desorption moisture content minus adsorption moisture content vs. water activity was plotted (Fig. 6). This figure shows that the hysteresis values increased gradually up to water activity of 0.75 at 25 °C. After this value, the difference was decreased. The magnitude of the hysteresis decreased with an increase in temperature.
Temperature dependence of isotherms
The influence of the temperature on desorption isotherms for the range of water activities studied can be observed. (Fig. 6). It can be seen that moisture contents decrease while the temperature increases at constant water activity. This is possibly due to the state of carbohydrate and proteins which are having more water binding (Ayranci and Dalgic 1992). This is typical for many foodstuffs (Ayranci et al. 1990; Mohamed et al. 2005).
The water activity region above about 0.55, equilibrium moisture content of solar dried samples were lower than equilibrium moisture contents of tray and freeze dried mint samples at 25 °C. This is possibly due to the state of some components such as carbohydrate. Carbohydrates and proteins are known to have more water-binding capacity than at high temperatures. For freeze dried samples less components were being dissolved and thus less water.
The effect of drying method on sorption characteristics of mint
The effect of drying method on the sorption isotherm at 15, 25 and 35 °C can be seen in Figs. 1, 2 and 3, respectively. It is well known that freeze drying provides a dry-product with more porous structure and little shrinkage. At the same time, high retention of nutrients and flavor/aroma can be obtained. Freeze dried samples showed a lower water sorption potential. The higher adsorptive capacities of freeze dried and tray dried samples were more pronounced at higher water activities, especially at 35 °C (Fig. 3). Fast evaporation of water in freeze and tray dried mint samples possibly created more porous structures. The sorbed moisture was low for water activities of up to 0.4 at all temperatures. From this point, the slope of equilibrium moisture content vs. aw curve changed slightly. After this point, there was steep increase in equilibrium moisture content vs. aw curve, indicating gradual dissolution of carbohydrates (Tsami et al. 1998).
Properties of sorbed water
Monolayer moisture contents of mints calculated from GAB, BET and Caurie equations were shown in Table 5. Although Caurie model was not fit very well, it was further analyzed to get fairly accurate information about monolayer moisture content, percent bound water, density of sorbed water, number of adsorbed mono layers and surface area of adsorbent. Caurie model has been used successfully by other workers (Rao et al. 2006) for chhana pado. Mo values are particularly important for determining the storage and preserving conditions above which deteriorative changes may occur. It was observed that the monolayer moisture content was not constant in the range of temperature employed. The value of parameters is in the same range as for other similar products (Ayranci and Duman 2005). The Mo values of various foods are in the range of 4–11% (Karel 1975). Mo values in this work are among 3.6–7%. The Mo values of mints were decreased with increasing temperature. The Mo values of mint obtained using BET model were lower than those obtained using GAB and Caurie models particularly at 25 and 35 °C. The converse was the case at 15 °C.
Table 5.
Properties of sorbed water in mint
| Mint sample | Temperature | Monolayer moisture content. M0.% | Caurie’s equation | |||||
|---|---|---|---|---|---|---|---|---|
| °C | BET | GAB | Caurie | N | Bound water% | Cc. g/cm3 | A m2/g | |
| Fresh | 15 | 7.0551 | 6.0079 | 6.4447 | 3.20 | 20.62 | 2.0139 | 87.13 |
| 25 | 6.6971 | 6.3006 | 6.9673 | 3.88 | 27.03 | 1.7941 | 105.73 | |
| 35 | 5.7116 | 6.2833 | 6.9794 | 4.15 | 28.96 | 1.6827 | 112.92 | |
| Solar- dried | 15 | 4.6845 | 4.2587 | 4.6621 | 2.49 | 11.61 | 1.8706 | 67.86 |
| 25 | 4.6712 | 5.8295 | 5.5118 | 3.31 | 18.24 | 1.6658 | 90.08 | |
| 35 | 3.6401 | 4.6302 | 4.8998 | 3.00 | 14.70 | 1.6339 | 81.65 | |
| Tray-dried | 15 | 6.0867 | 5.7006 | 5.8206 | 2.92 | 17.00 | 1.9924 | 79.54 |
| 25 | 4.9481 | 7.9363 | 6.0846 | 3.37 | 20.51 | 1.8046 | 91.79 | |
| 35 | 5.2225 | 5.9391 | 5.1924 | 2.67 | 13.86 | 1.9447 | 72.69 | |
| Freeze- dried | 15 | 5.7843 | 5.2111 | 5.4721 | 2.74 | 14.99 | 1.9999 | 74.49 |
| 25 | 4.7631 | 6.0282 | 5.8307 | 3.19 | 18.60 | 1.8289 | 86.80 | |
| 35 | 4.8527 | 5.4212 | 4.9921 | 2.58 | 12.88 | 1.9381 | 70.13 | |
The number of adsorbed monolayers (N) for fresh mint samples was increased with increasing temperature (Table 5). For all dried mint samples, the value of N increased with increase in temperature from 15 to 25 °C. N value was decreased when the temperature was increased from 25 to 35 °C (except for the BET model).
The increase in the number of adsorbed monolayers with an increase in temperature for fresh mint is possibly due to increase in polar groups (Singh et al. 2006). Bound water and surface area of absorbance showed different characteristics for fresh and dried mint samples. Both bound water and area of absorbance increased with increased temperature for fresh mint. No trend has been observed for dried samples.
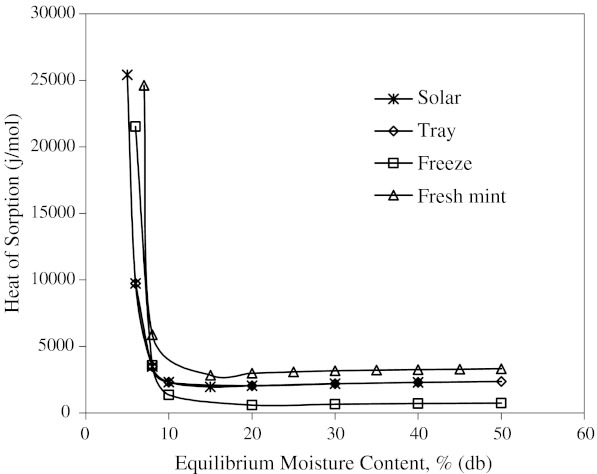
Heat of sorption is of interest to food scientists because it determines the temperature dependence of water activity. Isosteric sorption heat (Qst) plotted as a function of moisture content is presented in Fig. 7. Qst decreased exponentially with increasing moisture content, initially rapidly up to (10%) and later slowly. This kind of behavior has been observed for many foods (Mohamed et al. 2005). The Qst values reached a plateau after the moisture content about 10%. This plateau lies in the range of heat of vaporization of pure water. The rapid increase in Qst values at low moisture content is due to existence of highly active polar sites on the surface of food material, which are covered with water molecules forming a mono molecular layer (Hossain et al. 2001). Higher heat of sorption also indicates that there is a need for the highest binding energy for removal of water. Increasing moisture content decreases the heat of sorption and therefore binding energy for removal of water.
Fig. 7.
Effect of moisture content on the isosteric heat of sorption of mint samples
The Qst values are below 40 kJ/mol. This is called physisorption where the sorption involves weak bonding to the surface (Moore 1972). Here, Van der Waals interactions are usually involved and absorbed molecules can often move across the surface. The molecules remain intact, and can be freed easily (the forces are small, and short-range).
The relation between isosteric heat of sorption and equilibrium moisture content was accurately described by a two parameter exponential model and shown in Table 6. Exponential (Adam et al. 2000) and power law (McMinn and Magee 2003) models for onion and potato, respectively were used to express the relationships between isosteric heat of sorption and moisture content.
Table 6.
Thermodynamic properties of mint
| Heat of sorption | qst | R2 | |
| Fresh |  |
0.988 | |
| Solar-dried |  |
0.999 | |
| Tray-dried |  |
0.998 | |
| Freeze-dried |  |
0.999 | |
| Entropy of sorption | ΔSd | R2 | |
| Fresh |  |
0.986 | |
| Solar-dried |  |
0.996 | |
| Tray-dried |  |
0.956 | |
| Freeze-dried |  |
0.997 | |
| qst & ΔSd relationship | Tβ (K) | α | R2 |
| Fresh | 368.51 | 214.95 | 0.978 |
| Solar-dried | 342.02 | 687.07 | 0.992 |
| Tray-dried | 307.28 | 977.15 | 1.000 |
| Freeze-dried | 352.56 | 1004.61 | 0.988 |
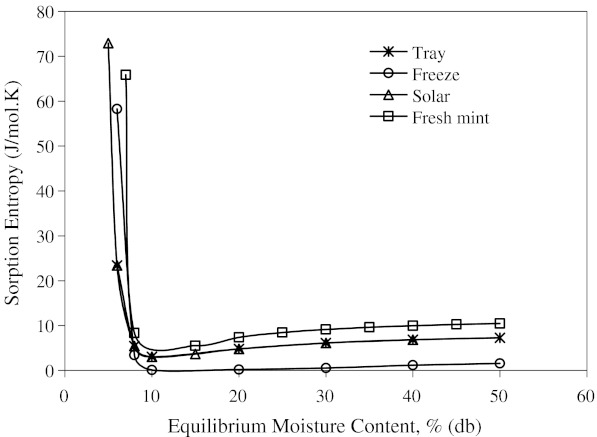
The entropies plotted as a function of water content are presented in Fig. 8. Entropies for all mint samples had minimum values at 10% moisture content. All mint samples showed a decrease in entropy, reaching a minimum and than slightly increasing and reaching a plateau as water content increased. After reaching plateau, entropy values remained practically constant at higher moisture contents. Fresh mint showed minimum sorption entropy at higher moisture content compared to that of dried mint samples. The relation between differential entropy of sorption and equilibrium moisture content was accurately described by a two parameter exponential model and also shown in Table 6.
Fig. 8.
Differential entropy change of mint samples with moisture content
The relation between differential entropy and isosteric heat was determined by linear regression analysis (Eq. 7). Very high values of correlation coefficients (R2) between 0.978 and 1.000 have been observed (Table 5). This indicates a high degree of linearity between differential entropy and isosteric heat, the compensation theory is assumed to exit (McMinn et al. 2005). The harmonic mean temperature (Thm) was calculated from Eq. 8 and found as 297.93 K. According to Leffler, if Tβ > Thm the process is enthalpy driven, the reverse is valid for entropy driven. Tβ values of mint samples were higher than Thm (Table 5). The water sorption process is therefore considered to be enthalpy controlled.
Conclusions
The moisture sorption isotherms of fresh, tray-, solar-, and freeze-dried mint leaves at different temperatures were determined by a standard gravimetric method. The equilibrium moisture content increased decreasing temperature at constant water activity. The hysteresis between adsorption and desorption was observed. The experimental data were fitted to nine sorption models. Among them, GAB, Lewicki, Peleg, and modified Mizrahi equations described the sorption data well over the range of temperatures and water activities investigated. Isosteric heat of sorption of mint leaves decreased with increasing moisture content. Exponential model can be used to characterize heat of sorption and entropy of sorption.
Acknowledgements
This work was supported by The Research Fund of Gaziantep University.
References
- Adam E, Muhlbauer W, Esper A, Wolf W, Spiess W. Effect of temperature on water sorption equilibrium of onion (Allium cepa L.) Drying Technol. 2000;18(9):2117–2129. doi: 10.1080/07373930008917829. [DOI] [Google Scholar]
- AOAC (1990) In Official methods of analysis. Association of Official Analytical Chemists 17–18
- Ayranci E, Dalgic AC. Moisture sorption isotherms of Pistacia terebinthus L. and its protein isolate. Lebensm-Wiss Technol-Food Sci Technol. 1992;25:482–483. [Google Scholar]
- Ayranci E, Duman O. Moisture sorption isotherms of cowpea (Vigna unguiculata L. Walp) and its protein isolate at 10, 20 and 30 °C. J Food Eng. 2005;70:83–91. doi: 10.1016/j.jfoodeng.2004.08.044. [DOI] [Google Scholar]
- Ayranci E, Ayranci G, Dogantan Z. Moisture sorption isotherms of dried apricot, fig and raisin at 20 °C and 30 °C. J Food Sci. 1990;55:1591–1593. doi: 10.1111/j.1365-2621.1990.tb03577.x. [DOI] [Google Scholar]
- Basu S, Shivhare US, Mujumdar AS. Models for sorption isotherms for foods: a review. Drying Technol. 2006;24:917–930. doi: 10.1080/07373930600775979. [DOI] [Google Scholar]
- Chirife J, Iglesias HA. Equations for fitting water sorption isotherms of foods. Part I. A review. J Food Technol. 1978;13:159–174. doi: 10.1111/j.1365-2621.1978.tb00792.x. [DOI] [Google Scholar]
- Ekechukwu OV. Review of solar-energy drying systems I: an overview of drying principles and theory. Energy Convers Manage. 1999;40:593–613. doi: 10.1016/S0196-8904(98)00092-2. [DOI] [Google Scholar]
- Ekechukwu OV, Norton B. Review of solar-energy drying systems II: an overview of solar drying technology. Energy Convers Manage. 1999;40:615–655. doi: 10.1016/S0196-8904(98)00093-4. [DOI] [Google Scholar]
- Hossain MD, Bala BK, Hossain MA, Mondol MRA. Sorption isotherms and heat of sorption of pineapple. J Food Eng. 2001;48:103–107. doi: 10.1016/S0260-8774(00)00132-1. [DOI] [Google Scholar]
- Iglesias HA, Chirife J, Viollaz P. Thermodynamics of water vapor sorption by sugar beet root. J Food Technol. 1976;11:91–101. doi: 10.1111/j.1365-2621.1976.tb00705.x. [DOI] [Google Scholar]
- Karel M. Water activity and food preservation. In: Karel M, Fennema OR, Lund DB, editors. Physical principles of food preservation. Principles of food science, part 2. New York: Marcel Dekker, Inc; 1975. pp. 237–263. [Google Scholar]
- Kouhila M, Belghit A, Daguenet M, Boutaleb BC. Experimental determination of the sorption isotherms of mint (Mentha viridis), sage (Salvia officinalis) and verbena (Lippia citriodora) J Food Eng. 2001;47:281–287. doi: 10.1016/S0260-8774(00)00130-8. [DOI] [Google Scholar]
- Labuza TP. Moisture sorption: practical aspects of isotherm measurement and use. St Paul: American Association of Cereal Chemists; 1984. [Google Scholar]
- Lee JH, Lee MJ (2008) Effect of drying method on the moisture sorption isotherms for Inonotus obliquus mushroom. Lebensm-Wiss Technol-Food Sci Technol 41:1478–1484
- Lefler JE. The enthalpy-entropy relationship and its implication for organic chemistry. J Org Chem. 1955;20:1202–1230. doi: 10.1021/jo01126a009. [DOI] [Google Scholar]
- Lomauro CJ, Bakshi AS, Labuza TP. Evaluation of food moisture sorption equations; part I: fruit, vegetable and meat products. Lebensm-Wiss Technol-Food Sci Technol. 1985a;18:111–117. [Google Scholar]
- Lomauro CJ, Bakshi AS, Labuza TP. Evaluation of food moisture sorption equations; part II: milk, coffee, tea, nuts, oilseeds, spices and starchy foods. Lebensm-Wiss Technol-Food Sci Technol. 1985b;18:118–124. [Google Scholar]
- McMinn WAM, Magee TRA. Thermodynamic properties of moisture sorption of potato. J Food Eng. 2003;60:157–165. doi: 10.1016/S0260-8774(03)00036-0. [DOI] [Google Scholar]
- McMinn WAM, Al-Muhtaseb AH, Magee TRA. Enthalpy–entropy compensation in sorption phenomena of starch materials. Food Res Int. 2005;38:505–510. doi: 10.1016/j.foodres.2004.11.004. [DOI] [Google Scholar]
- Mohamed LA, Kouhila M, Jamali A, Lahsasni S, Mahrouz M. Moisture sorption isotherms and heat of sorption of bitter orange leaves (Citrus aurantium) J Food Eng. 2005;67:491–498. doi: 10.1016/j.jfoodeng.2004.05.016. [DOI] [Google Scholar]
- Moore WJ. Physical chemistry. London: Longman; 1972. [Google Scholar]
- Okubayashi S, Griesser UJ, Bechtold T. A kinetic study of moisture sorption and desorption on lyocell fibers. Carbohydr Polym. 2004;58:293–299. doi: 10.1016/j.carbpol.2004.07.004. [DOI] [Google Scholar]
- Park KJ, Vohnikova Z, Brod FPR. Evaluation of drying parameters and desorption isotherms of garden mint leaves (Mentha crispa L.) J Food Eng. 2002;51:193–199. doi: 10.1016/S0260-8774(01)00055-3. [DOI] [Google Scholar]
- Peleg M. Assessment of a semi-empirical four parameter general model for sigmoid moisture sorption isotherms. J Food Process Eng Conn USA. 1993;16(1):21–37. doi: 10.1111/j.1745-4530.1993.tb00160.x. [DOI] [Google Scholar]
- Rao KJ, Dhas PHA, Emerald FME, Ghosh BC, Balasubramanyam BV, Kulkarni S. Moisture sorption characteristics of chhana podo at 5 °C and 35 °C. J Food Eng. 2006;76:453–459. doi: 10.1016/j.jfoodeng.2005.04.048. [DOI] [Google Scholar]
- Rizvi SSH, Benado AL (1984) Thermodynamic properties of dehydrated foods. Food Technol :83–92, March
- Rosa GS, Moraes MA, Pinto LAA. Moisture sorption properties of chitosan LWT. Food Sci Technol. 2010;43:415–420. [Google Scholar]
- Singh RRB, Rao KH, Anjaneyulu ASR, Patil GR. Water desorption characteristics of raw goat meat: effect of temperature. J Food Eng. 2006;75:228–236. doi: 10.1016/j.jfoodeng.2005.04.013. [DOI] [Google Scholar]
- Sinija VR, Mishra HN. Moisture sorption isotherms and heat of sorption of instant (soluble) green tea powder and green tea granules. J Food Eng. 2008;86:494–500. doi: 10.1016/j.jfoodeng.2007.10.026. [DOI] [Google Scholar]
- Soysal Y, Öztekin S. Sorption isosteric heat for some medicinal and aromatic plants. J Agric Eng Res. 2001;78(2):159–166. doi: 10.1006/jaer.2000.0638. [DOI] [Google Scholar]
- Telis VRN, Gabas AL, Menegalli FC, Telis-Romero J. Water sorption thermodynamic properties applied to persimmon skin and pulp. Thermochim Acta. 2000;343:49–56. doi: 10.1016/S0040-6031(99)00379-2. [DOI] [Google Scholar]
- Timoumi S, Zagrouba F. Water sorption and dehydration kinetics of Tunisian rosemary leaves. Desalination. 2005;185:517–521. doi: 10.1016/j.desal.2005.03.091. [DOI] [Google Scholar]
- Tsami E, Krokida MK, Drouzas AE. Effect of drying method on the sorption characteristics model fruit powders. J Food Eng. 1998;38:381–392. doi: 10.1016/S0260-8774(98)00130-7. [DOI] [Google Scholar]
- Tsimidou M, Biliaderis CG. Kinetic studies of saffron (Crocus sativus L) quality deterioration. J Agric Food Chem. 1997;45(8):2890–2898. doi: 10.1021/jf970076n. [DOI] [Google Scholar]
- Whfoods (2006) The world’s healthiest foods. Peppermint, fresh; In depth nutrient analysis. http://www.whfoods.com/genpage.php?tname=nutrientprofile&dbid=115, June


