Abstract
Attempts were made to evolve an efficient technique for quality assessment of tea (Camellia sinensis) using a tyrosinase based biosensor to detect polyphenols (PP). Tyrosinase catalyzes the polymerization of PP to form theaflavins (Tf) and thearubigins (Tr) contributing to the colour and astringency of tea, which determine tea quality. Variation in biosensor response of tea infusions gave an indication of differential amount of Tf and Tr. A comparative study of quality attributes of 8 varieties of commercially available brands of tea (A–H) was done using biosensor and results were compared with conventional techniques such as spectrophotometry, high performance liquid chromatography (HPLC), Commission Internationale de I’Eclairage (CIE) system and sensory evaluation. Considerable correlation was observed among the biosensor, sensory and spectrophotometric evaluation of tea samples. Sample A showed high Tf content and also showed a relative high biosensor response whereas sample G showed relatively poor response. Application of biosensors would serve as a basis for the evaluation of market value of tea in the near future.
Keywords: Tea, Polyphenols, Theaflavins, Thearubigins, Sensory, Biosensor
Introduction
Tea (Camellia sinensis), the ‘magic’ herb is among the largest consumed beverages in the world. There are many varieties of tea based on manufacturing processes like green tea, black tea, yellow tea, white tea and oolong tea. The chemical composition of tea would vary based on varietal differences, environmental effects, methods of processing and mode of preparation (Das and Tewari 2004). Tea is the only beverage known to contain significant levels of flavonoids (33% polyphenols) (Bronner and Beecher 1998). Among the tea types, white and green tea have the highest concentration of catechins (Lakenbrink et al. 2000). Yao et al. (2006) reported that phenolic compounds are the main quality parameters for tea. Polyphenols (PP), primarily catechins, present in tea leaves undergo oxidation to form polymeric products, which have been identified as theaflavins(Tf), theaflagillins, thearinensis, theacitrins and thearubigins(Tr). During the manufacture of black tea, a major proportion of monomeric free catechins (90% of total PP in green tea) in the fresh green tea leaves undergo oxidative polymerization to form oligomers (13% of total PP in black tea) and polymers (47% of total PP in black tea) (Harbowy and Balentine 1997). Tr, the orange-brown compounds constituting 6–18% of dry weight, are responsible for taste, total colour and body of the liquor. They contribute ~35% of total colour and also play a significant role in brown colour of tea, as also strength and mouth feel of tea liquor/infusion. Tf, the golden yellow pigment, constitutes 0.5–2% of dry weight, depending on the method of manufacturing of black tea. The attractive colour of tea infusion is due to Tf and it emerges as an important quality index of black tea and contributes significantly to the astringency, briskness, brightness and colour of tea beverage (Roberts 1962). Quality of tea depends on various components, predominantly PP, which are mainly responsible for the colour and flavour of tea beverage, (Ananthacumaraswamy and Singh 2002).
Various analytical tools have been reported for estimation of tea quality in terms of colour, tone strength, briskness, astringency and other characteristics attributed to Tf and other factors. Advanced methods such as capillary electrophoresis, electronic tongue and lipid membrane taste sensors have been applied to tea quality estimation (Legin et al. 1997; Horie and Kohata 1998; Ivarrson et al. 2001a, b). However, these techniques are not widely used commercially due to high cost and requirement of skilled personnel and laboratory set-up. Aim of the present work was to study differential techniques and develop a considerably simplified procedure, which will be most suitable for routine analysis. For this purpose, a biosensor for the analysis of tea PP, developed at the institute was used as a tool.
Tyrosinase, a commercially available enzyme from Agaricus bisporus was used in the present study in a biosensor to detect the polymerized products of PP. Tyrosinase catalyzes oxidation of diphenols to o-quinones, the quinones formed will then polymerize to form Tf and Tr. A tyrosinase biosensor has been reported for the detection of phenols in water (Puig and Barcelo 1996), but there have been no reports regarding detection of PP in tea.
Materials and methods
Eight brands of black tea samples were procured from local market and labeled as A–H. Tyrosinase was obtained from Sigma Aldrich, USA. All solvents and chemicals used were of analytical grade.
Preparation of black tea extract
For each analysis, 1.5 g of tea with 100 ml water was boiled for 10 min. The extract was obtained by filtering the black tea through a cheese cloth and the extract was used for various analyses.
Analysis of Tf and Tr by spectrophotometry
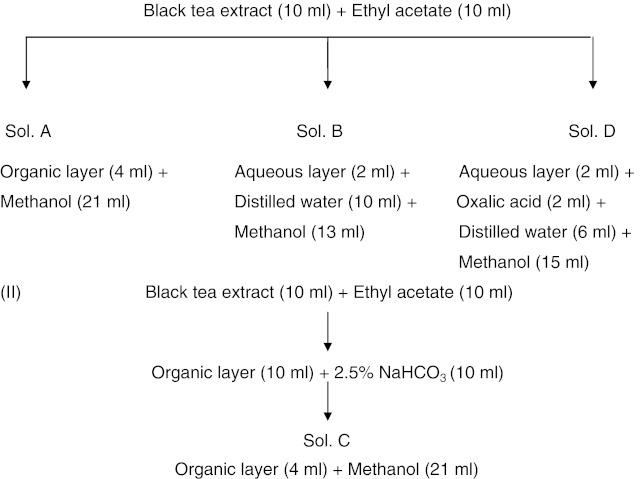
Tf and Tr analysis was carried out with the method described by Roberts and Smith (1961). For the analysis of Tf and Tr, 4 solutions, Sol A, Sol B, Sol C and Sol D, were prepared as presented below,
The OD of solutions A, B, C and D (EA, EB, EC and ED) were measured in a 1.5 cm quartz cuvette in a spectrophotometer (UV-1601, Shimadzu, Japan).
Evaluation of Tf and Tr content
Any factor for converting optical density into percentage of Tf or Tr will be somewhat arbitrary as it is dealing with a rather complex mixture of substances, none of which have been isolated in a pure state. Consequently little error will be introduced by expressing total Tf as Tf gallate as the latter is always considerably more than the former in tea. The optical densities, EC at 380 nm and 460 nm are converted into a percentage of anhydrous Tf gallate by multiplying with factors 2.25 and 6.69, respectively. Tf ratio was obtained from the ratio of optical densities at 380 and 460 nm and similarly for Tr ratio. The Tf ratio of optical densities at 380 and 460 nm should be 2.98 1 to indicate the complete removal of Tr during Tf extraction (Roberts and Smith 1961). The Tr ratio is generally found to be between 3.6 and 8.2. A high ratio implies relatively light colour and a low ratio, a deeper colour. The percentage of Tr was calculated by measuring OD of tea infusions at 460 nm and by using the formula  (Roberts 1962).
HPLC analysis
The tea extracts were filtered and run through a C18 column in a Shimadzu LC 10 A (Japan) instrument using a gradient mobile phase consisting of solvent a (0.05% orthophosphoric acid in millipore water) and solvent b (15% acetonitrile). The samples were analysed at 280 and 360 nm for catechin and Tf, respectively (data not shown).
Colour estimation
Quantitative colour measurements of the samples were performed using a computerized spectrophotometer (Konica Minolta CM-3500d, Osaka, Japan) and values were calculated by CIE system (CIE 1974).
The measurement of colour and the assessment of colour differences are essential to meet the specifications agreeable between the customer and the supplier. In the CIE system, the total colour difference (∆E*) combines the difference of 3 independent variables, namely: L*, a*, b*: The lightness difference on the L* axis, expressed as ∆L*, the red-green colour difference on the a* axis expressed by ∆ a* and the yellow-blue colour difference on the b* axis, expressed by ∆b*.
Sensory evaluation
The tea infusions were subjected to sensory profiling according to quantitative descriptive analysis method (Stone et al. 1974). Trained panelists (12 members) participated in the evaluation. The descriptors were derived after initial discussion, where the panelists were provided with evaluation charts and were asked to describe the samples with descriptive terms suitable for the samples. The common descriptors chosen by more than one third of the panelists were used for development of a ‘score card’, which consisted of all attributes on a 15 cm scale each. Evaluation was carried out in a sensory laboratory with individual booths under fluorescent lighting similar to daylight. Samples of tea infusion were kept in hot water bath and served at 40 °C in 3 digit coded glass containers. Panelists were asked to indicate the perceived intensities of the attributes by drawing a vertical line on the scale and writing the code number. Distilled water was used for rinsing and puffed rice for cleansing the palate in between evaluations.
Statistical analysis
Principal component analysis (PCA) was performed using the sensory scores of each attribute over samples to find the underlying interrelationships. Total PP, Tf and Tr were taken as major chemical constituents for the analysis. All data were expressed as mean ± standard deviation (SD) of three independent replicates. PCA biplot and analysis were done using a statistical package ‘Statistica’ (1999) software “StatSoft, USA”.
Biosensor studies
Enzyme immobilization
Tyrosinase was immobilized by cross-linking method reported by Gouda et al. (2002), which was modified slightly. About 150 IU of tyrosinase and 30 μl (from 1 mg/ml stock, with an activity of 46,400 IU/mg) of lysozyme were placed on a 2 cm × 2 cm cellophane membrane and mixed thoroughly. To this 30 μl of 4% of 70% glutaraldehyde, was added and mixed thoroughly to stabilize the enzyme. After 1 h, the enzyme membrane was washed 3 times with 0.1 M sodium phosphate buffer (pH 6.8) to remove the excess glutaraldehyde and mounted on a Clark’s electrode connected with an amperometric detection system. The electrode was dipped in a sample cell containing 2 ml phosphate buffer (pH 6.8), which was continuously saturated with oxygen through air bubbling. The voltage response due to the catalytic activity of tyrosinase on tea PP was measured for 5 min.
Principle of the biosensor operation
Transformation of PP with the consumption of oxygen forms the basis for the biosensor operation during which a change in the dissolved oxygen concentration correlates with the concentration of catechins, which is a measure of tea quality in terms of PP content.
The biochemical reaction is represented as,
 |
(QH2 and Q are reduced and oxidized forms of phenols respectively).
In terms of electron transfer, the reaction can be written as
 |
The depletion of oxygen at the electrode caused by the biochemical reaction also involves consumption of electrons, resulting in an electrochemical signal (in terms of milli volts), which is proportional to the concentration of PP in the sample. This signal is conditioned, amplified and monitored through an amperometric detector system.
Results and discussion
Comparative study with various analytical techniques
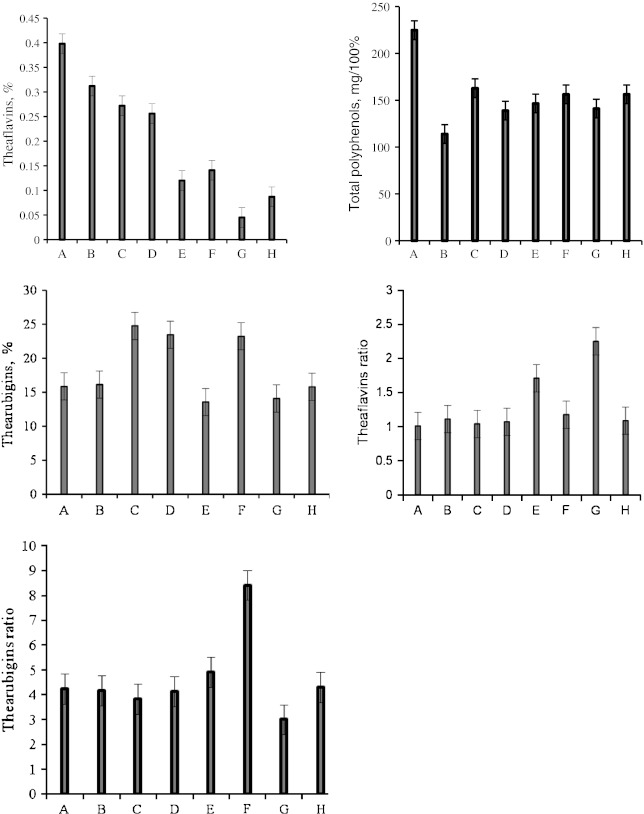
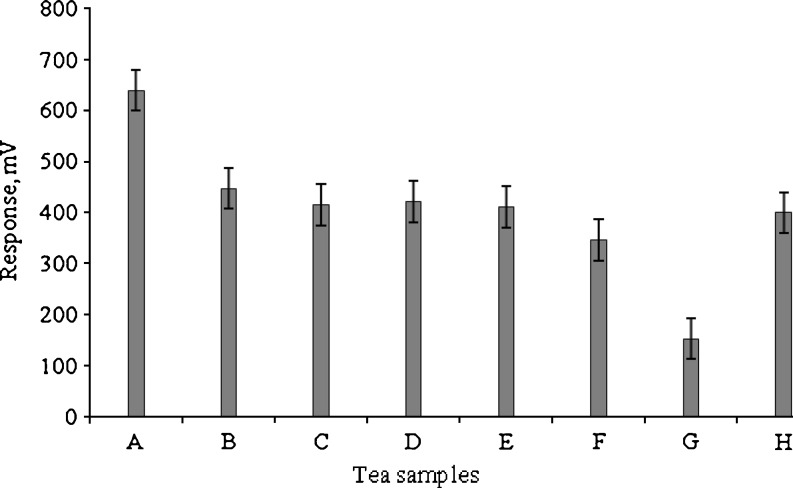
Sample A showed high total PP content (Fig. 1) and high response with biosensor (in terms of voltage) (Fig. 2). The same tea sample showed good values (0.4%) of Tf by spectrophotometry (Fig. 1), was also graded as one of the best tea samples through colour estimation (Figs. 3 and 4) and also by the sensory panelists in their evaluation charts.
Fig. 1.
Spectrophotometric estimation of chemical constituents of eight brands of commercial black tea samples (A–H). (n = 3)
Fig. 2.
Biosensor studies with different brands (A–H) of black tea samples
Fig. 3.
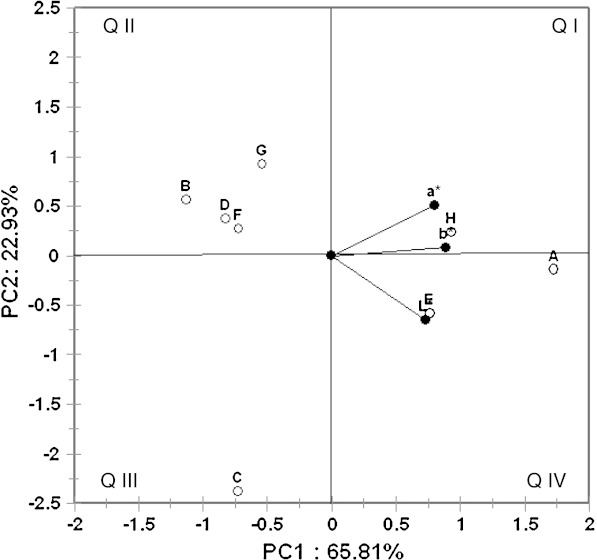
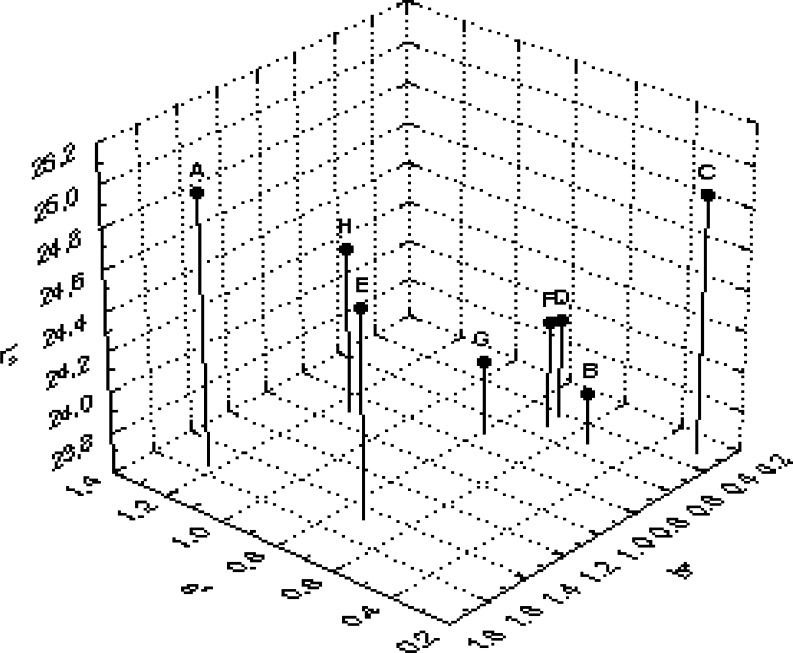
Principal component analysis of colour measurement of various brands of black tea samples. L- lightness, a-red to green colour, b- yellow-blue colour, Q I–IV: Quadrant I–IV; A–H Brands of black tea samples
Fig. 4.
Colour measurement of various brands of tea samples by CIE colour measuring system. A–H: Brands of black tea samples, L*, a*, b*: see Fig. 2
The Tr content of tea is always considerably higher than the Tf content, but as the Tf are much more intensely coloured, their contribution to total colour is significant (Roberts 1962). It was observed that samples containing higher Tf showed better response with biosensor. Samples B, C and F showed comparatively high content of Tr (Fig. 1). Interestingly, it was found that sample G and sample E having low amount of Tf (Fig. 1) showed low response in biosensor (Fig. 2). This was also confirmed by obtaining the Tf ratio (Fig. 1), which was high and was due to low Tf content and incomplete removal of Tr (Roberts 1958, 1962) indicating that the dark colour of tea infusions of samples G and E (Fig. 1), was due to apparently synthetic colour additives during manufacturing process. The Tf ratio of 1–2.9 indicates bioconversion, but a ratio higher than this range indicates the incomplete removal of Tr during extraction of Tf as observed (Roberts and Smith 1961). Any value below this range indicates greater Tf/Tf—gallate content in the sample. Similarly, sample A gave a low Tf ratio indicating high Tf/Tf—gallate content and therefore gave a good response in biosensor and was also graded best by the sensory panelists (Figs. 2 and 5).
Fig. 5.
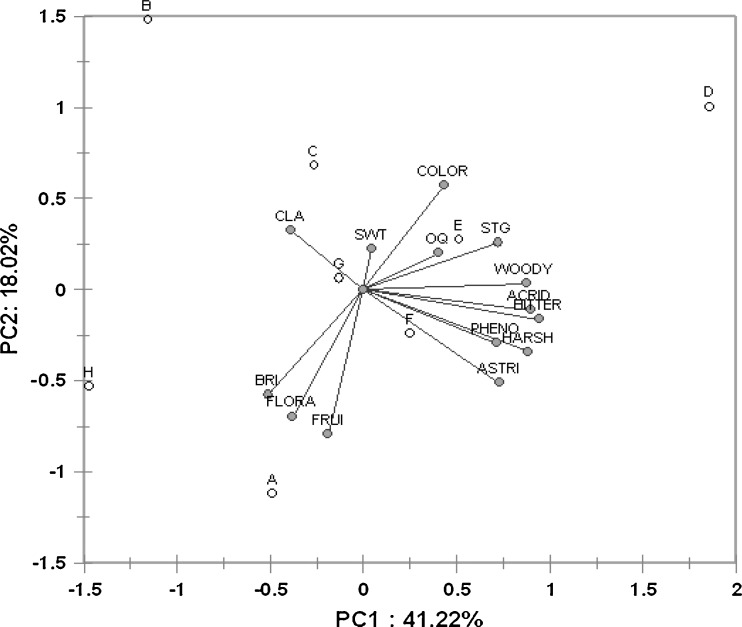
Principal component analysis of sensory parameters of various brands of tea samples. A–H: Brands of black tea samples; Astri- astringency; Harsh-harsh; Pheno-phenolic; Acrid- acrid; Bitter-bitter; Wood- woody flavour; Stg-Strong; Oq- opaque; Color-colour; Swt-sweetness; Cla- clarity; Bri-brightness; Flor-floral; Frui-fruity
Colour measurement
The positive values of a* and b* obtained by the CIE colour measuring system, suggest that the black tea infusions were red—yellow, which is also due to Tf and Tr and the biosensor response showed maximum values for samples with high content of the above two compounds which contribute much to the colour of tea and thereby improving its acceptability. The instrumental colour parameters, L*, a* and b* were subjected to PCA obtained with tea samples. The results showed discrimination between samples. Principal component axis 1 (PC 1) accounted for 65.8% while PC 2 accounted for 22.9% of the variance of the data (Fig. 3). They together accounted for more than 88% variance in the data. The analysis indicated that all 3 colour parameters were highly loaded on the positive side of the PC1 axis. It is clear from the plot (Fig. 3) that sample H prepared in our laboratory was distributed evenly between the reddish and yellow components ‘a’ and ‘b’, respectively while sample E was lighter in colour. On the other hand, sample A appeared inclined towards the reddish component ‘a’ and other samples like B, D, G and F forming a group on the second quadrant were negatively correlated with lightness component ‘L’. All these samples gave low response in a biosensor (Fig. 2) in comparison to samples A and H. Sample G though placed in the second quadrant, appeared red (visually) and showed high b* values, showed less Tf and gave very low response in biosensor (Figs. 2 and 3). Therefore, the apparent red colour is due to adulteration with artificial colours which had no effect on tyrosinase used in the biosensor confirming the absence of required response for tea PP. Apart from these samples, sample C was clearly separated from rest of the samples and was located on the third quadrant (Fig. 3). It was negatively correlated with reddish component ‘a’. It is clear from the biplot that PCA was effective in discriminating colour parameters with tea samples. It is clear from 3 dimensional representation (Fig. 4) of PCA of the colour parameters of samples E which showed high b* reading indicating dark colour confirming the high Tf ratio which is due to low Tf (Fig. 1).
PCA of sensory parameters
Figure 5 depicts the PCA biplot of sensory attributes of tea samples. The variance accounted by the PC1 was 41.2% while PC 2 accounted 18% and together almost 60% of the variance of the sensory data. The most desirable attributes like body, strength, colour and overall quality were associated with sample D followed by sample E that are coincidentally 2 well known brands of the same company. Some of the undesirable attributes in tea quality assessment like phenolic, harshness and astringency were associated with sample F that is a locally available brand. Samples B, C and G were characterized more with sweetness and clarity. In the third quadrant (Fig. 5), sample A closely followed by sample H was clearly associated with attributes like brilliant, floral and fruity. Comparing Figs. 3, 4 and 5, it was observed that the samples lying in the third quadrant of PCA plot showed good response in the tyrosinase based biosensor. Interestingly, only sample G was closest to the origin in Fig. 5 implying low score in sensory attributes due to adulteration and low Tf content by spectrophotometry (Fig. 1). This was further confirmed by the low response in biosensor analysis and PCA. From the above observations PP are found to be effective in characterizing the sensory parameters of tea samples.
Conclusion
Generally astringency and colour are the two most commonly tested parameters of tea, which are contributed mainly by Tf and Tr. Attempts were made for the first time to establish an association between the content of 2 most important PP oxidized products (Tf and Tr) in different tea samples and their effect on subjective analysis and response with tyrosinase based biosensor. The tyrosinase based biosensor gave a good response for the commercial tea sample that was also rated as the best according to traditional methods of quality assessment. The biosensor response varied proportionally to the Tf content in the tea sample. The content of Tf/Tr is a major determinant of tea quality. Hence this method would serve as a basis for a chemical evaluation of the market samples of tea.
Acknowledgment
Sujith Kumar PV is grateful to Council of Scientific and Industrial Research, Govt. of India for the award of research fellowship. Financial support from Department of Science and Technology, Government of India, is gratefully acknowledged. Authors thank Director, CFTRI, for providing the facilities and encouragement.
References
- Ananthacumaraswamy S, Singh ID. An overview on the factors affecting the quality of Sri Lankan black tea. J Food Sci Technol. 2002;39:449–457. [Google Scholar]
- Bronner WE, Beecher GR. Method for determining the content of catechins in tea infusions by high performance liquid chromatography. J Chromatogr A. 1998;805:137–142. doi: 10.1016/S0021-9673(98)00040-5. [DOI] [PubMed] [Google Scholar]
- CIE Colorimetry Committee, technical notes: working program on colour differences. J Opt Soc Am. 1974;64:896–897. [Google Scholar]
- Das SK, Tewari VK. Changes in tea shoots and made tea due to or during withering: a review. J Food Sci Technol. 2004;41:235–239. [Google Scholar]
- Gouda MD, Kumar MA, Thakur MS, Karanth NG. Enhancement of operational stability of an enzyme biosensor for glucose and sucrose using protein based stabilizing agents. Biosens Bioelectron. 2002;17:503–507. doi: 10.1016/S0956-5663(02)00021-0. [DOI] [PubMed] [Google Scholar]
- Harbowy ME, Balentine DA. Tea chemistry. Crit Rev Plant Sci. 1997;16:415–480. [Google Scholar]
- Horie H, Kohata K. Application of capillary electrophoresis to tea quality estimation. J Chromatogr A. 1998;802:219–223. doi: 10.1016/S0021-9673(97)01069-8. [DOI] [Google Scholar]
- Ivarrson P, Kikkawa Y, Winquist F, Krantz-Rulcker C, Hojer NE, Hayashi K, Toko K, Lundstrom I. Tasting of beverages using an electronic tongue. Anal Chim Acta. 2001;449:59–68. doi: 10.1016/S0003-2670(01)01349-6. [DOI] [Google Scholar]
- Ivarrson P, Rudnitskaya Y, Hojer NE, Krantz-Rulcker C, Winquist F. Discrimination of tea by means of a voltametric electronic tongue and different applied waveforms. Sens Actuators B. 2001;76:449–454. doi: 10.1016/S0925-4005(01)00583-4. [DOI] [Google Scholar]
- Lakenbrink C, Lapczynski S, Maiwald B, Engelhardt UH. Flavonoids and other polyphenols in consumer brews of tea and other caffeinated beverages. J Agric Food Chem. 2000;48:2848–2852. doi: 10.1021/jf9908042. [DOI] [PubMed] [Google Scholar]
- Legin A, Rudnitskaya A, Vlasov Y, Natale CD, Davide F, D’Amico A. Comparison of a voltametric electronic tongue and a lipid membrane taste sensor. Sens Actuators B. 1997;44:291–296. doi: 10.1016/S0925-4005(97)00167-6. [DOI] [Google Scholar]
- Puig D, Barcelo D. Determination of phenolic compounds in water and wastewater. Trends Anal Chem. 1996;15:362–375. [Google Scholar]
- Roberts EAH. The phenolic substances of manufactured tea. II. Their origin as enzymic oxidation products in fermentation. J Sci Food Agric. 1958;9:212–216. doi: 10.1002/jsfa.2740090405. [DOI] [Google Scholar]
- Roberts EAH. Economic importance of flavonoid substances: tea fermentation. In: Geissman TA, editor. The chemistry of flavonoid compounds. Oxford: Pergamon; 1962. pp. 409–512. [Google Scholar]
- Roberts EAH, Smith RF. Spectrophotometric measurements of theaflavins and thearubigins in black tea liquors in assessment of quality of teas. Analyst. 1961;86:94–98. doi: 10.1039/an9618600094. [DOI] [Google Scholar]
- Statistica (1999) Statsoft, Inc, 2300 East 4th Street, Tulsa, OK 74104, USA
- Stone H, Sidel JOS, Wodsey A, Singleton RC. Sensory evaluation by quantitative descriptive analysis. Food Technol. 1974;28(11):24–34. [Google Scholar]
- Yao LH, Jiang YM, Caffin N, Arcy BD, Datta N, Liu X, Singanusong R, Xu Y. Phenolic compounds in tea from Australian supermarkets. Food Chem. 2006;96:614–620. doi: 10.1016/j.foodchem.2005.03.009. [DOI] [Google Scholar]


