

Abstract
The oomycete vegetable pathogen Phytophthora capsici has shown remarkable adaptation to fungicides and new hosts. Like other members of this destructive genus, P. capsici has an explosive epidemiology, rapidly producing massive numbers of asexual spores on infected hosts. In addition, P. capsici can remain dormant for years as sexually-recombined oospores, making it difficult to produce crops at infested sites, and allowing outcrossing populations to maintain significant genetic variation. Genome sequencing, development of a high-density genetic map, and integrative genomic/genetic characterization of P. capsici field isolates and intercross progeny revealed significant mitotic loss of heterozygosity (LOH) and higher levels of SNVs than those reported for humans, plants, and P. infestans. LOH was detected in clonally propagated field isolates and sexual progeny, cumulatively affecting >30% of the genome. LOH altered genotypes for more than 11,000 single nucleotide variant (SNV) sites and showed a strong association with changes in mating type and pathogenicity. Overall, it appears that LOH may provide a rapid mechanism for fixing alleles and may be an important component of adaptability for P. capsici.
INTRODUCTION
Phytophthora capsici is a virulent, hemibiotrophic pathogen of vegetable crops, inflicting significant losses worldwide (Leonian 1922; Erwin and Ribeiro 1996; Gevens et al. 2008; Lamour and Kamoun 2009; Meitz et al. 2010; Lamour et al. 2011). It’s main hosts are peppers and cucurbits and during the last ninety years P. capsici has spread geographically as agricultural cultivation of these hosts has intensified; dynamically adapting to fungicides and new hosts (Leonian 1922; Erwin and Ribeiro 1996; Lamour and Hausbeck 2001; Hausbeck and Lamour 2004; Gevens et al. 2008; Hurtado-Gonzales et al. 2008; Lamour and Kamoun 2009; Meitz et al. 2010; Lamour et al. 2011; Gobena et al. 2012). Like other members of this destructive genus (e.g. the late blight pathogen P. infestans and the sudden oak death pathogen P. ramorum), P. capsici has an explosive epidemiology, rapidly producing massive numbers of asexual spores on infected hosts (Lamour and Hausbeck 2001; Hausbeck and Lamour 2004; Lamour and Kamoun 2009) (Fig. 1B–G). In addition, P. capsici often features meiosis between two mating types, producing thick-walled oospores that remain dormant for years, making it very difficult to produce crops at infested sites, and allowing outcrossing populations to maintain significant genetic variation (Fig. 1A). Members of this genus are notoriously plastic in field and laboratory scenarios and we examined the molecular basis for rapid adaptation in P. capsici through genome sequencing, development of a high-density genetic map, and integrative genomic/genetic characterization of P. capsici field isolates and intercross progeny. Development of these tools and subsequent analyses revealed significant mitotic loss of heterozygosity (LOH) in clonally propagated field isolates as well as multiple sexual progeny. Follow-up tests revealed a strong association of LOH with changes in mating type and loss of pathogenicity.
Figure 1. Life cycle.

Thick walled dormant sexual oospores (A) are produced when plants are infected with both the A1 and A2 mating types. Asexual reproduction following infection rapidly creates very large populations of sporangia on the surface of the infected plants (B–D, G). Sporangia can detach and cause infection directly or, in the presence of free water, release 20–40 bi-flagellate swimming zoospores (E) that swim to plants and cause infection indirectly (F).
RESULTS
Genome sequencing, assembly and annotation
Assembling the nuclear genome of a diploid organism with frequent nucleotide variants can be difficult and a partially inbred line of P. capsici (LT1534) was developed for sequencing (Supplementary Fig. 1) (Hurtado-Gonzales and Lamour 2009; Gobena et al. 2012). The 64 Mbp reference genome was assembled using Arachne from 30X paired and singleton 454 FLX and Titanium genomic DNA reads, 5X Sanger paired reads, 56,448 Sanger ESTs, and 1,260 full-length cDNA sequences. This resulted in 917 scaffolds and an N50 of 706 kbp (Supplementary Table 1). The size of the P. capsici genome is intermediate among the sequenced oomycetes, larger than Albugo and Pythium ultimum (up to 45 Mbp) (Levesque et al. 2010; Kemen et al. 2011), but more compact than P. ramorum, P. sojae, Hyaloperonospora arabidopsis and P. infestans at 65, 95, 100, and 240 Mbp, respectively (Tyler et al. 2006; Haas et al. 2009; Baxter et al. 2010). The P. capsici draft genome had fewer scaffolds and/or larger scaffold N50, which may reflect hybrid assembly or fewer repeat sequences in P. capsici (19%) than P. infestans, P. sojae or P. ramorum (74%, 39%, and 28%, respectively) (Tyler et al. 2006; Haas et al. 2009). Like other Phytophthora species, the majority of P. capsici repeats were retrotransposons (84%) with long terminal repeats, of which 57% were Gypsy elements. The mitochondrial genome (80,148 bp) was assembled in 4 scaffolds.
Gene model prediction using a training set of 16.4 million sequencing-by-synthesis mRNA-sequences from nine life stages predicted 19,805 genes supported by cDNA sequences (50%) or previously identified proteins (75%) (Supplementary Tables 2 and 3). After excluding 2,682 genes with homology to transposable elements, P. capsici had a similar gene content to P. infestans, P. sojae and P. ramorum (17,797, 16,988 and 14,451, respectively) (Tyler et al. 2006; Haas et al. 2009) and had slightly more core eukaryotic genes identified compared to these other species (Supplementary Fig. 2). The non-repetitive gene density in P. capsici (268/Mbp) was higher than other Phytophthora species (74/Mbp in P. infestans, 179/Mb in P. sojae and 222/Mb in P. ramorum) (Tyler et al. 2006; Haas et al. 2009).
Comparison to other Phytophthora species
Genome comparisons revealed almost perfect scaffold-level synteny between the gene models of P. capsici, P. ramorum and P. sojae, with very little duplication (Fig. 2A, B). There was also extensive synteny with P. infestans genes (Supplementary Fig. 3). The genome organization of P. capsici was similar to other Phytophthora species, with ⅔ of the genes located in gene-rich blocks that have a conserved order and few repeats (median intergenic distance 351 bp), separated by relatively gene-poor regions without order conservation and more repetitive sequences (median intergenic distance ~3kb; Fig. 2C) (Haas et al. 2009). Like P. infestans, the 365 predicted P. capsici genes without a homolog resided predominantly in gene-poor genomic regions (Fig. 2C) (Haas et al. 2009; Raffaele et al. 2010).
Figure 2. Synteny and genome architecture of P. capsici.

Pairwise comparison of gene models from P. capsici to P. ramorum (A) and P. sojae (B). Sequences other than gene models were replaced with Ns. Maximal unique matches in all 6 frames were used as anchors for amino-acid-based alignment with the PROmer package of MUMmer. Scaffolds >450 kbp are shown (P. capsici: 46 Mb, P. ramorum: 36 Mb, P. sojae: 58 Mb). Scaffolds were ordered to maximize the center diagonal. There were some translocations, which possibly were assembly errors. A small region of P. sojae (top) had no syntenic genes in P. capsici. (C) P. capsici whole genome architecture illustrated by the distribution of all predicted genes according to the length of their 5′ (X-axis) and 3′ (Y-axis) intergenic regions, counted by two-dimensional binning. The color scale shows number of genes in bins. In addition, the 365 predicted proteins for which no homolog was found (10e-5 e-value cutoff) are indicated as dots.
Seventy eight percent of the predicted P. capsici genes clustered into 2,483 candidate multigene families. Among these families, there are cytoplasmic effector genes of the RxLR type including homologs of known avirulence genes in P. infestans (Whisson et al. 2007; Dou et al. 2008; Boutemy et al. 2011). P. capsici had 357 RxLR effector genes, which is a similar to the numbers reported for P. sojae and P. ramorum, whereas P. infestans had > 500 (Tyler et al. 2006; Haas et al. 2009). Phytophthora capsici also had 29 putative full length and 70 pseudogenes for Crinkling and Necrosis (CRN) effectors, an ancient class of intracellular effector proteins that share a highly conserved N-terminal domain, required for translocation, and diverse C-terminal effector domains (Haas et al. 2009). While markedly fewer than in P. infestans, the majority of predicted CRN effector domains were conserved between species.
Single nucleotide variation (SNV) and genetic mapping
Nucleotide diversity was assessed in seven P. capsici field isolates (including parental isolates TN1 and TN2) and an isolate of the sister species P. tropicalis by restriction-site associated DNA (RAD) sequencing (Supplementary Table 4) (Baird et al. 2008). Between 5 and 9 million sequencing-by-synthesis reads, flanked by a SgrAI restriction site, were generated per isolate (Table S5). The reads were aligned to the P. capsici reference genome and covered ~2.3 Mbp at a depth of ≥30-fold (Kim et al. 2009; Baranzini et al. 2010; Bell et al. 2011). The SNV density among P. capsici isolates was 23.4/kb (range 16.9 – 25.9/kb) and between P. capsici and the closely related species P. tropicalis was 51.7/kb (Supplementary Tables 6 and 7; Supplementary Figs. 4 and 5). This is much higher than the SNV diversity observed among P. infestans strains (0.65/Kb average) and between P. infestans T30-4 and species in its clade (7.67/Kb average) (Raffaele et al. 2010). The nucleotide diversity (π) was 0.012 (range 0.009 – 0.016), ~16-fold higher than H. sapiens and ~4-fold higher than obtained by RAD in natural stickleback populations and most outbred plant species. The threespined stickleback (Gasterosteus aculeatus L.) is an outcrossing species of fish studied to better understand adaptive evolution (Hohenlohe et al. 2010).
In addition, the inheritance of SNV’s was examined in 65 putative F1 intercross progeny by PstI-based RAD (Supplementary Figs. 1 and 6; Supplementary Table 8). Of these 65 isolates, two were found to be clonally derived from the TN2 parent and three additional isolates were clonal to progeny isolates. The remaining 60 true F1 progeny were genotyped at bi-allelic sites exhibiting either a di- or tri-modal distribution where the peaks corresponded to homozygous reference alleles, heterozygotes, and homozygous alternate alleles (Supplementary Fig. 7) (Kim et al. 2009). Genotypes were imputed at 500,352 nucleotides with ≥10 uniquely aligned reads in ≥55 progeny. Homozygosity was inferred when >90% reads displayed one allele, and heterozygosity when 20–80% of reads displayed one allele. We have previously shown such genotype imputation to be >99% accurate (Kim et al. 2009; Baranzini et al. 2010; Bell et al. 2011). Forty-five percent (9,254) of SNVs showing Mendelian inheritance were in coding regions, and 3,382 (37%) of these were non-synonymous (Supplementary Fig. 8a, Supplementary Table 10). The distribution of mutations in Phytophthora clade 1c species is in a similar range with 35% of SNV’s in coding regions, 41% of which are non-synonymous (Raffaele et al. 2010). This was surprising since there is typically extensive purifying selection on genes. A parsimonious explanation of these findings is that rates of mutation relative to generation times are much greater in P. capsici than higher eukaryotes.
A total of 20,568 SNVs were either polymorphic in the parents and had Mendelian segregation (χ2≥0.05), or were homozygous for opposite alleles in the parents and heterozygous in progeny that did not exhibit loss of heterozygosity (LOH) (marker spacing 3,111 bp; Supplementary Table 9). A genetic map was developed using markers on the 108 scaffolds that had sufficient SNVs for independent genetic linkage analysis in the F1 progeny. Of these, 92 scaffolds had SNV’s that were inherited as a single co-segregating block, while markers on 15 scaffolds broke into 2 blocks and markers on the largest scaffold (Scaffold 1) broke into three blocks (Supplementary Table 11; Supplementary Fig. 9). Scaffold-level linkage groups were inherited with LOD scores of ≥7. Following scaffold-level linkage analysis, a genetic map of P. capsici was constructed with 1,136 SNVs that had segregation patterns <95% similar. The genetic map was 1,654 centiMorgans (cM) in length and comprised eighteen linkage groups accounting for 84% (54Mbp) of the reference genome and containing ~90% of the predicted genes (Fig. 3; Supplementary Table 12). The order for the majority of markers was the same on the genetic and physical maps. Genetic linkage analysis localized the mating type locus to a ~300kb critical region on scaffold block 4.1 in LG10.
Figure 3. The 1654cM P. capsici genetic map.

The map contains 1,136 SNV markers and 18 linkage groups (LG’s). Linkage groups are colored by genome scaffold.
Loss of heterozygosity
Integrated genomic and genetic analysis allowed assessment of chromosomal variation among the 65 putative F1 intercross progeny. Twenty-three F1 isolates and two clonal isolates contained regions with LOH. LOH was identified by homozygosity at all markers in ≥ 2 adjacent (linked) RAD sequences that were incompatible with parental genotypes (Supplementary Fig. 10; Supplementary Table 13). The minimum length of LOH tracts varied from 299 bp to >1 Mbp. LOH occurred in 14 of the 18 LGs and in 59 scaffolds or scaffold blocks. Fifty-four percent (11,048) of SNVs exhibited LOH in at least one isolate and the LOH was bidirectional. The frequency and distribution of LOH tracts varied among isolates and 36.5% (19.7 Mbp) of the genome was affected by LOH in at least one isolate. Two isolates (TN37 and TN47) had LOH exceeding 10% of the genome (Supplementary Table 14). Interestingly, LOH showed bias toward gene-rich regions (Supplementary Fig. 8B, C). Given the requirements of informative parental genotypes, at least two adjacent RAD tags to be affected, and that LOH was sought only in the mapped genome, the true extent of LOH is likely to be considerably higher.
Sub-chromosomal mitotic LOH has several molecular mechanisms including deletions (resulting in hemizygosity) and translocations (resulting in homozygosity) associated with homologous and non-homologous recombination or gene conversion (Chamnanpunt et al. 2001; Cvitanich et al. 2006). Of note, mutagenesis-induced LOH in P. capsici was not associated with sub-chromosomal deletions (Hulvey et al. 2010). In only one of 12 isolates was LOH due to hemizygosity as assessed by batched, normalized sequence coverage plots (Bell et al. 2011) (Fig. 4A–C). Forty-five percent (4,967) of the marker nucleotides exhibiting LOH were exonic, 17% (1,911) were in coding regions and 3.5% (391) were predicted to be non-synonymous, affecting 264 genes. Phenotypic consequences of genome diversity were sought among F1 progeny. Five F1 isolates switched mating type from A2 to A1 between assessments in 2005 and RAD sequencing in 2010, while one switched from A1 to A2 (Fig. 5A). Isolates were in storage for most of this interval and were sub-cultured < 10 times. Four of the isolates that switched from A2 to A1 had >800 Kbp tracts of LOH encompassing a region that appears to contain the mating type locus (or loci) on LG10 (Fig. 5A). TN25, which changed from A1 to A2, did not exhibit LOH at the mating type locus but did have >1.6 Mbp LOH in LG16. However, A1 mating type isolates TN37 and TN70 had similar LOH on LG16, but did not change mating type. Thus, LOH at the mating type locus was associated with mating type switch in four of six isolates.
Figure 4. Ploidy for LOH regions.
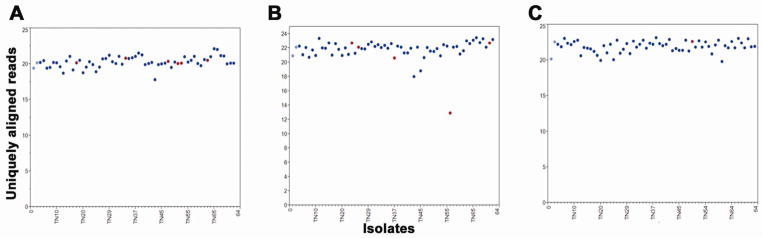
(A) Normalized sequence coverage of RAD tags across 50,649 nt of a 850,537 nt LOH tract on scaffold 4 (LG10) at nt 86,143 – 936,679 encompassing the mating type locus. The 6 isolates with LOH are denoted by red dots. Normalized coverage was obtained by dividing the average coverage across the tract by the total unique coverage for each sample. Parents are in light blue and non-LOH progeny are dark blue. (B) Normalized coverage of tags across 14,143 nt of a 415,652 nt LOH tract on scaffold 35 (LG16) at nt 141,346 – 556,998. Five isolates with LOH are in red. TN58 had ½ of the expected coverage, indicating LOH to reflect a sub-chromosomal deletion. (C) Normalized coverage of tags across 22,124 nt f a 655,528 nt LOH tract on scaffold 1 (LG9) at nt 87,441 – 742,969. TN50 had LOH of this region.
Figure 5. LOH in P. capsici.

(A) Graphical genotypes for LG10 in the region of scaffold 4 encompassing the mating type locus in parents (TN1 and TN2, black) and 59 F1 progeny. R = reference allele and A = alternate allele. Red asterisks to the left of the marker names denote unambiguous LOH loci. Dots represent missing genotypes. Six progeny had LOH in this region (in red), including four that switched mating type from A2 to A1 and two that remained A1 following LOH. Group 1: progeny 10, 13, 15, 16, 26, 29, 31, 35, 37–41, 46, 51, 54, 59–61, 64–66, 70, 71, and 9. Group 2: progeny 14, 17, 19–24, 27, 30, 33, 36, 42–45, 49, 5, 55, 58, 62, 67, and 68. (B) Association of LOH with loss of pathogenicity of P. capsici isolates in wound inoculated jalapeno fruits between 2005 and 2011. TN1 and TN2 are the parents. TN31 was representative for all progeny except TN37 and TN47. In 2011, the TN37 and TN47 genomes had 10.4% and 11.1% LOH, respectively, and these isolates no longer infected wounded fruit.
LOH was also associated with a loss of pathogenicity to pepper and cucumber fruit. Between tests in 2005 and 2011, progeny isolates TN37 and TN47 became unable to infect wounded or un-wounded fruit (Fig. 5B). In 2011, host cells consistently elicited a strong hypersensitive response (cell necrosis) at point of inoculation, suggesting loss of a factor necessary for infection, such as an Avh protein. This is characteristic of Phytophthora Avh proteins, which evolve rapidly in a presumed host-pathogen arms race (Tyler et al. 2006; Whisson et al. 2007; Jiang et al. 2008; Haas et al. 2009). These isolates had similar growth rates in vitro in 2005 and 2011 even after substantial LOH (Supplementary Table 14). Indeed, the TN37 and TN47 genomes each had > 10% LOH and share an LOH tract on LG1 (17_31,860 – 17_870,195 and 105_51,382 – 105_63734; Supplementary Tables 13–14). A plausible explanation is that LOH changed the expression or expressed sequence of one or more P. capsici effectors in the avirulent isolates.
DISCUSSION
In summary, the genome sequence of P. capsici was typical for the genus in organization and gene content. A prototypical, dense genetic map indicated the recombination rate of P. capsici to be 38.7 kbp/cM, an order of magnitude less than yeast, but 30-fold higher than H. sapiens (Li and Freudenberg 2009). SNV density and diversity among P. capsici genomes was much higher than in other eukaryotes and coding and non-synonymous variants were remarkably common. This suggests that germline mutation rates may be much higher in P. capsici than in H. sapiens, Saccharomyces cerevisiae, Drosophila melanogaster and P. infestans, or that purifying selection was less (Baranzini et al. 2010). The overall SNV diversity for the seven P. capsici field isolates was similar, but markedly different from the P. tropicalis isolate. The isolates from Peru and Argentina appear to be part of long-lived, widely dispersed clonal lineages where, unlike the situation for the North America isolates, sexual recombination may be rare (Hurtado-Gonzales et al. 2008; Gobena et al. 2012). Interestingly, the isolates from Peru and Argentina share the most polymorphic loci and may be derived from a common, invasive population or widely dispersed clonal lineage. The high level of SNV diversity in P. capsici has practical implications for research. The SNV’s can be used to finely map segregating phenotypes in larger populations of progeny, conduct sensitive analyses of population structure and overall dynamics, and to track the fate of numerous heterozygous loci during asexual growth (e.g. tracking LOH).
Phytophthora capsici populations are often characterized by high levels of diversity and rapid adaptation (Leonian 1922; Erwin and Ribeiro 1996; Lamour and Hausbeck 2001; Hausbeck and Lamour 2004; Gevens et al. 2008; Hurtado-Gonzales et al. 2008; Lamour and Kamoun 2009; Meitz et al. 2010; Lamour et al. 2011; Gobena et al. 2012). In addition to elevated genetic diversity, P. capsici genomes also had a remarkably high frequency of mitotic LOH occurring more commonly in gene rich areas. Mitotic genomic instability was also recently described in P. ramorum (Vercauteren et al. 2011), suggesting LOH may be a general characteristic of oomycetes. Here we show loss of pathogenicity and mating type switches are likely phenotypic consequences of mitotic LOH. For the latter, the evidence for causality of LOH was strong: four of five progeny that switched from the A2 to the A1 mating type had tracts of LOH spanning the region where mating type maps in this cross. This was reminiscent of the mating type locus in the fungus Candida albicans, where a repressor suppresses switching to the mating-competent form (Morschhauser 2010). Loss of mating type heterozygosity relieves this repression, ensuring that only mating type homozygous cells are mating-competent. An ability to switch mating type has important consequences, particularly in northern latitudes where survival of the winter or fallow months requires thick-walled, sexually-produced oospores (Lamour et al. 2011). It also provides a mechanism to introgress mutations efficiently into a population (Supplementary Figure 10). The fungicide mefenoxam, for example, is strongly inhibitory to P. capsici and has been widely used in some areas. Mefenoxam resistance is inherited in P. capsici as a single incompletely dominant trait (Lamour and Hausbeck 2000; Lamour and Hausbeck 2001). Mating type switches in a rare, partially resistant field isolate will double the chances for outcrossing. In addition to aiding introgression of a novel resistance allele by sexual reproduction, LOH could directly catalyze the conversion to full resistance. Using the SNV markers presented here, it should be possible to detect instances of LOH within naturally occurring isolates.
The dramatic expansion of repeated sequences observed in several pathogen lineages of oomycetes (P. infestans, H. arabidopsidis) and fungi (Puccinia graminis f. sp. tritici, Melampsora larci-populina, Blumeria graminis) was proposed to contribute to fast adaptation (Haas et al. 2009; Spanu et al. 2010). A clear correlation was indeed observed between the rate of gene evolution and the amount of flanking repeats (Raffaele et al. 2010). By contrast, the P. capsici genome is rather compact, with a relatively low repeat content, and yet shows remarkable plasticity. This plasticity may be due in part to LOH which represents an alternative mechanism for rapidly generating diversity, preferentially affecting gene dense regions. Previous studies suggest a role for LOH in adaptive evolution (Rosenberg 2011). It has, for example, been associated with oncogenesis and embryonic stem cell adaptation in H. sapiens (Narva et al. 2010), and fluconazole resistance in C. albicans (Forche et al. 2011). Here we extend these observations, suggesting that the co-occurrence of frequent mitotic LOH and high nucleotide diversity in genes may provide a general mechanism for rapid adaptation in P. capsici. In addition, LOH may contribute to the difficulties encountered when studying oomycetes in the laboratory (e.g. loss of pathogenicity and virulence) and the overall success of oomycetes as plant pathogens.
METHODS
Isolates
Three in vitro crosses were completed to produce a moderately inbred isolate for sequencing the reference genome (Hurtado-Gonzales and Lamour 2009). Crosses include an F1, and two recurrent backcrosses (BC1 and BC2). An isolate from the BC2 progeny was chosen for genome sequencing based on growth rate and asexual and sexual spore production (Hurtado-Gonzales and Lamour 2009). The initial cross was between an A1 isolate recovered from cucumber in Michigan in 1997 (TN1) and an A2 isolate recovered from pumpkin in Tennessee in 2004 (TN2). The backcrosses were to the TN2 parent. Crosses were made by co-culturing the parental isolates on V8-juice agar plates, incubating the plates for 8 to 12 weeks in darkness, and then separating the sexual oospores from the subtending asexual mycelium and other asexual spores (sporangia and zoospores) through mechanical shearing and an enzyme treatment to destroy the asexual material (Lamour and Hausbeck 2000). The enzymes not only destroy the asexual material; they stimulate oospore germination. Germinating oospores were harvested using a 5μl pipette while looking at the spores under a light microscope. Once harvested, the germinated spores are placed onto V8 media, sub-cultured to produce mycelium for DNA and to conduct mating type analysis, and then stored long term (3 to 5 years) in water with sterile hemp seeds.
The progeny from all of the crosses were genotyped using AFLP markers, tested for mating type, assessed for growth rate on agar media, and assayed for pathogenicity and virulence on detached pepper (variety Early Jalapeno) and cucumber fruit (various varieties) (Hurtado-Gonzales and Lamour 2009). All fruit inoculations were conducted on two fruit and the experiments repeated twice. Pathogenicity was assessed by placing a 7mm plug of mycelium at both a wounded and non-wounded site. Wounded sites are distal and non-wounded sites proximal to the stem end of the fruit. Pathogenicity to pepper fruit was assessed in 2005 and 2011. Sixty-nine progeny from the F1 were further analyzed using a focused re-sequencing strategy (outlined below). In addition, the mating type was tested at three different time intervals: within 6 months of the cross, at the time of the focused re-sequencing, and one year following the re-sequencing.
Genome sequencing and assembly
High quality genomic DNA was prepared from the isolate selected for genome sequencing using a phenol/chloroform protocol. Aliquots from the same batch of DNA were submitted to 454 Inc. (Branford, CT) and to the Joint Genome Institute (JGI, Walnut Creek, CA) for 454- and Sanger-based sequencing, respectively. A total of 2,451,737 random shotgun genomic reads, 2,022,402 paired-end reads (2.3 Kb), and 833,606 paired-end reads (18.0 Kb) were produced using the 454 Titanium chemistry. In addition, 197,306 random genomic paired-end reads from a 6.3Kb plasmid library, 146,588 paired-end reads from a 34.7Kb fosmid library and 65,000 ESTs were produced at the JGI using Sanger sequencing. Additionally, 1,260 full-length cDNA sequences were generated by Sanger sequencing and cDNA sequence assembly.
The sequence reads were assembled using a modified version of Arachne v.20071016 (Jaffe et al. 2003) with parameters maxcliq1=100, n_haplotypes=2 and BINGE_AND_PURGE=True. The output of this assembly was passed through Rebuilder and SquashOverlaps with parameters to merge adjacent assembled alternative haplotypes, and subsequently run through another complete Arachne assembly process to finalize the assembly. Prior to assembly, redundant 454 pairs (defined as at least 98% identical across their length) were removed and a single pair retained. An error correction step was applied to all 454 data that attempted to set bps to equal the Sanger sequence. This was accomplished by shredding the Sanger sequence to a similar size as the 454 reads and then aligning these shredded reads and the 454 simultaneously. Where the 454 read sequence had no support we changed the 454 read sequence to match the Sanger read sequence. This removed many of the 454 sequence errors (primarily indels and occasional bp substitutions) and coalesced the haplotyopes if the Sanger data was all from one haplotype. Error correction was also applied during the Arachne assembly process by screening each scaffold against bacterial proteins, organelle sequences and GenBank using Megablast against Genbank NR and blastp against a set of known microbial proteins. Twenty-eight scaffolds identified as prokaryotic contamination were removed. We classified additional scaffolds as mitochondrion (4), small repetitive (6), alternative haplotyope (17), and less than 1kb (1050). The final assembly consists of 971 scaffold sequences, with half of the genome contained in 29 scaffolds of at least 705.7 kb in length and contigs greater than 34.6kb. Scaffolds ranged in size from 1 kb to 2.1 Mb with an N50 of 705.7 kb (Supplementary Table 1). The genome size was tested using the approach outlined by Baxter with nt by nt coverage calculated by aligning back to the reference (Baxter et al. 2010). This resulted in an estimated genome size of approximately 55 Mbp. We also estimated the genome size by measuring the percentage of all reads that were captured by the assembly using a high quality 10,000 read subset (average quality >= 35, length >= 100 and no missing bases) and extrapolating genome size if the assembly had captured all the reads. We extrapolated up from the genome size that doesn’t include gaps (56.1 Mb) and 97.44% of the reads were captured leading to an estimated genome size of approximately 57 Mbp. Both estimates likely underestimate the genome size due to over alignment of repeat copies, possibly explaining the discrepancy between our gapped genome size (64.1 Mb) and these lower estimates of total genome size. Nevertheless, both estimates are similar to the non-gapped genome size (56.1 Mb) suggesting that the assembly is missing very little of the non-repetitive genome.
In addition, total RNA was isolated from different growth conditions (rich media, starvation, and sporulating), pooled, and submitted to both 454 and the JGI for Sanger cDNA and EST sequencing. At the JGI, ESTs were produced as previously described with the following modification: 2 cDNA libraries were constructed and sequenced and the size ranges of the cDNA library inserts were 0.6k–2kb and >2kb (Jeffries et al. 2007).
Genome sequence analysis and annotation of gene families
The genome assembly of Phytophthora capsici LT1534 was annotated using the JGI Annotation Pipeline, which combines several gene predictors: A) cDNA-based gene models were derived from 1260 full-length cDNAs and 11,090 consensus sequences clustered from 56,448 ESTs, and then mapped to genomic sequence, B) protein-based gene models were predicted using FGENESH+ (Salamov and Solovyev 2000) and GeneWise (Birney et al. 2004) seeded by BLASTx alignments of genomic sequence against sequences from the NCBI non-redundant protein set nr, and C) ab initio gene models were predicted using FGENESH trained on the set of putative full-length genes and reliable protein-based models. GeneWise models were completed using scaffold data to find start and stop codons. ESTs, EST clusters, EST contigs, and full length cDNAs were used to verify, complete, and extend the gene models. Because multiple gene models per locus were often generated, a single representative gene model for each locus was chosen based on homology and EST support, and used for further analysis. This led to a filtered set of 19,805 gene models (including 2,682 genes with homology to transposable elements) with their properties and support by different lines of evidence summarized in Supplementary Tables 2 and 3. All gene-based analyses were done on the full 19,805 gene set. A total of 56,448 ESTs are available in Genbank under the title “DOE Joint Genome Institute Phytophthora capsici EST project”. An additional 1260 full length cDNAs are available in Genbank under the title “DOE Joint Genome Institute Phytophthora capsici cDNA project”. The genome sequence is available at http://genome.jgi-psf.org/Phyca11/Phyca11.home.html.
All predicted gene models were functionally annotated by the JGI Annotation Pipeline using InterProScan (Zdobnov and Apweiler 2001) and hardware-accelerated double-affine Smith-Waterman alignments (http://www.timelogic.com/) against highly curated databases such as SwissProt (Bairoch et al. 2005), KEGG (Ogata et al. 1999), and Pfam (Bateman et al. 2004). KEGG hits were used to map EC numbers (Bairoch 2000), and InterPro, KEGG, and SwissProt hits were used to map GO terms (Ashburner et al. 2000). In addition, predicted proteins were annotated according to KOG classification (Koonin et al. 2004). Protein targeting predictions were made with signalP (Nielsen et al. 1999) and TMHMM (Krogh et al. 2001). Finally, all proteins were aligned by BLASTp to proteins in nr and to each other; after the latter analysis the alignment scores were used as a distance metric for clustering by MCL (http://www.micans.org/mcl/) into a first draft of 2,483 candidate multigene families. The same method was used to group genes with those of other Phytophthora species. We used BLASTP to identify Crinkler (CRN) coding genes from the P. capsici gene model set (Supplementary Table 16). For this purpose, 16 well characterized CRN proteins from P. infestans were searched against the P. capsici protein data set. Sequences with significant hits (E= <10-5) were retrieved and a non-redundant CRN-like protein set was created (Win et al. 2006). CRN-like protein sequences were manually examined for the presence of LFLAK motifs and C-terminal effector domains. To determine whether candidates are full length or pseudogenes, we aligned our CRN candidates with previously characterized CRNs. CRN proteins of at least 250 amino acid residues or more and that aligned with both the N and C-terminal domains of PiCRNs were considered full length (Haas et al. 2009). Finally, we used SignalP3.0 to identify predicted secretion signals for all CRN candidates (Supplementary Table 16). Candidate RxLR effectors were mined via the protocol outlined previously (Haas et al. 2009). In brief, all open reading frames greater than 210 nucleotides (70 AA) from the genome were generated and translated to amino acid coding sequences. Those containing an RXLR ( Arg - Anything - Leu - Arg) between 30 – 60 amino acids from the start, a signal peptide score greater than .9, and a cleavage site prior to the RXLR are considered effectors (Supplementary Table 17).
The CEGMA pipeline was used to compare the completeness and continuity of six Oomycete genomes (Parra et al. 2007). CEGMA checks the completeness and continuity of genome assemblies on the basis of 248 core eukaryotic genes. Here, we compared the CEGMA analyses (without KOG 69) for the genomes of P. sojae, P. ramorum, P. infestans, Pythium ultimum, and Hyaloperonospora arabidopsis to the draft genome of P. capsici reported here (Supplementary Table 15).
Transposon-like coding sequences were identified by searching the annotated protein-coding sequences of P. capsici against databases of transposon sequences with TransposonPSI (http://transposonpsi.sf.net). Nucleotide sequences corresponding to the coding regions of the annotated protein coding genes were searched against the TransposonPSI collection of transposon protein sequences using BLASTX. This included ORFs derived from mobile elements discovered in other sequenced Phytophthora genomes. In addition, the P. capsici protein sequences were searched against a collection of PSI-BLAST profiles corresponding to common families of transposable elements, including Gypsy-retrotransposons and Piggybac-transposons. Any P. capsici annotated coding sequence identified by having a BLAST E-value of at most 1e-10 was identified and reported, yielding 2,682 candidate gene annotations with transposon homology (see: Pcap.annot_transposon_mining.maxE_1e-10.txt.gz). Transposon family (PSI-BLAST) and top transposon protein BLASTX match are provided. Scaffolds, gene models clusters, and annotations thereof, may be accessed at the JGI P. capsici portal (http://www.jgi.doe.gov/capsici/) (Grigoriev et al. 2012).
Focused re-sequencing
Restriction site Associated DNA (RAD) sequencing was employed to identify and genotype single base substitutions in 7 field isolates (including the parents TN1 and TN2) and 69 progeny (TN3 – TN71) of the F1 cross (Baird et al. 2008). Briefly, genomic DNA was digested with the 6bp recognition restriction endonuclease PstI or the 8bp recognition SgrAI (Floragenex, Inc.). The digested DNA was sheared to between 200 and 500 bp and adaptors ligated which contained sequencing priming sites and an isolate-specific 5bp tag (Baird et al. 2008). Between 5 and 9 million sequencing-by-synthesis reads of length 72 nt were generated per isolate using an Illumina GAII sequencer (Supplementary Fig. 6, Supplementary Tables 5 and 8). The short reads abutting the restriction site are referred to as RAD tags. The RAD approach reduces complexity by focusing the sequencing to the regions directly adjacent (left and right) to a restriction site and the isolate-specific 5bp tags allow multiplexed sequencing. Reads were aligned to the P. capsici reference, covering ~2 million nucleotides at a depth of ≥30-fold (Supplementary Tables 5 and 8) (Kim et al. 2009; Baranzini et al. 2010; Bell et al. 2011).
SNV discovery and genotyping
Alignments of the RAD sequence and subsequent variant detection were carried out using the Genomic Short-read Nucleotide Alignment Program (GSNAP (Wu and Nacu 2010)) and the Alpheus pipeline (Miller et al. 2008), as described (Kim et al. 2009; Baranzini et al. 2010; Bell et al. 2011). Reads were aligned to the P. capsici genome assembly (version 11) and alignments retained that matched the genome with 95% identity or higher and that had ≤5 equally high scoring alignments. Reads with equally good hits to more than one genomic region, reflecting repeat content or redundancy in the assembly, were not considered uniquely aligned. Four isolates were excluded from analysis due to insufficient aligned reads (Supplementary Fig. 6). Read count–based allele frequencies of bi-allelic nucleotide variants had a tri-modal distribution, with peaks corresponding to homozygous reference alleles, heterozygotes, and homozygous alternate alleles (Supplementary Fig. 7) (Kim et al. 2009).
Potential segregating SNV sites were identified in the parents and progeny using the following criteria: ≥10X unique sequence coverage, an average quality score ≥20 and an alternate allele frequency ≥20% within unique reads. This pool of potential segregating sites was then analyzed across all lines and SNV genotyping criteria were developed based on a visual assessment of the distribution of alternate alleles at different levels of unique sequence coverage (Supplementary Fig. 7). SNVs were genotyped at the identified segregating SNV sites for all lines with at least 10X unique coverage where alternate allele frequency within unique reads was <10% (homozygous for the reference allele), >20% and <80% (heterozygous), or >90% (homozygous for the alternate allele). Our final pool of markers was limited to loci with 5 or fewer missing genotypes in the progeny. This approach does not enrich or bias for gene rich areas of the genome.
Nucleotide density and diversity was calculated for SNV sites in the SgrAI RAD tags from the P. capsici parents and five additional unrelated isolates (two of which represent very large clonal populations in Peru and Argentina) and a P. tropicalis isolate. Heterozygosity and homozygosity were distinguished by allele frequency cutoffs of 15% and 85% and there was no requirement for number of missing genotypes in the isolates. SNV diversity was calculated as previously described (Begun et al. 2007).
Loss of heterozygosity and clonal isolates
Loss of Heterozygosity (LOH) was assessed using graphical genotypes constructed by ordering the SNV loci according to (i) the genetic linkage of markers in the individual scaffolds and (ii) the genetic linkage of markers from all scaffolds together (see below). The minimum tracts of LOH were calculated for regions with continuous, uninterrupted switching of loci to either the reference or alternate allele (homozygosity) in a way that is impossible by normal meiosis or clonal reproduction (Judd and Petes 1988). To avoid minor genotyping errors, LOH was only assigned for tracts where the switched loci spanned at least two different sequencing sites. In addition, the junction of LOH versus non-LOH in an isolate with good sequence coverage was analyzed to compare the coverage on either side of the junction.
Genetic similarity of the parents and progeny was assessed in JMP Genomics by analyzing a relationship matrix for our final pool of markers using a Fast Ward Hierarchical clustering at the default settings. Alleles were assumed to be identical by descent. Putative clones were confirmed using the graphical genotypes. Genetic similarity analyses revealed three clonal lineages. One clonal lineage contained the parent isolate TN2 and the (mistaken) F1 progeny TN3 and TN50. Two other clonal lineages were derived from true F1 progeny and included isolates TN56, TN57, and TN63 in one clonal lineage and isolates TN8 and TN11 in another clonal lineage (Supplementary Fig. 11). This was not surprising since occasional sporangia survive the enzymatic treatment used to destroy asexual propagules, and premature oospore germination can produce sporangia that appear to be discrete oospore progeny. A single isolate of each lineage was retained for genetic linkage analysis. Apomixis, which occurred in other crosses stemming from these parents, is another possible explanation for the clones of the TN2 parent (Hurtado-Gonzales and Lamour 2009).
Genetic linkage analysis
Putative segregating markers were analyzed using a Chi-square test for simple Mendelian inheritance (5% significance). A total of 20,568 SNVs were either polymorphic in the parents and had Mendelian segregation (χ2≥=0.05), or were homozygous for opposite alleles in the parents and heterozygous in progeny that did not exhibit LOH. These were used for genetic linkage analysis (average marker spacing 3,111 bp; Supplementary Table 9).
A total of 3,141 SNVs exhibited segregation ratios <5% by χ2-test. Some of these clustered in blocks and may reflect gene conversion, as described in other Phytophthora species (Chamnanpunt et al. 2001; Cvitanich et al. 2006). An additional ~100 loci were heterozygous in both parents and all progeny and may reflect assembly artifacts, copy number variants or obligate heterozygosity.
Mendelian markers were further analyzed using JoinMap 4.1 at the default settings for a CP type cross (heterogeneously heterozygous with phase unknown) (van Ooijen 2011). Initially, markers from individual scaffolds were analyzed to determine if they are inherited as a linked unit (expected if the scaffold is assembled correctly). If a scaffold broke into more than one piece, the pieces are referred to as scaffold blocks. Following this, markers from all the scaffolds, or scaffold blocks, were analyzed together to produce a linkage map. The LGs were further refined to include only markers with segregation patterns <95% similar and to exclude isolates showing any LOH within the LG. Markers are named with the scaffold number followed by the nucleotide position on the scaffold. Additional information was included for the markers used in JoinMap 4.1 to designate the three possible segregation scenarios: hk = heterozygous in both parents, nn = Parent 1 is homozygous and Parent 2 is heterozygous, and lm = Parent 1 is heterozygous and Parent 2 is homozygous.
The SNV genotyping error rates were assessed for both parents (TN1 and TN2) at 95 polymorphic sites in portions of 30 genes across 14 linkage groups by Sanger sequencing of PCR products. Of these 190 genotypes, all but 5 were confirmed. The 5 genotypes that differed occurred on a single gene that switched to homozygosity at all 5 sites.
Supplementary Material
Acknowledgments
Sequences, assembly and annotations are available via the JGI Genome Portal at http://jgi.doe.gov/capsici and at DDBJ/EMBL/GenBank under the accession ADVJ00000000.
This work was supported by grants to SFK from the National Science Foundation (05-512), US Department of Agriculture, and Joint Genome Institute Community Sequencing Program. The work conducted by the U.S. Department of Energy Joint Genome Institute is supported by the Office of Science of the U.S. Department of Energy under Contract No. DE-AC02-05CH11231. JM was supported in part by NIH grant RR016480. SR was supported by a Marie Curie Fellowship (contract 255104). RStam and EH were supported by the BBSRC and Royal Society of Edinburgh. LC, JW and SK were supported by the Gatsby Charitable Foundation. RSharma and MT are supported by the LOEWE Initiative of the state of Hesse. KL was supported by a grant from the UTIA AgResearch program. We thank Paul Richardson and Eddy Rubin for JGI support in genome sequencing.
Footnotes
AUTHOR CONTRIBUTIONS
Manuscript Preparation: KHL, SFK, JM, SK, EH, SR, IVG, AK, RStam, AKB, MT; Crosses, phenotypic analyses, and genetic analyses: KHL, DG, OPH, ASavidor, JH, and DS; Genomic or Transcriptomic Sequencing: JK, JA, EAL, SFK, JM, DLD, CD, OC, CSH; Assembly: JS, DP; Annotation: AK, ASalamov, IVG; Alignments and variant detection: NAM, BJR, JM KHL; Analysis: KHL, JM, SFK, SK, EH, DS, SR, LMC, AK, IVG, AKB, RSD, SF, ASavidor, DG, OPH, JH, RSharma, RStam, DS, MT, JW, BJH, CD, CSH, OC.
References and Notes
- Ashburner M, Ball CA, Blake JA, Botstein D, Butler H, Cherry JM, Davis AP, Dolinski K, Dwight SS, Eppig JT, Harris MA, Hill DP, Issel-Tarver L, Kasarskis A, Lewis S, Matese JC, Richardson JE, Ringwald M, Rubin GM, Sherlock G. Gene ontology: tool for the unification of biology. The Gene Ontology Consortium. Nat Genet. 2000;25:25–29. doi: 10.1038/75556. [DOI] [PMC free article] [PubMed] [Google Scholar]
- Baird NA, Etter PD, Atwood TS, Currey MC, Shiver AL, Lewis ZA, Selker EU, Cresko WA, Johnson EA. Rapid SNP discovery and genetic mapping using sequenced RAD markers. PLoS One. 2008;3:e3376. doi: 10.1371/journal.pone.0003376. [DOI] [PMC free article] [PubMed] [Google Scholar]
- Bairoch A. The ENZYME database in 2000. Nucleic Acids Res. 2000;28:304–305. doi: 10.1093/nar/28.1.304. [DOI] [PMC free article] [PubMed] [Google Scholar]
- Bairoch A, Apweiler R, Wu CH, Barker WC, Boeckmann B, Ferro S, Gasteiger E, Huang H, Lopez R, Magrane M, Martin MJ, Natale DA, O’Donovan C, Redaschi N, Yeh LS. The Universal Protein Resource (UniProt) Nucleic Acids Res. 2005;33:D154–159. doi: 10.1093/nar/gki070. [DOI] [PMC free article] [PubMed] [Google Scholar]
- Baranzini SE, Mudge J, van Velkinburgh JC, Khankhanian P, Khrebtukova I, Miller NA, Zhang L, Farmer AD, Bell CJ, Kim RW, May GD, Woodward JE, Caillier SJ, McElroy JP, Gomez R, Pando MJ, Clendenen LE, Ganusova EE, Schilkey FD, Ramaraj T, Khan OA, Huntley JJ, Luo S, Kwok PY, Wu TD, Schroth GP, Oksenberg JR, Hauser SL, Kingsmore SF. Genome, epigenome and RNA sequences of monozygotic twins discordant for multiple sclerosis. Nature. 2010;464:1351–1356. doi: 10.1038/nature08990. [DOI] [PMC free article] [PubMed] [Google Scholar]
- Bateman A, Coin L, Durbin R, Finn RD, Hollich V, Griffiths Jones S, Khanna A, Marshall M, Moxon S, Sonnhammer ELL. The Pfam protein families database. Nucleic acids research. 2004;32:D138–D141. doi: 10.1093/nar/gkh121. [DOI] [PMC free article] [PubMed] [Google Scholar]
- Baxter L, Tripathy S, Ishaque N, Boot N, Cabral A, Kemen E, Thines M, Ah-Fong A, Anderson R, Badejoko W. Signatures of adaptation to obligate biotrophy in the Hyaloperonospora arabidopsidis genome. Science. 2010;330:1549. doi: 10.1126/science.1195203. [DOI] [PMC free article] [PubMed] [Google Scholar]
- Begun DJ, Holloway AK, Stevens K, Hillier LW, Poh YP, Hahn MW, Nista PM, Jones CD, Kern AD, Dewey CN, Pachter L, Myers E, Langley CH. Population genomics: whole-genome analysis of polymorphism and divergence in Drosophila simulans. PLoS Biol. 2007;5:e310. doi: 10.1371/journal.pbio.0050310. [DOI] [PMC free article] [PubMed] [Google Scholar]
- Bell CJ, Dinwiddie DL, Miller NA, Hateley SL, Ganusova EE, Mudge J, Langley RJ, Zhang L, Lee CC, Schilkey FD, Sheth V, Woodward JE, Peckham HE, Schroth GP, Kim RW, Kingsmore SF. Carrier testing for severe childhood recessive diseases by next-generation sequencing. Sci Transl Med. 2011;3:65ra64. doi: 10.1126/scitranslmed.3001756. [DOI] [PMC free article] [PubMed] [Google Scholar]
- Birney E, Clamp M, Durbin R. GeneWise and Genomewise. Genome Res. 2004;14:988–995. doi: 10.1101/gr.1865504. [DOI] [PMC free article] [PubMed] [Google Scholar]
- Boutemy LS, King SR, Win J, Hughes RK, Clarke TA, Blumenschein TM, Kamoun S, Banfield MJ. Structures of Phytophthora RXLR effector proteins: a conserved but adaptable fold underpins functional diversity. J Biol Chem. 2011;286:35834–35842. doi: 10.1074/jbc.M111.262303. [DOI] [PMC free article] [PubMed] [Google Scholar]
- Chamnanpunt J, Shan WX, Tyler BM. High frequency mitotic gene conversion in genetic hybrids of the oomycete Phytophthora sojae. Proc Natl Acad Sci U S A. 2001;98:14530–14535. doi: 10.1073/pnas.251464498. [DOI] [PMC free article] [PubMed] [Google Scholar]
- Cvitanich C, Salcido M, Judelson HS. Concerted evolution of a tandemly arrayed family of mating-specific genes in Phytophthora analyzed through inter- and intraspecific comparisons. Mol Genet Genomics. 2006;275:169–184. doi: 10.1007/s00438-005-0074-8. [DOI] [PubMed] [Google Scholar]
- Dou D, Kale SD, Wang X, Chen Y, Wang Q, Jiang RH, Arredondo FD, Anderson RG, Thakur PB, McDowell JM, Wang Y, Tyler BM. Conserved C-terminal motifs required for avirulence and suppression of cell death by Phytophthora sojae effector Avr1b. Plant Cell. 2008;20:1118–1133. doi: 10.1105/tpc.107.057067. [DOI] [PMC free article] [PubMed] [Google Scholar]
- Erwin DC, Ribeiro OK. Phytophthora diseases worldwide. The American Phytopathological Society; St. Paul, MN: 1996. [Google Scholar]
- Forche A, Abbey D, Pisithkul T, Weinzierl MA, Ringstrom T, Bruck D, Petersen K, Berman J. Stress alters rates and types of loss of heterozygosity in Candida albicans. MBio. 2011:2. doi: 10.1128/mBio.00129-11. [DOI] [PMC free article] [PubMed] [Google Scholar]
- Gevens AJ, Donahoo RS, Lamour KH, Hausbeck MK. Characterization of Phytophthora capsici causing foliar and pod blight of snap bean in Michigan. Plant Dis. 2008;92:201–209. doi: 10.1094/PDIS-92-2-0201. [DOI] [PubMed] [Google Scholar]
- Gobena D, Roig J, Galmarini C, Hulvey J, Lamour KH. Genetic diversity of Phytophthora capsici isolates from pepper and pumpkin in Argentina. Mycologia. 2012;104:102–107. doi: 10.3852/11-147. [DOI] [PubMed] [Google Scholar]
- Grigoriev IV, Nordberg H, Shabalov I, Aerts A, Cantor M, Goodstein D, Kuo A, Minovitsky S, Nikitin R, Ohm RA, Otillar R, Poliakov A, Ratnere I, Riley R, Smirnova T, Rokhsar D, Dubchak I. The genome portal of the department of energy joint genome institute. Nucleic Acids Res. 2012;40:D26–32. doi: 10.1093/nar/gkr947. [DOI] [PMC free article] [PubMed] [Google Scholar]
- Haas BJ, Kamoun S, Zody MC, Jiang RH, Handsaker RE, Cano LM, Grabherr M, Kodira CD, Raffaele S, Torto-Alalibo T, Bozkurt TO, Ah-Fong AM, Alvarado L, Anderson VL, Armstrong MR, Avrova A, Baxter L, Beynon J, Boevink PC, Bollmann SR, Bos JI, Bulone V, Cai G, Cakir C, Carrington JC, Chawner M, Conti L, Costanzo S, Ewan R, Fahlgren N, Fischbach MA, Fugelstad J, Gilroy EM, Gnerre S, Green PJ, Grenville-Briggs LJ, Griffith J, Grunwald NJ, Horn K, Horner NR, Hu CH, Huitema E, Jeong DH, Jones AM, Jones JD, Jones RW, Karlsson EK, Kunjeti SG, Lamour K, Liu Z, Ma L, Maclean D, Chibucos MC, McDonald H, McWalters J, Meijer HJ, Morgan W, Morris PF, Munro CA, O’Neill K, Ospina-Giraldo M, Pinzon A, Pritchard L, Ramsahoye B, Ren Q, Restrepo S, Roy S, Sadanandom A, Savidor A, Schornack S, Schwartz DC, Schumann UD, Schwessinger B, Seyer L, Sharpe T, Silvar C, Song J, Studholme DJ, Sykes S, Thines M, van de Vondervoort PJ, Phuntumart V, Wawra S, Weide R, Win J, Young C, Zhou S, Fry W, Meyers BC, van West P, Ristaino J, Govers F, Birch PR, Whisson SC, Judelson HS, Nusbaum C. Genome sequence and analysis of the Irish potato famine pathogen Phytophthora infestans. Nature. 2009;461:393–398. doi: 10.1038/nature08358. [DOI] [PubMed] [Google Scholar]
- Hausbeck MK, Lamour KH. Phytophthora capsici on vegetable crops: Research progress and management challenges. Plant Dis. 2004;88:1292–1303. doi: 10.1094/PDIS.2004.88.12.1292. [DOI] [PubMed] [Google Scholar]
- Hohenlohe PA, Bassham S, Etter PD, Stiffler N, Johnson EA, Cresko WA. Population genomics of parallel adaptation in threespine stickleback using sequenced RAD tags. PLoS Genet. 2010;6:e1000862. doi: 10.1371/journal.pgen.1000862. [DOI] [PMC free article] [PubMed] [Google Scholar]
- Hulvey J, Young J, Finley L, Lamour K. Loss of heterozygosity in Phytophthora capsici after N-ethyl-nitrosourea mutagenesis. Mycologia. 2010;102:27–32. doi: 10.3852/09-102. [DOI] [PubMed] [Google Scholar]
- Hurtado-Gonzales O, Aragon-Caballero L, Apaza-Tapia W, Donahoo R, Lamour K. Survival and spread of Phytophthora capsici in coastal Peru. Phytopathology. 2008;98:688–694. doi: 10.1094/PHYTO-98-6-0688. [DOI] [PubMed] [Google Scholar]
- Hurtado-Gonzales OP, Lamour KH. Evidence for inbreeding and apomixis in close crosses of Phytophthora capsici. Plant Path. 2009;58:715–722. [Google Scholar]
- Jaffe DB, Butler J, Gnerre S, Mauceli E, Lindblad-Toh K, Mesirov JP, Zody MC, Lander ES. Whole-genome sequence assembly for mammalian genomes: Arachne 2. Genome Res. 2003;13:91–96. doi: 10.1101/gr.828403. [DOI] [PMC free article] [PubMed] [Google Scholar]
- Jeffries TW, Grigoriev IV, Grimwood J, Laplaza JM, Aerts A, Salamov A, Schmutz J, Lindquist E, Dehal P, Shapiro H, Jin YS, Passoth V, Richardson PM. Genome sequence of the lignocellulose-bioconverting and xylose-fermenting yeast Pichia stipitis. Nat Biotechnol. 2007;25:319–326. doi: 10.1038/nbt1290. [DOI] [PubMed] [Google Scholar]
- Jiang RH, Tripathy S, Govers F, Tyler BM. RXLR effector reservoir in two Phytophthora species is dominated by a single rapidly evolving superfamily with more than 700 members. Proc Natl Acad Sci U S A. 2008;105:4874–4879. doi: 10.1073/pnas.0709303105. [DOI] [PMC free article] [PubMed] [Google Scholar]
- Judd SR, Petes TD. Physical lengths of meiotic and mitotic gene conversion tracts in Saccharomyces cerevisiae. Genetics. 1988;118:401–410. doi: 10.1093/genetics/118.3.401. [DOI] [PMC free article] [PubMed] [Google Scholar]
- Kemen E, Gardiner A, Schultz-Larsen T, Kemen AC, Balmuth AL, Robert-Seilaniantz A, Bailey K, Holub E, Studholme DJ, Maclean D, Jones JD. Gene gain and loss during evolution of obligate parasitism in the white rust pathogen of Arabidopsis thaliana. PLoS Biol. 2011;9:e1001094. doi: 10.1371/journal.pbio.1001094. [DOI] [PMC free article] [PubMed] [Google Scholar]
- Kim JI, Ju YS, Park H, Kim S, Lee S, Yi JH, Mudge J, Miller NA, Hong D, Bell CJ, Kim HS, Chung IS, Lee WC, Lee JS, Seo SH, Yun JY, Woo HN, Lee H, Suh D, Lee S, Kim HJ, Yavartanoo M, Kwak M, Zheng Y, Lee MK, Park H, Kim JY, Gokcumen O, Mills RE, Zaranek AW, Thakuria J, Wu X, Kim RW, Huntley JJ, Luo S, Schroth GP, Wu TD, Kim H, Yang KS, Park WY, Kim H, Church GM, Lee C, Kingsmore SF, Seo JS. A highly annotated whole-genome sequence of a Korean individual. Nature. 2009;460:1011–1015. doi: 10.1038/nature08211. [DOI] [PMC free article] [PubMed] [Google Scholar]
- Koonin EV, Fedorova ND, Jackson JD, Jacobs AR, Krylov DM, Makarova KS, Mazumder R, Mekhedov SL, Nikolskaya AN, Rao BS, Rogozin IB, Smirnov S, Sorokin AV, Sverdlov AV, Vasudevan S, Wolf YI, Yin JJ, Natale DA. A comprehensive evolutionary classification of proteins encoded in complete eukaryotic genomes. Genome Biol. 2004;5:R7. doi: 10.1186/gb-2004-5-2-r7. [DOI] [PMC free article] [PubMed] [Google Scholar]
- Krogh A, Larsson B, von Heijne G, Sonnhammer EL. Predicting transmembrane protein topology with a hidden Markov model: application to complete genomes. J Mol Biol. 2001;305:567–580. doi: 10.1006/jmbi.2000.4315. [DOI] [PubMed] [Google Scholar]
- Lamour K, Kamoun S. Oomycete genetics and genomics: diversity, interactions, and research tools. Blackwell Pub; Hoboken, NJ: 2009. [Google Scholar]
- Lamour KH, Hausbeck MK. Mefenoxam insensitivity and the sexual stage of Phytophthora capsici in Michigan cucurbit fields. Phytopathology. 2000;90:396–400. doi: 10.1094/PHYTO.2000.90.4.396. [DOI] [PubMed] [Google Scholar]
- Lamour KH, Hausbeck MK. The dynamics of mefenoxam insensitivity in a recombining population of Phytophthora capsici characterized with Amplified Fragment Length Polymorphism markers. Phytopathology. 2001;91:553–557. doi: 10.1094/PHYTO.2001.91.6.553. [DOI] [PubMed] [Google Scholar]
- Lamour KH, Stam R, Jupe J, Huitema E. The oomycete broad-host-range pathogen Phytophthora capsici. Mol Plant Pathol. 2011 doi: 10.1111/j.1364-3703.2011.00754.x. [DOI] [PMC free article] [PubMed] [Google Scholar]
- Leonian LH. Stem and fruit blight of peppers caused by Phytophthora capsici sp. nov. Phytopathology. 1922;12:M08. [Google Scholar]
- Levesque CA, Brouwer H, Cano L, Hamilton JP, Holt C, Huitema E, Raffaele S, Robideau GP, Thines M, Win J. Genome sequence of the necrotrophic plant pathogen Pythium ultimum reveals original pathogenicity mechanisms and effector repertoire. Genome Bio. 2010;11:R73. doi: 10.1186/gb-2010-11-7-r73. [DOI] [PMC free article] [PubMed] [Google Scholar]
- Li W, Freudenberg J. Two-parameter characterization of chromosome-scale recombination rate. Genome Res. 2009;19:2300–2307. doi: 10.1101/gr.092676.109. [DOI] [PMC free article] [PubMed] [Google Scholar]
- Meitz JC, Linde CC, Thompson A, Langenhoven S, McLeod A. Phytophthora capsici on vegetable hosts in South Africa: distribution, host range and genetic diversity. Australasian Plant Path. 2010;39:431–439. [Google Scholar]
- Miller NA, Kingsmore SF, Farmer A, Langley RJ, Mudge J, Crow JA, Gonzalez AJ, Schilkey FD, Kim RJ, van Velkinburgh J, May GD, Black CF, Myers MK, Utsey JP, Frost NS, Sugarbaker DJ, Bueno R, Gullans SR, Baxter SM, Day SW, Retzel EF. Management of high-throughput DNA sequencing projects: Alpheus. J Comput Sci Syst Biol. 2008;1:132. doi: 10.4172/jcsb.1000013. [DOI] [PMC free article] [PubMed] [Google Scholar]
- Morschhauser J. Regulation of white-opaque switching in Candida albicans. Med Microbiol Immunol. 2010;199:165–172. doi: 10.1007/s00430-010-0147-0. [DOI] [PubMed] [Google Scholar]
- Narva E, Autio R, Rahkonen N, Kong L, Harrison N, Kitsberg D, Borghese L, Itskovitz-Eldor J, Rasool O, Dvorak P, Hovatta O, Otonkoski T, Tuuri T, Cui W, Brustle O, Baker D, Maltby E, Moore HD, Benvenisty N, Andrews PW, Yli-Harja O, Lahesmaa R. High-resolution DNA analysis of human embryonic stem cell lines reveals culture-induced copy number changes and loss of heterozygosity. Nat Biotechnol. 2010;28:371–377. doi: 10.1038/nbt.1615. [DOI] [PubMed] [Google Scholar]
- Nielsen H, Brunak S, von Heijne G. Machine learning approaches for the prediction of signal peptides and other protein sorting signals. Protein Eng. 1999;12:3–9. doi: 10.1093/protein/12.1.3. [DOI] [PubMed] [Google Scholar]
- Ogata H, Goto S, Sato K, Fujibuchi W, Bono H, Kanehisa M. KEGG: Kyoto Encyclopedia of Genes and Genomes. Nucleic Acids Res. 1999;27:29–34. doi: 10.1093/nar/27.1.29. [DOI] [PMC free article] [PubMed] [Google Scholar]
- Parra G, Bradnam K, Korf I. CEGMA: a pipeline to accurately annotate core genes in eukaryotic genomes. Bioinformatics. 2007;23:1061–1067. doi: 10.1093/bioinformatics/btm071. [DOI] [PubMed] [Google Scholar]
- Raffaele S, Farrer RA, Cano LM, Studholme DJ, MacLean D, Thines M, Jiang RH, Zody MC, Kunjeti SG, Donofrio NM, Meyers BC, Nusbaum C, Kamoun S. Genome evolution following host jumps in the Irish potato famine pathogen lineage. Science. 2010;330:1540–1543. doi: 10.1126/science.1193070. [DOI] [PubMed] [Google Scholar]
- Rosenberg SM. Stress-induced loss of heterozygosity in Candida: a possible missing link in the ability to evolve. MBio. 2011:2. doi: 10.1128/mBio.00200-11. [DOI] [PMC free article] [PubMed] [Google Scholar]
- Salamov AA, Solovyev VV. Ab initio gene finding in Drosophila genomic DNA. Genome Res. 2000;10:516–522. doi: 10.1101/gr.10.4.516. [DOI] [PMC free article] [PubMed] [Google Scholar]
- Spanu PD, Abbott JC, Amselem J, Burgis TA, Soanes DM, Stuber K, Ver Loren van Themaat E, Brown JK, Butcher SA, Gurr SJ, Lebrun MH, Ridout CJ, Schulze-Lefert P, Talbot NJ, Ahmadinejad N, Ametz C, Barton GR, Benjdia M, Bidzinski P, Bindschedler LV, Both M, Brewer MT, Cadle-Davidson L, Cadle-Davidson MM, Collemare J, Cramer R, Frenkel O, Godfrey D, Harriman J, Hoede C, King BC, Klages S, Kleemann J, Knoll D, Koti PS, Kreplak J, Lopez-Ruiz FJ, Lu X, Maekawa T, Mahanil S, Micali C, Milgroom MG, Montana G, Noir S, O’Connell RJ, Oberhaensli S, Parlange F, Pedersen C, Quesneville H, Reinhardt R, Rott M, Sacristan S, Schmidt SM, Schon M, Skamnioti P, Sommer H, Stephens A, Takahara H, Thordal-Christensen H, Vigouroux M, Wessling R, Wicker T, Panstruga R. Genome expansion and gene loss in powdery mildew fungi reveal tradeoffs in extreme parasitism. Science. 2010;330:1543–1546. doi: 10.1126/science.1194573. [DOI] [PubMed] [Google Scholar]
- Tyler BM, Tripathy S, Zhang X, Dehal P, Jiang RH, Aerts A, Arredondo FD, Baxter L, Bensasson D, Beynon JL, Chapman J, Damasceno CM, Dorrance AE, Dou D, Dickerman AW, Dubchak IL, Garbelotto M, Gijzen M, Gordon SG, Govers F, Grunwald NJ, Huang W, Ivors KL, Jones RW, Kamoun S, Krampis K, Lamour KH, Lee MK, McDonald WH, Medina M, Meijer HJ, Nordberg EK, Maclean DJ, Ospina-Giraldo MD, Morris PF, Phuntumart V, Putnam NH, Rash S, Rose JK, Sakihama Y, Salamov AA, Savidor A, Scheuring CF, Smith BM, Sobral BW, Terry A, Torto-Alalibo TA, Win J, Xu Z, Zhang H, Grigoriev IV, Rokhsar DS, Boore JL. Phytophthora genome sequences uncover evolutionary origins and mechanisms of pathogenesis. Science. 2006;313:1261–1266. doi: 10.1126/science.1128796. [DOI] [PubMed] [Google Scholar]
- van Ooijen J. Multipoint maximum likelihood mapping in a full-sib family of an outbreeding species. Genet Res (Camb) 2011;93:343–349. doi: 10.1017/S0016672311000279. [DOI] [PubMed] [Google Scholar]
- Vercauteren A, Boutet X, D’Hondt L, Bockstaele EV, Maes M, Leus L, Chandelier A, Heungens K. Aberrant genome size and instability of Phytophthora ramorum oospore progenies. Fungal Gen Biol. 2011;48:537–543. doi: 10.1016/j.fgb.2011.01.008. [DOI] [PubMed] [Google Scholar]
- Whisson SC, Boevink PC, Moleleki L, Avrova AO, Morales JG, Gilroy EM, Armstrong MR, Grouffaud S, Van West P, Chapman S. A translocation signal for delivery of oomycete effector proteins into host plant cells. Nature. 2007;450:115–118. doi: 10.1038/nature06203. [DOI] [PubMed] [Google Scholar]
- Win J, Kanneganti TD, Torto-Alalibo T, Kamoun S. Computational and comparative analyses of 150 full-length cDNA sequences from the oomycete plant pathogen Phytophthora infestans. Fungal Genet Biol. 2006;43:20–33. doi: 10.1016/j.fgb.2005.10.003. [DOI] [PubMed] [Google Scholar]
- Wu TD, Nacu S. Fast and SNP-tolerant detection of complex variants and splicing in short reads. Bioinformatics. 2010;26:873–881. doi: 10.1093/bioinformatics/btq057. [DOI] [PMC free article] [PubMed] [Google Scholar]
- Zdobnov EM, Apweiler R. InterProScan--an integration platform for the signature-recognition methods in InterPro. Bioinformatics. 2001;17:847–848. doi: 10.1093/bioinformatics/17.9.847. [DOI] [PubMed] [Google Scholar]
Associated Data
This section collects any data citations, data availability statements, or supplementary materials included in this article.